Cities with the Highest Percentage of Dutch Population in New Jersey
RELATED REPORTS & OPTIONS
Dutch
New Jersey
Compare Cities
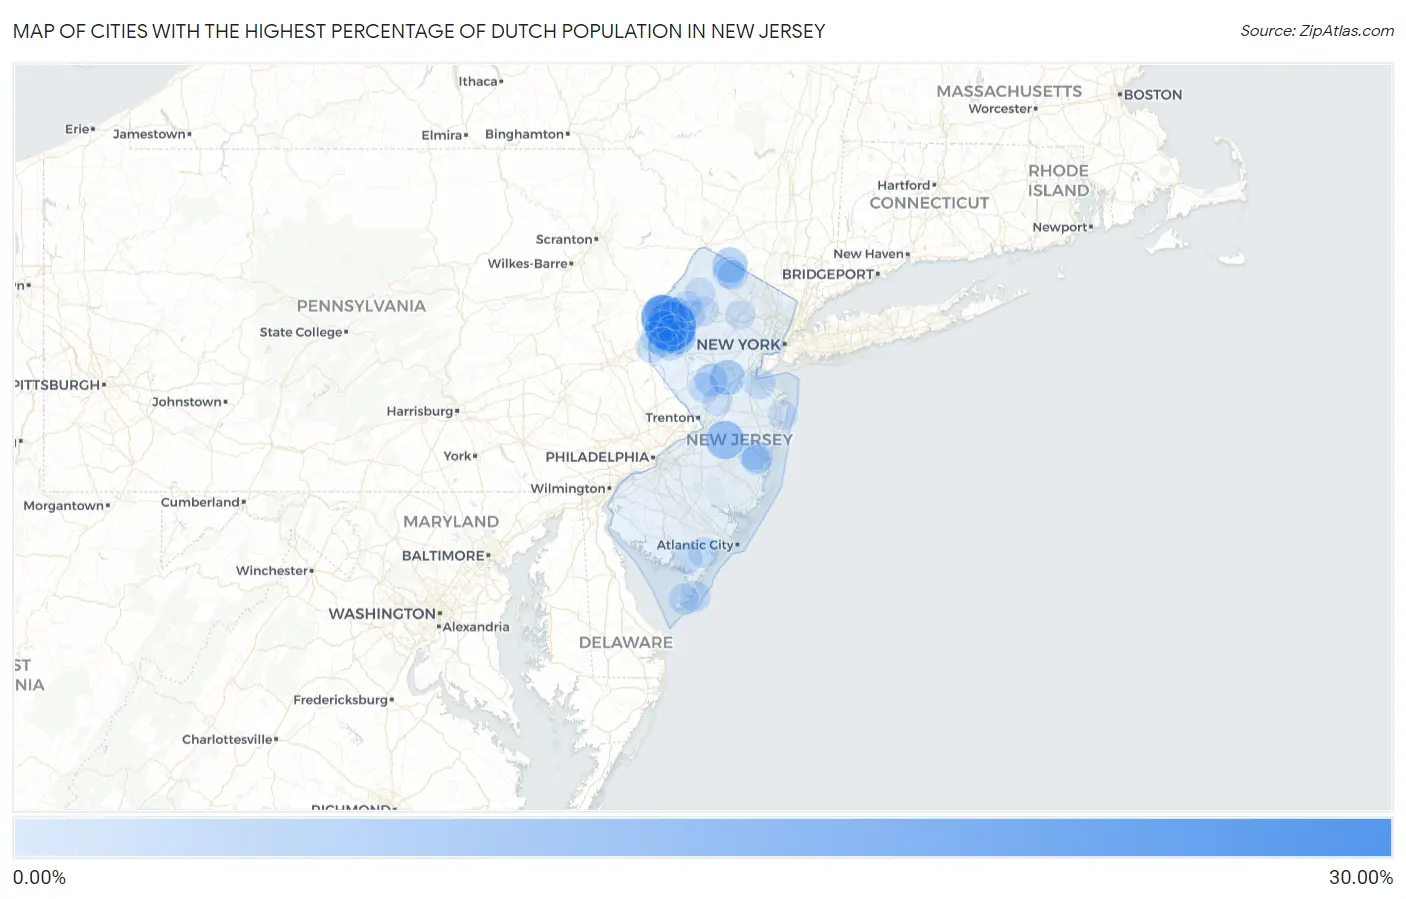
Map of Cities with the Highest Percentage of Dutch Population in New Jersey
0.00%
30.00%
Cities with the Highest Percentage of Dutch Population in New Jersey
| City | Dutch | vs State | vs National | |
| 1. | Deerfield Street | 26.00% | 0.77%(+25.2)#1 | 1.01%(+25.0)#129 |
| 2. | Buttzville | 24.27% | 0.77%(+23.5)#2 | 1.01%(+23.3)#148 |
| 3. | Richland | 22.59% | 0.77%(+21.8)#3 | 1.01%(+21.6)#163 |
| 4. | Delaware | 19.20% | 0.77%(+18.4)#4 | 1.01%(+18.2)#203 |
| 5. | Newfoundland | 14.97% | 0.77%(+14.2)#5 | 1.01%(+14.0)#306 |
| 6. | Brookfield | 13.70% | 0.77%(+12.9)#6 | 1.01%(+12.7)#347 |
| 7. | New Egypt | 11.34% | 0.77%(+10.6)#7 | 1.01%(+10.3)#475 |
| 8. | Tuckahoe | 9.80% | 0.77%(+9.03)#8 | 1.01%(+8.79)#582 |
| 9. | Port Colden | 9.33% | 0.77%(+8.56)#9 | 1.01%(+8.32)#641 |
| 10. | Midland Park Borough | 8.79% | 0.77%(+8.02)#10 | 1.01%(+7.77)#724 |
| 11. | Andover Borough | 8.57% | 0.77%(+7.80)#11 | 1.01%(+7.55)#757 |
| 12. | Vernon Valley | 7.93% | 0.77%(+7.16)#12 | 1.01%(+6.92)#844 |
| 13. | Clyde | 7.89% | 0.77%(+7.13)#13 | 1.01%(+6.88)#855 |
| 14. | Port Morris | 7.84% | 0.77%(+7.07)#14 | 1.01%(+6.82)#866 |
| 15. | Bloomsbury Borough | 7.67% | 0.77%(+6.90)#15 | 1.01%(+6.66)#893 |
| 16. | Peapack And Gladstone Borough | 7.22% | 0.77%(+6.45)#16 | 1.01%(+6.21)#986 |
| 17. | Cape May Point Borough | 7.10% | 0.77%(+6.33)#17 | 1.01%(+6.08)#1,012 |
| 18. | Sussex Borough | 6.83% | 0.77%(+6.06)#18 | 1.01%(+5.82)#1,049 |
| 19. | Riverdale Borough | 6.81% | 0.77%(+6.04)#19 | 1.01%(+5.80)#1,053 |
| 20. | Prospect Park Borough | 6.05% | 0.77%(+5.28)#20 | 1.01%(+5.03)#1,264 |
| 21. | Brass Castle | 5.85% | 0.77%(+5.08)#21 | 1.01%(+4.83)#1,338 |
| 22. | Columbia | 5.74% | 0.77%(+4.97)#22 | 1.01%(+4.73)#1,366 |
| 23. | Ringwood Borough | 5.68% | 0.77%(+4.91)#23 | 1.01%(+4.67)#1,389 |
| 24. | Titusville | 5.51% | 0.77%(+4.74)#24 | 1.01%(+4.50)#1,439 |
| 25. | Roadstown | 5.49% | 0.77%(+4.72)#25 | 1.01%(+4.47)#1,448 |
| 26. | Hope | 5.48% | 0.77%(+4.71)#26 | 1.01%(+4.47)#1,455 |
| 27. | Belle Mead | 5.47% | 0.77%(+4.70)#27 | 1.01%(+4.46)#1,458 |
| 28. | West Berlin | 5.02% | 0.77%(+4.25)#28 | 1.01%(+4.01)#1,674 |
| 29. | Cologne | 4.92% | 0.77%(+4.15)#29 | 1.01%(+3.91)#1,733 |
| 30. | Kinnelon Borough | 4.77% | 0.77%(+4.00)#30 | 1.01%(+3.75)#1,815 |
| 31. | Lake Hiawatha | 4.76% | 0.77%(+3.99)#31 | 1.01%(+3.75)#1,830 |
| 32. | Hampton Borough | 4.70% | 0.77%(+3.93)#32 | 1.01%(+3.69)#1,869 |
| 33. | Vernon Center | 4.29% | 0.77%(+3.52)#33 | 1.01%(+3.27)#2,136 |
| 34. | Pines Lake | 4.25% | 0.77%(+3.48)#34 | 1.01%(+3.24)#2,159 |
| 35. | Mount Tabor | 4.21% | 0.77%(+3.44)#35 | 1.01%(+3.20)#2,185 |
| 36. | Palermo | 4.14% | 0.77%(+3.37)#36 | 1.01%(+3.12)#2,242 |
| 37. | Stone Harbor Borough | 4.06% | 0.77%(+3.29)#37 | 1.01%(+3.04)#2,295 |
| 38. | Stockton Borough | 4.00% | 0.77%(+3.23)#38 | 1.01%(+2.99)#2,333 |
| 39. | Harmony | 3.95% | 0.77%(+3.18)#39 | 1.01%(+2.94)#2,376 |
| 40. | Totowa Borough | 3.88% | 0.77%(+3.11)#40 | 1.01%(+2.87)#2,426 |
| 41. | Upper Greenwood Lake | 3.80% | 0.77%(+3.03)#41 | 1.01%(+2.79)#2,494 |
| 42. | Holiday City South | 3.79% | 0.77%(+3.02)#42 | 1.01%(+2.77)#2,517 |
| 43. | North Wildwood | 3.76% | 0.77%(+3.00)#43 | 1.01%(+2.75)#2,544 |
| 44. | Clementon Borough | 3.63% | 0.77%(+2.86)#44 | 1.01%(+2.62)#2,677 |
| 45. | Milford Borough | 3.62% | 0.77%(+2.85)#45 | 1.01%(+2.60)#2,690 |
| 46. | Oakland Borough | 3.61% | 0.77%(+2.84)#46 | 1.01%(+2.60)#2,696 |
| 47. | Ogdensburg Borough | 3.61% | 0.77%(+2.84)#47 | 1.01%(+2.60)#2,698 |
| 48. | Cliffwood Beach | 3.59% | 0.77%(+2.82)#48 | 1.01%(+2.58)#2,711 |
| 49. | Phillipsburg | 3.58% | 0.77%(+2.81)#49 | 1.01%(+2.57)#2,720 |
| 50. | North Haledon Borough | 3.55% | 0.77%(+2.78)#50 | 1.01%(+2.53)#2,765 |
| 51. | Lyons | 3.51% | 0.77%(+2.74)#51 | 1.01%(+2.50)#2,794 |
| 52. | Stirling | 3.51% | 0.77%(+2.74)#52 | 1.01%(+2.49)#2,803 |
| 53. | Bloomingdale Borough | 3.48% | 0.77%(+2.71)#53 | 1.01%(+2.47)#2,832 |
| 54. | Asbury | 3.45% | 0.77%(+2.68)#54 | 1.01%(+2.43)#2,866 |
| 55. | Corbin City | 3.44% | 0.77%(+2.67)#55 | 1.01%(+2.43)#2,876 |
| 56. | Waldwick Borough | 3.42% | 0.77%(+2.65)#56 | 1.01%(+2.40)#2,907 |
| 57. | Oldwick | 3.29% | 0.77%(+2.52)#57 | 1.01%(+2.28)#3,053 |
| 58. | Hawthorne Borough | 3.28% | 0.77%(+2.51)#58 | 1.01%(+2.27)#3,064 |
| 59. | Pompton Lakes Borough | 3.19% | 0.77%(+2.42)#59 | 1.01%(+2.18)#3,193 |
| 60. | Alpha Borough | 3.10% | 0.77%(+2.33)#60 | 1.01%(+2.09)#3,314 |
| 61. | Erma | 3.09% | 0.77%(+2.32)#61 | 1.01%(+2.08)#3,332 |
| 62. | Belvidere | 3.08% | 0.77%(+2.31)#62 | 1.01%(+2.07)#3,347 |
| 63. | Panther Valley | 3.07% | 0.77%(+2.30)#63 | 1.01%(+2.05)#3,362 |
| 64. | Skillman | 3.03% | 0.77%(+2.26)#64 | 1.01%(+2.02)#3,408 |
| 65. | Packanack Lake | 3.01% | 0.77%(+2.24)#65 | 1.01%(+2.00)#3,444 |
| 66. | Johnsonburg | 2.98% | 0.77%(+2.21)#66 | 1.01%(+1.96)#3,491 |
| 67. | Arrowhead Lake | 2.91% | 0.77%(+2.14)#67 | 1.01%(+1.90)#3,578 |
| 68. | Encore At Monroe | 2.91% | 0.77%(+2.14)#68 | 1.01%(+1.90)#3,586 |
| 69. | Oxford | 2.88% | 0.77%(+2.11)#69 | 1.01%(+1.87)#3,635 |
| 70. | Belleplain | 2.81% | 0.77%(+2.04)#70 | 1.01%(+1.79)#3,759 |
| 71. | Paulsboro Borough | 2.79% | 0.77%(+2.02)#71 | 1.01%(+1.78)#3,791 |
| 72. | Cookstown | 2.79% | 0.77%(+2.02)#72 | 1.01%(+1.78)#3,792 |
| 73. | Sea Bright Borough | 2.76% | 0.77%(+1.99)#73 | 1.01%(+1.75)#3,849 |
| 74. | Barnegat Light Borough | 2.76% | 0.77%(+1.99)#74 | 1.01%(+1.74)#3,857 |
| 75. | Newton | 2.75% | 0.77%(+1.98)#75 | 1.01%(+1.73)#3,877 |
| 76. | Lincoln Park Borough | 2.67% | 0.77%(+1.90)#76 | 1.01%(+1.66)#4,007 |
| 77. | Newport | 2.65% | 0.77%(+1.88)#77 | 1.01%(+1.63)#4,062 |
| 78. | Highland Lakes | 2.64% | 0.77%(+1.87)#78 | 1.01%(+1.63)#4,071 |
| 79. | Ramsey Borough | 2.64% | 0.77%(+1.87)#79 | 1.01%(+1.63)#4,075 |
| 80. | Holiday City Berkeley | 2.63% | 0.77%(+1.86)#80 | 1.01%(+1.62)#4,082 |
| 81. | Watchung Borough | 2.62% | 0.77%(+1.85)#81 | 1.01%(+1.60)#4,108 |
| 82. | Franklin Borough | 2.59% | 0.77%(+1.83)#82 | 1.01%(+1.58)#4,158 |
| 83. | Holiday Heights | 2.59% | 0.77%(+1.82)#83 | 1.01%(+1.57)#4,176 |
| 84. | Fanwood Borough | 2.58% | 0.77%(+1.81)#84 | 1.01%(+1.56)#4,198 |
| 85. | Millstone Borough | 2.57% | 0.77%(+1.80)#85 | 1.01%(+1.55)#4,210 |
| 86. | Dennisville | 2.55% | 0.77%(+1.78)#86 | 1.01%(+1.53)#4,254 |
| 87. | New Village | 2.53% | 0.77%(+1.76)#87 | 1.01%(+1.52)#4,279 |
| 88. | Point Pleasant Beach Borough | 2.53% | 0.77%(+1.76)#88 | 1.01%(+1.51)#4,289 |
| 89. | Harvey Cedars Borough | 2.51% | 0.77%(+1.74)#89 | 1.01%(+1.49)#4,344 |
| 90. | Seaside Park Borough | 2.50% | 0.77%(+1.73)#90 | 1.01%(+1.49)#4,357 |
| 91. | Plainsboro Center | 2.49% | 0.77%(+1.72)#91 | 1.01%(+1.48)#4,381 |
| 92. | Pennington Borough | 2.48% | 0.77%(+1.71)#92 | 1.01%(+1.47)#4,410 |
| 93. | Wanamassa | 2.46% | 0.77%(+1.69)#93 | 1.01%(+1.45)#4,448 |
| 94. | Byram Center | 2.44% | 0.77%(+1.67)#94 | 1.01%(+1.42)#4,514 |
| 95. | Boonton | 2.43% | 0.77%(+1.66)#95 | 1.01%(+1.41)#4,536 |
| 96. | Lebanon Borough | 2.41% | 0.77%(+1.64)#96 | 1.01%(+1.40)#4,564 |
| 97. | Oak Ridge | 2.41% | 0.77%(+1.64)#97 | 1.01%(+1.40)#4,574 |
| 98. | Layton | 2.40% | 0.77%(+1.64)#98 | 1.01%(+1.39)#4,588 |
| 99. | Woodstown Borough | 2.39% | 0.77%(+1.62)#99 | 1.01%(+1.38)#4,618 |
| 100. | Frenchtown Borough | 2.38% | 0.77%(+1.61)#100 | 1.01%(+1.37)#4,645 |
Common Questions
What are the Top 10 Cities with the Highest Percentage of Dutch Population in New Jersey?
Top 10 Cities with the Highest Percentage of Dutch Population in New Jersey are:
#1
24.27%
#2
19.20%
#3
13.70%
#4
11.34%
#5
9.33%
#6
7.93%
#7
7.89%
#8
5.85%
#9
5.74%
#10
5.48%
What city has the Highest Percentage of Dutch Population in New Jersey?
Buttzville has the Highest Percentage of Dutch Population in New Jersey with 24.27%.
What is the Percentage of Dutch Population in the State of New Jersey?
Percentage of Dutch Population in New Jersey is 0.77%.
What is the Percentage of Dutch Population in the United States?
Percentage of Dutch Population in the United States is 1.01%.