Cities with the Highest Percentage of European Population in New Jersey
RELATED REPORTS & OPTIONS
European
New Jersey
Compare Cities
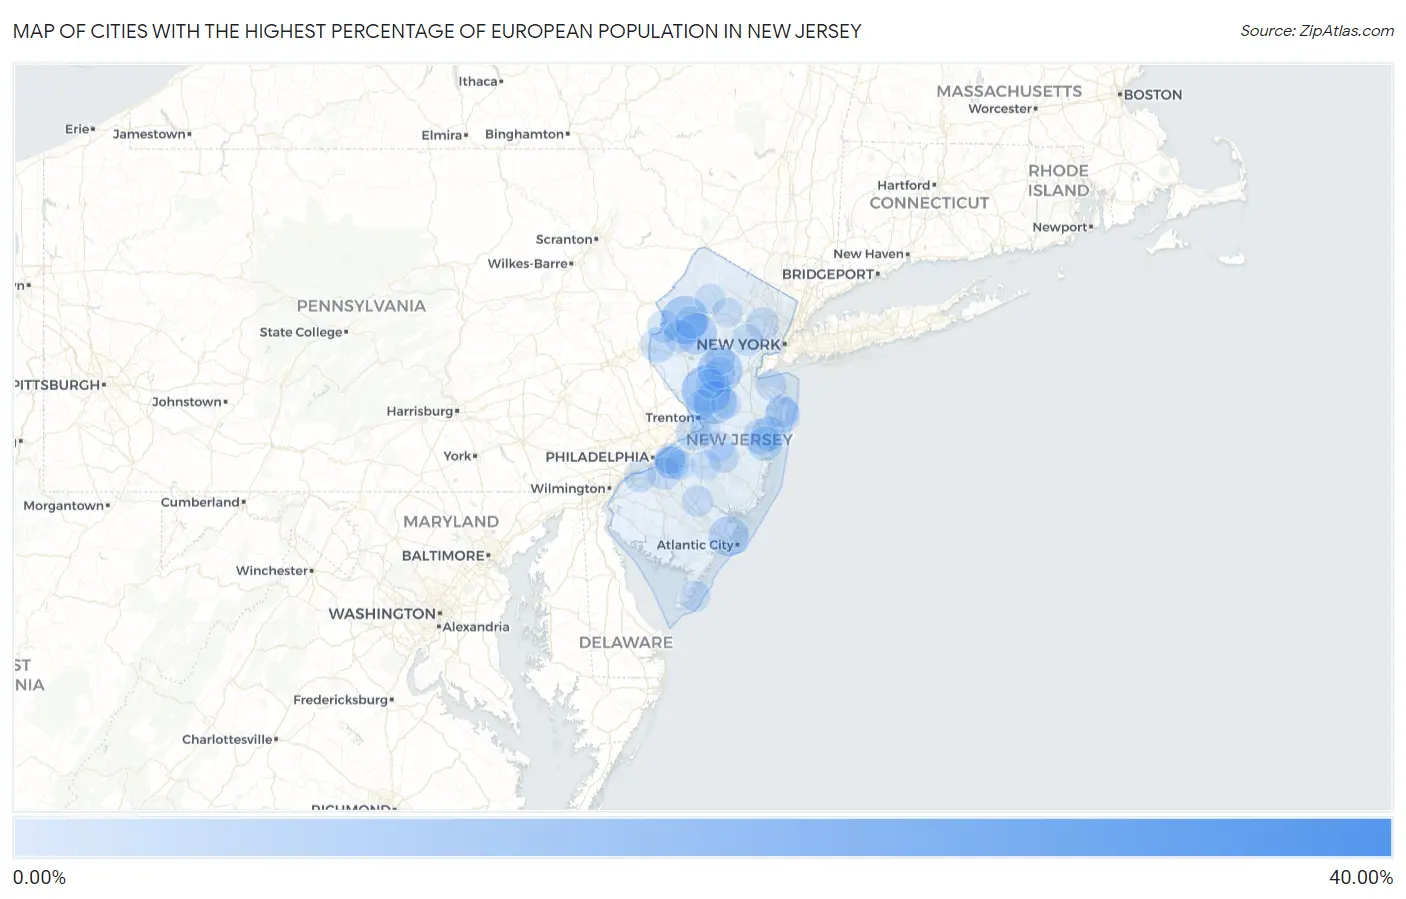
Map of Cities with the Highest Percentage of European Population in New Jersey
0.00%
40.00%
Cities with the Highest Percentage of European Population in New Jersey
| City | European | vs State | vs National | |
| 1. | Money Island | 40.00% | 0.85%(+39.2)#1 | 1.67%(+38.3)#51 |
| 2. | Leeds Point | 38.96% | 0.85%(+38.1)#2 | 1.67%(+37.3)#56 |
| 3. | Newfoundland | 22.13% | 0.85%(+21.3)#3 | 1.67%(+20.5)#148 |
| 4. | Pottersville | 16.75% | 0.85%(+15.9)#4 | 1.67%(+15.1)#246 |
| 5. | Silver Lake Cdp Warren County | 12.65% | 0.85%(+11.8)#5 | 1.67%(+11.0)#417 |
| 6. | Blawenburg | 11.61% | 0.85%(+10.8)#6 | 1.67%(+9.93)#491 |
| 7. | Vienna | 10.97% | 0.85%(+10.1)#7 | 1.67%(+9.29)#547 |
| 8. | Renaissance At Monroe | 10.13% | 0.85%(+9.28)#8 | 1.67%(+8.46)#641 |
| 9. | Sheppards Mill | 10.13% | 0.85%(+9.28)#9 | 1.67%(+8.45)#643 |
| 10. | Zarephath | 9.46% | 0.85%(+8.61)#10 | 1.67%(+7.79)#723 |
| 11. | Mantoloking Borough | 9.35% | 0.85%(+8.50)#11 | 1.67%(+7.68)#744 |
| 12. | Princeton Junction | 8.56% | 0.85%(+7.71)#12 | 1.67%(+6.88)#862 |
| 13. | Marmora | 8.50% | 0.85%(+7.65)#13 | 1.67%(+6.83)#875 |
| 14. | Auburn | 7.89% | 0.85%(+7.05)#14 | 1.67%(+6.22)#989 |
| 15. | Long Valley | 7.53% | 0.85%(+6.68)#15 | 1.67%(+5.85)#1,072 |
| 16. | Absecon | 7.08% | 0.85%(+6.23)#16 | 1.67%(+5.40)#1,186 |
| 17. | Bloomsbury Borough | 6.28% | 0.85%(+5.43)#17 | 1.67%(+4.60)#1,421 |
| 18. | Gibbsboro Borough | 5.66% | 0.85%(+4.81)#18 | 1.67%(+3.99)#1,686 |
| 19. | Lebanon Borough | 5.63% | 0.85%(+4.78)#19 | 1.67%(+3.96)#1,703 |
| 20. | Oceanville | 5.45% | 0.85%(+4.60)#20 | 1.67%(+3.77)#1,801 |
| 21. | Riverton Borough | 5.25% | 0.85%(+4.40)#21 | 1.67%(+3.57)#1,929 |
| 22. | Manasquan Borough | 5.17% | 0.85%(+4.32)#22 | 1.67%(+3.49)#1,974 |
| 23. | Bargaintown | 5.16% | 0.85%(+4.31)#23 | 1.67%(+3.48)#1,981 |
| 24. | Dennisville | 5.10% | 0.85%(+4.25)#24 | 1.67%(+3.42)#2,021 |
| 25. | Stonebridge | 5.09% | 0.85%(+4.24)#25 | 1.67%(+3.42)#2,024 |
| 26. | Lakewood | 4.95% | 0.85%(+4.10)#26 | 1.67%(+3.27)#2,113 |
| 27. | Three Bridges | 4.75% | 0.85%(+3.90)#27 | 1.67%(+3.07)#2,240 |
| 28. | Florence | 4.74% | 0.85%(+3.89)#28 | 1.67%(+3.06)#2,247 |
| 29. | Wanamassa | 4.63% | 0.85%(+3.78)#29 | 1.67%(+2.95)#2,315 |
| 30. | Mendham Borough | 4.55% | 0.85%(+3.70)#30 | 1.67%(+2.87)#2,386 |
| 31. | Liberty Corner | 4.55% | 0.85%(+3.70)#31 | 1.67%(+2.87)#2,388 |
| 32. | Towaco | 4.54% | 0.85%(+3.69)#32 | 1.67%(+2.86)#2,405 |
| 33. | Upper Stewartsville | 4.36% | 0.85%(+3.51)#33 | 1.67%(+2.69)#2,577 |
| 34. | Ramtown | 4.26% | 0.85%(+3.41)#34 | 1.67%(+2.58)#2,669 |
| 35. | Leisure Village | 4.24% | 0.85%(+3.40)#35 | 1.67%(+2.57)#2,690 |
| 36. | Beach Haven Borough | 4.24% | 0.85%(+3.39)#36 | 1.67%(+2.57)#2,692 |
| 37. | South Seaville | 4.08% | 0.85%(+3.23)#37 | 1.67%(+2.40)#2,876 |
| 38. | Midland Park Borough | 4.02% | 0.85%(+3.17)#38 | 1.67%(+2.34)#2,940 |
| 39. | Pleasantdale | 3.90% | 0.85%(+3.05)#39 | 1.67%(+2.22)#3,085 |
| 40. | Hamburg Borough | 3.79% | 0.85%(+2.94)#40 | 1.67%(+2.11)#3,240 |
| 41. | Neshanic | 3.77% | 0.85%(+2.92)#41 | 1.67%(+2.10)#3,261 |
| 42. | Roadstown | 3.66% | 0.85%(+2.81)#42 | 1.67%(+1.98)#3,409 |
| 43. | Kingston Estates | 3.64% | 0.85%(+2.79)#43 | 1.67%(+1.97)#3,428 |
| 44. | Allenhurst Borough | 3.64% | 0.85%(+2.79)#44 | 1.67%(+1.97)#3,430 |
| 45. | Cedar Knolls | 3.56% | 0.85%(+2.71)#45 | 1.67%(+1.89)#3,535 |
| 46. | Rocky Hill Borough | 3.53% | 0.85%(+2.68)#46 | 1.67%(+1.85)#3,587 |
| 47. | New Gretna | 3.46% | 0.85%(+2.61)#47 | 1.67%(+1.79)#3,672 |
| 48. | Macopin | 3.39% | 0.85%(+2.54)#48 | 1.67%(+1.71)#3,779 |
| 49. | Upper Montclair | 3.36% | 0.85%(+2.51)#49 | 1.67%(+1.69)#3,820 |
| 50. | Belvidere | 3.32% | 0.85%(+2.47)#50 | 1.67%(+1.64)#3,891 |
| 51. | Anderson | 3.31% | 0.85%(+2.46)#51 | 1.67%(+1.64)#3,900 |
| 52. | Regency At Monroe | 3.27% | 0.85%(+2.42)#52 | 1.67%(+1.60)#3,970 |
| 53. | Glendora | 3.25% | 0.85%(+2.40)#53 | 1.67%(+1.57)#4,006 |
| 54. | Hackettstown | 3.24% | 0.85%(+2.39)#54 | 1.67%(+1.57)#4,012 |
| 55. | Wenonah Borough | 3.21% | 0.85%(+2.36)#55 | 1.67%(+1.53)#4,075 |
| 56. | Oakhurst | 3.20% | 0.85%(+2.35)#56 | 1.67%(+1.52)#4,100 |
| 57. | Short Hills | 2.96% | 0.85%(+2.11)#57 | 1.67%(+1.29)#4,541 |
| 58. | Shrewsbury Borough | 2.95% | 0.85%(+2.10)#58 | 1.67%(+1.27)#4,571 |
| 59. | Gibbstown | 2.91% | 0.85%(+2.06)#59 | 1.67%(+1.24)#4,657 |
| 60. | Layton | 2.91% | 0.85%(+2.06)#60 | 1.67%(+1.23)#4,667 |
| 61. | North Caldwell Borough | 2.90% | 0.85%(+2.05)#61 | 1.67%(+1.22)#4,685 |
| 62. | West Cape May Borough | 2.80% | 0.85%(+1.96)#62 | 1.67%(+1.13)#4,897 |
| 63. | Ellisburg | 2.76% | 0.85%(+1.91)#63 | 1.67%(+1.08)#5,000 |
| 64. | English Creek | 2.71% | 0.85%(+1.86)#64 | 1.67%(+1.03)#5,121 |
| 65. | Weston | 2.71% | 0.85%(+1.86)#65 | 1.67%(+1.03)#5,125 |
| 66. | Watchung Borough | 2.59% | 0.85%(+1.74)#66 | 1.67%(+0.913)#5,426 |
| 67. | Ramsey Borough | 2.57% | 0.85%(+1.72)#67 | 1.67%(+0.897)#5,466 |
| 68. | Encore At Monroe | 2.55% | 0.85%(+1.70)#68 | 1.67%(+0.871)#5,540 |
| 69. | North Wildwood | 2.42% | 0.85%(+1.57)#69 | 1.67%(+0.744)#5,909 |
| 70. | Mcguire Afb | 2.42% | 0.85%(+1.57)#70 | 1.67%(+0.741)#5,923 |
| 71. | Hammonton | 2.41% | 0.85%(+1.56)#71 | 1.67%(+0.735)#5,943 |
| 72. | Ringwood Borough | 2.40% | 0.85%(+1.55)#72 | 1.67%(+0.729)#5,968 |
| 73. | Milmay | 2.40% | 0.85%(+1.55)#73 | 1.67%(+0.725)#5,984 |
| 74. | Kinnelon Borough | 2.37% | 0.85%(+1.52)#74 | 1.67%(+0.699)#6,061 |
| 75. | Cherry Hill Mall | 2.36% | 0.85%(+1.51)#75 | 1.67%(+0.682)#6,111 |
| 76. | Hampton Borough | 2.35% | 0.85%(+1.50)#76 | 1.67%(+0.675)#6,134 |
| 77. | North Middletown | 2.28% | 0.85%(+1.43)#77 | 1.67%(+0.606)#6,362 |
| 78. | Mountain Lakes Borough | 2.27% | 0.85%(+1.42)#78 | 1.67%(+0.593)#6,419 |
| 79. | Franklin Lakes Borough | 2.26% | 0.85%(+1.41)#79 | 1.67%(+0.588)#6,432 |
| 80. | Pemberton Borough | 2.24% | 0.85%(+1.39)#80 | 1.67%(+0.568)#6,499 |
| 81. | Country Lake Estates | 2.23% | 0.85%(+1.38)#81 | 1.67%(+0.551)#6,542 |
| 82. | Haddonfield Borough | 2.21% | 0.85%(+1.36)#82 | 1.67%(+0.533)#6,607 |
| 83. | Chester Borough | 2.16% | 0.85%(+1.31)#83 | 1.67%(+0.488)#6,755 |
| 84. | Pennington Borough | 2.16% | 0.85%(+1.31)#84 | 1.67%(+0.484)#6,771 |
| 85. | Oradell Borough | 2.14% | 0.85%(+1.30)#85 | 1.67%(+0.470)#6,831 |
| 86. | Lawrenceville | 2.13% | 0.85%(+1.28)#86 | 1.67%(+0.454)#6,894 |
| 87. | Lake Mohawk | 2.12% | 0.85%(+1.27)#87 | 1.67%(+0.449)#6,920 |
| 88. | Martinsville | 2.09% | 0.85%(+1.24)#88 | 1.67%(+0.411)#7,051 |
| 89. | Bordentown | 2.06% | 0.85%(+1.21)#89 | 1.67%(+0.381)#7,158 |
| 90. | Leisuretowne | 2.02% | 0.85%(+1.18)#90 | 1.67%(+0.350)#7,266 |
| 91. | White Meadow Lake | 2.00% | 0.85%(+1.15)#91 | 1.67%(+0.321)#7,380 |
| 92. | Essex Fells Borough | 1.97% | 0.85%(+1.12)#92 | 1.67%(+0.291)#7,489 |
| 93. | Marlton | 1.96% | 0.85%(+1.11)#93 | 1.67%(+0.287)#7,509 |
| 94. | Woodstown Borough | 1.93% | 0.85%(+1.08)#94 | 1.67%(+0.255)#7,624 |
| 95. | Avalon Borough | 1.92% | 0.85%(+1.07)#95 | 1.67%(+0.245)#7,664 |
| 96. | Haworth Borough | 1.92% | 0.85%(+1.07)#96 | 1.67%(+0.241)#7,680 |
| 97. | Cranbury | 1.89% | 0.85%(+1.04)#97 | 1.67%(+0.219)#7,768 |
| 98. | Harlingen | 1.86% | 0.85%(+1.02)#98 | 1.67%(+0.191)#7,883 |
| 99. | Avon By The Sea Borough | 1.84% | 0.85%(+0.992)#99 | 1.67%(+0.167)#7,987 |
| 100. | Seaside Heights Borough | 1.83% | 0.85%(+0.976)#100 | 1.67%(+0.151)#8,063 |
Common Questions
What are the Top 10 Cities with the Highest Percentage of European Population in New Jersey?
Top 10 Cities with the Highest Percentage of European Population in New Jersey are:
#1
11.61%
#2
10.97%
#3
9.46%
#4
8.56%
#5
7.53%
#6
7.08%
#7
4.95%
#8
4.74%
#9
4.63%
#10
4.36%
What city has the Highest Percentage of European Population in New Jersey?
Blawenburg has the Highest Percentage of European Population in New Jersey with 11.61%.
What is the Percentage of European Population in the State of New Jersey?
Percentage of European Population in New Jersey is 0.85%.
What is the Percentage of European Population in the United States?
Percentage of European Population in the United States is 1.67%.