Cities with the Largest African Community in New Jersey
RELATED REPORTS & OPTIONS
African
New Jersey
Compare Cities
Map of Cities with the Largest African Community in New Jersey
0
8,000
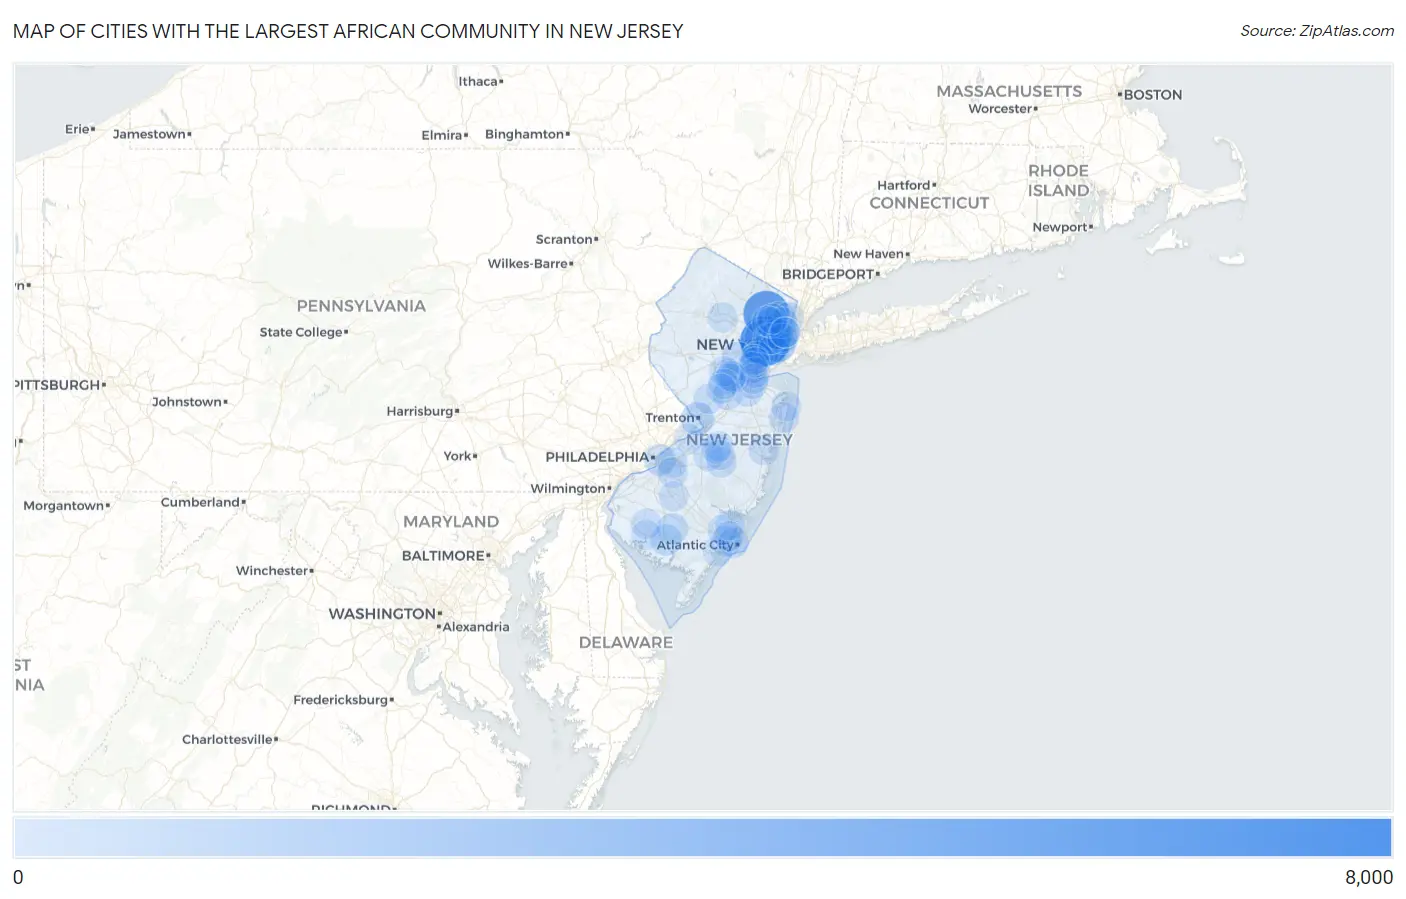
Cities with the Largest African Community in New Jersey
| City | African | vs State | vs National | |
| 1. | Newark | 6,833 | 50,507(13.53%)#1 | 1,871,898(0.37%)#23 |
| 2. | Paterson | 5,504 | 50,507(10.90%)#2 | 1,871,898(0.29%)#30 |
| 3. | Jersey City | 2,338 | 50,507(4.63%)#3 | 1,871,898(0.12%)#102 |
| 4. | Trenton | 1,093 | 50,507(2.16%)#4 | 1,871,898(0.06%)#229 |
| 5. | East Orange | 952 | 50,507(1.88%)#5 | 1,871,898(0.05%)#266 |
| 6. | Sayreville Borough | 764 | 50,507(1.51%)#6 | 1,871,898(0.04%)#339 |
| 7. | Sicklerville | 734 | 50,507(1.45%)#7 | 1,871,898(0.04%)#357 |
| 8. | North Plainfield Borough | 725 | 50,507(1.44%)#8 | 1,871,898(0.04%)#363 |
| 9. | Elizabeth | 609 | 50,507(1.21%)#9 | 1,871,898(0.03%)#449 |
| 10. | Plainfield | 587 | 50,507(1.16%)#10 | 1,871,898(0.03%)#471 |
| 11. | Linden | 575 | 50,507(1.14%)#11 | 1,871,898(0.03%)#482 |
| 12. | Camden | 566 | 50,507(1.12%)#12 | 1,871,898(0.03%)#492 |
| 13. | Union City | 548 | 50,507(1.08%)#13 | 1,871,898(0.03%)#509 |
| 14. | Hackensack | 525 | 50,507(1.04%)#14 | 1,871,898(0.03%)#534 |
| 15. | Roselle Borough | 502 | 50,507(0.99%)#15 | 1,871,898(0.03%)#558 |
| 16. | Millville | 482 | 50,507(0.95%)#16 | 1,871,898(0.03%)#585 |
| 17. | Vineland | 468 | 50,507(0.93%)#17 | 1,871,898(0.03%)#612 |
| 18. | Harrison | 363 | 50,507(0.72%)#18 | 1,871,898(0.02%)#783 |
| 19. | Bayonne | 356 | 50,507(0.70%)#19 | 1,871,898(0.02%)#794 |
| 20. | Englewood | 345 | 50,507(0.68%)#20 | 1,871,898(0.02%)#822 |
| 21. | Old Bridge | 310 | 50,507(0.61%)#21 | 1,871,898(0.02%)#878 |
| 22. | Kearny | 272 | 50,507(0.54%)#22 | 1,871,898(0.01%)#987 |
| 23. | Lindenwold Borough | 247 | 50,507(0.49%)#23 | 1,871,898(0.01%)#1,089 |
| 24. | Woodbridge | 236 | 50,507(0.47%)#24 | 1,871,898(0.01%)#1,133 |
| 25. | Cliffside Park Borough | 231 | 50,507(0.46%)#25 | 1,871,898(0.01%)#1,158 |
| 26. | Carteret Borough | 224 | 50,507(0.44%)#26 | 1,871,898(0.01%)#1,189 |
| 27. | Secaucus | 223 | 50,507(0.44%)#27 | 1,871,898(0.01%)#1,197 |
| 28. | Ridgefield Park | 223 | 50,507(0.44%)#28 | 1,871,898(0.01%)#1,199 |
| 29. | Dumont Borough | 214 | 50,507(0.42%)#29 | 1,871,898(0.01%)#1,231 |
| 30. | Pleasantville | 212 | 50,507(0.42%)#30 | 1,871,898(0.01%)#1,237 |
| 31. | Kingston Estates | 212 | 50,507(0.42%)#31 | 1,871,898(0.01%)#1,241 |
| 32. | Passaic | 210 | 50,507(0.42%)#32 | 1,871,898(0.01%)#1,252 |
| 33. | New Brunswick | 199 | 50,507(0.39%)#33 | 1,871,898(0.01%)#1,318 |
| 34. | Somerset | 196 | 50,507(0.39%)#34 | 1,871,898(0.01%)#1,338 |
| 35. | Florham Park Borough | 184 | 50,507(0.36%)#35 | 1,871,898(0.01%)#1,407 |
| 36. | Madison Park | 183 | 50,507(0.36%)#36 | 1,871,898(0.01%)#1,415 |
| 37. | Atlantic City | 180 | 50,507(0.36%)#37 | 1,871,898(0.01%)#1,439 |
| 38. | Bergenfield Borough | 172 | 50,507(0.34%)#38 | 1,871,898(0.01%)#1,476 |
| 39. | Asbury Park | 171 | 50,507(0.34%)#39 | 1,871,898(0.01%)#1,486 |
| 40. | Seabrook Farms | 169 | 50,507(0.33%)#40 | 1,871,898(0.01%)#1,496 |
| 41. | Echelon | 163 | 50,507(0.32%)#41 | 1,871,898(0.01%)#1,531 |
| 42. | Toms River | 156 | 50,507(0.31%)#42 | 1,871,898(0.01%)#1,572 |
| 43. | Presidential Lakes Estates | 153 | 50,507(0.30%)#43 | 1,871,898(0.01%)#1,597 |
| 44. | Berlin Borough | 146 | 50,507(0.29%)#44 | 1,871,898(0.01%)#1,640 |
| 45. | Bloomingdale Borough | 137 | 50,507(0.27%)#45 | 1,871,898(0.01%)#1,708 |
| 46. | Perth Amboy | 131 | 50,507(0.26%)#46 | 1,871,898(0.01%)#1,750 |
| 47. | Eatontown Borough | 128 | 50,507(0.25%)#47 | 1,871,898(0.01%)#1,790 |
| 48. | Rahway | 120 | 50,507(0.24%)#48 | 1,871,898(0.01%)#1,860 |
| 49. | Tenafly Borough | 114 | 50,507(0.23%)#49 | 1,871,898(0.01%)#1,931 |
| 50. | Voorhees | 114 | 50,507(0.23%)#50 | 1,871,898(0.01%)#1,932 |
| 51. | Princeton | 113 | 50,507(0.22%)#51 | 1,871,898(0.01%)#1,933 |
| 52. | Dayton | 110 | 50,507(0.22%)#52 | 1,871,898(0.01%)#1,963 |
| 53. | Clifton | 107 | 50,507(0.21%)#53 | 1,871,898(0.01%)#1,988 |
| 54. | Hoboken | 101 | 50,507(0.20%)#54 | 1,871,898(0.01%)#2,045 |
| 55. | Pemberton Heights | 98 | 50,507(0.19%)#55 | 1,871,898(0.01%)#2,098 |
| 56. | South Amboy | 96 | 50,507(0.19%)#56 | 1,871,898(0.01%)#2,121 |
| 57. | Ringwood Borough | 92 | 50,507(0.18%)#57 | 1,871,898(0.00%)#2,163 |
| 58. | Dover | 89 | 50,507(0.18%)#58 | 1,871,898(0.00%)#2,205 |
| 59. | Burlington | 87 | 50,507(0.17%)#59 | 1,871,898(0.00%)#2,246 |
| 60. | West New York | 86 | 50,507(0.17%)#60 | 1,871,898(0.00%)#2,253 |
| 61. | Atco | 84 | 50,507(0.17%)#61 | 1,871,898(0.00%)#2,298 |
| 62. | Mcguire Afb | 83 | 50,507(0.16%)#62 | 1,871,898(0.00%)#2,317 |
| 63. | Montvale Borough | 82 | 50,507(0.16%)#63 | 1,871,898(0.00%)#2,326 |
| 64. | Penns Grove Borough | 80 | 50,507(0.16%)#64 | 1,871,898(0.00%)#2,357 |
| 65. | Long Branch | 79 | 50,507(0.16%)#65 | 1,871,898(0.00%)#2,363 |
| 66. | Rutherford Borough | 79 | 50,507(0.16%)#66 | 1,871,898(0.00%)#2,367 |
| 67. | Somers Point | 76 | 50,507(0.15%)#67 | 1,871,898(0.00%)#2,425 |
| 68. | Lodi Borough | 73 | 50,507(0.14%)#68 | 1,871,898(0.00%)#2,487 |
| 69. | Raritan Borough | 72 | 50,507(0.14%)#69 | 1,871,898(0.00%)#2,519 |
| 70. | Lawnside Borough | 71 | 50,507(0.14%)#70 | 1,871,898(0.00%)#2,541 |
| 71. | Goshen | 68 | 50,507(0.13%)#71 | 1,871,898(0.00%)#2,605 |
| 72. | Browns Mills | 64 | 50,507(0.13%)#72 | 1,871,898(0.00%)#2,665 |
| 73. | Franklin Center | 64 | 50,507(0.13%)#73 | 1,871,898(0.00%)#2,669 |
| 74. | East Franklin | 62 | 50,507(0.12%)#74 | 1,871,898(0.00%)#2,712 |
| 75. | Fort Dix | 62 | 50,507(0.12%)#75 | 1,871,898(0.00%)#2,715 |
| 76. | Williamstown | 60 | 50,507(0.12%)#76 | 1,871,898(0.00%)#2,756 |
| 77. | Garfield | 59 | 50,507(0.12%)#77 | 1,871,898(0.00%)#2,775 |
| 78. | Pomona | 59 | 50,507(0.12%)#78 | 1,871,898(0.00%)#2,784 |
| 79. | South River Borough | 58 | 50,507(0.11%)#79 | 1,871,898(0.00%)#2,806 |
| 80. | Franklin Park | 58 | 50,507(0.11%)#80 | 1,871,898(0.00%)#2,807 |
| 81. | Smithville | 58 | 50,507(0.11%)#81 | 1,871,898(0.00%)#2,811 |
| 82. | Prospect Park Borough | 58 | 50,507(0.11%)#82 | 1,871,898(0.00%)#2,815 |
| 83. | Bridgeton | 57 | 50,507(0.11%)#83 | 1,871,898(0.00%)#2,829 |
| 84. | Avenel | 57 | 50,507(0.11%)#84 | 1,871,898(0.00%)#2,834 |
| 85. | Leonia Borough | 56 | 50,507(0.11%)#85 | 1,871,898(0.00%)#2,877 |
| 86. | Hopatcong Borough | 55 | 50,507(0.11%)#86 | 1,871,898(0.00%)#2,899 |
| 87. | Beachwood Borough | 54 | 50,507(0.11%)#87 | 1,871,898(0.00%)#2,925 |
| 88. | Absecon | 54 | 50,507(0.11%)#88 | 1,871,898(0.00%)#2,928 |
| 89. | Wallington Borough | 53 | 50,507(0.10%)#89 | 1,871,898(0.00%)#2,952 |
| 90. | Pine Hill Borough | 53 | 50,507(0.10%)#90 | 1,871,898(0.00%)#2,954 |
| 91. | Kendall Park | 53 | 50,507(0.10%)#91 | 1,871,898(0.00%)#2,955 |
| 92. | Keansburg Borough | 53 | 50,507(0.10%)#92 | 1,871,898(0.00%)#2,957 |
| 93. | South Bound Brook Borough | 52 | 50,507(0.10%)#93 | 1,871,898(0.00%)#2,992 |
| 94. | Vauxhall | 51 | 50,507(0.10%)#94 | 1,871,898(0.00%)#3,026 |
| 95. | Swedesboro Borough | 51 | 50,507(0.10%)#95 | 1,871,898(0.00%)#3,028 |
| 96. | Fort Lee Borough | 49 | 50,507(0.10%)#96 | 1,871,898(0.00%)#3,069 |
| 97. | Guttenberg | 48 | 50,507(0.10%)#97 | 1,871,898(0.00%)#3,118 |
| 98. | Franklin Borough | 48 | 50,507(0.10%)#98 | 1,871,898(0.00%)#3,129 |
| 99. | Wildwood Crest Borough | 48 | 50,507(0.10%)#99 | 1,871,898(0.00%)#3,131 |
| 100. | New Milford Borough | 47 | 50,507(0.09%)#100 | 1,871,898(0.00%)#3,146 |
Common Questions
What are the Top 10 Cities with the Largest African Community in New Jersey?
Top 10 Cities with the Largest African Community in New Jersey are:
#1
6,833
#2
5,504
#3
2,338
#4
1,093
#5
952
#6
609
#7
587
#8
575
#9
566
#10
548
What city has the Largest African Community in New Jersey?
Newark has the Largest African Community in New Jersey with 6,833.
What is the Total African Population in the State of New Jersey?
Total African Population in New Jersey is 50,507.
What is the Total African Population in the United States?
Total African Population in the United States is 1,871,898.