Hampton borough, NJ Map & Demographics
Hampton borough Overview
$50,459
PER CAPITA INCOME
$119,583
AVG FAMILY INCOME
$74,833
AVG HOUSEHOLD INCOME
44.8%
WAGE / INCOME GAP [ % ]
55.2¢/ $1
WAGE / INCOME GAP [ $ ]
0.51
INEQUALITY / GINI INDEX
1,064
TOTAL POPULATION
509
MALE POPULATION
555
FEMALE POPULATION
91.71
MALES / 100 FEMALES
109.04
FEMALES / 100 MALES
44.3
MEDIAN AGE
2.8
AVG FAMILY SIZE
2.2
AVG HOUSEHOLD SIZE
527
LABOR FORCE [ PEOPLE ]
59.6%
PERCENT IN LABOR FORCE
4.7%
UNEMPLOYMENT RATE
Income in Hampton borough
Income Overview in Hampton borough
Per Capita Income in Hampton borough is $50,459, while median incomes of families and households are $119,583 and $74,833 respectively.
| Characteristic | Number | Measure |
| Per Capita Income | 1,064 | $50,459 |
| Median Family Income | 313 | $119,583 |
| Mean Family Income | 313 | $147,586 |
| Median Household Income | 486 | $74,833 |
| Mean Household Income | 486 | $109,448 |
| Income Deficit | 313 | $0 |
| Wage / Income Gap (%) | 1,064 | 44.84% |
| Wage / Income Gap ($) | 1,064 | 55.16¢ per $1 |
| Gini / Inequality Index | 1,064 | 0.51 |
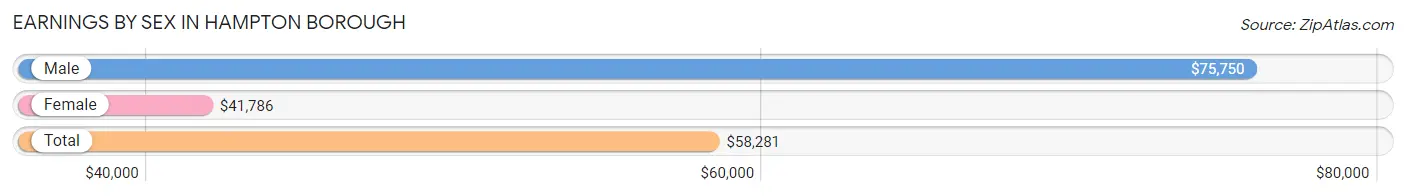
Earnings by Sex in Hampton borough
Average Earnings in Hampton borough are $58,281, $75,750 for men and $41,786 for women, a difference of 44.8%.
| Sex | Number | Average Earnings |
| Male | 308 (54.4%) | $75,750 |
| Female | 258 (45.6%) | $41,786 |
| Total | 566 (100.0%) | $58,281 |
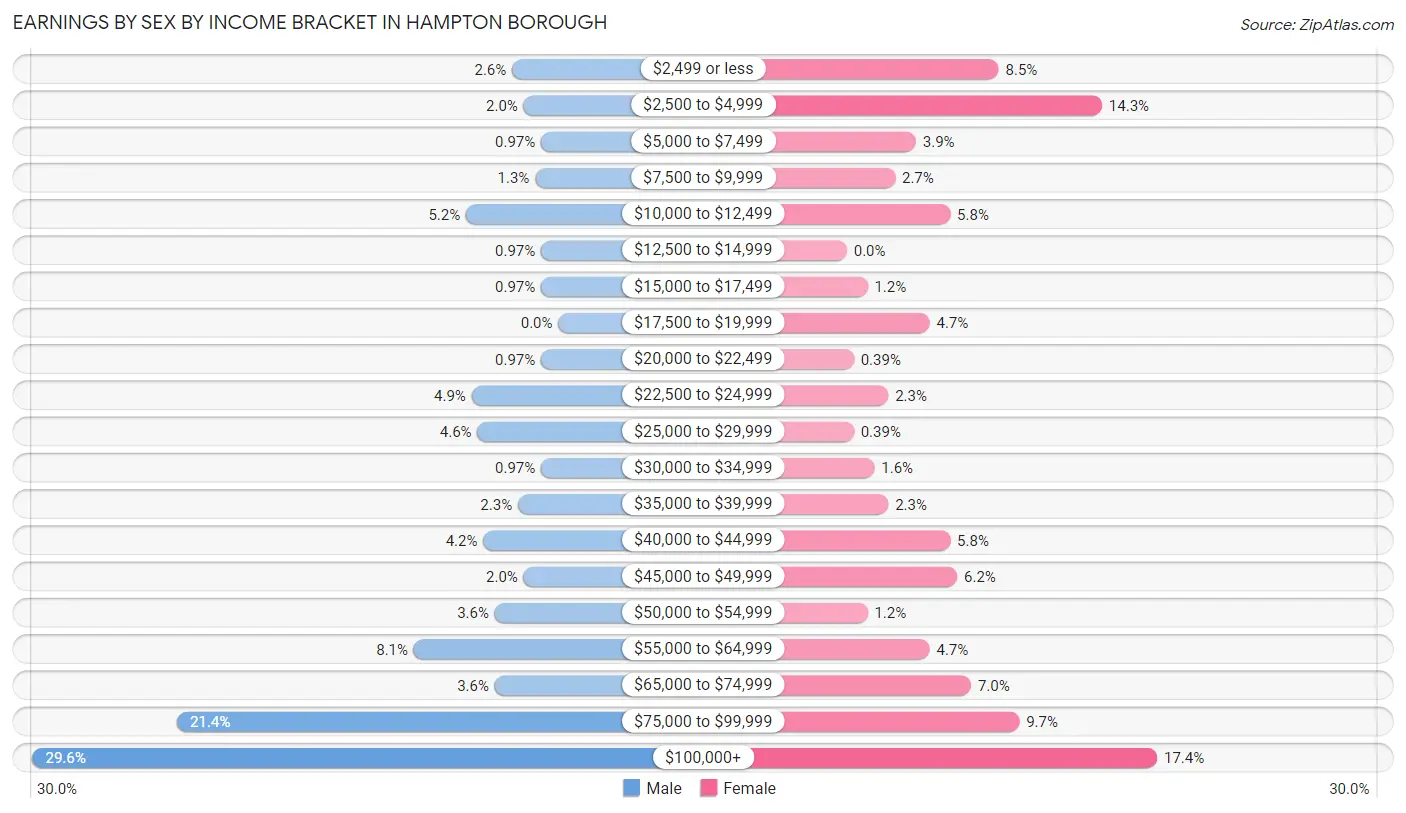
Earnings by Sex by Income Bracket in Hampton borough
The most common earnings brackets in Hampton borough are $100,000+ for men (91 | 29.5%) and $100,000+ for women (45 | 17.4%).
| Income | Male | Female |
| $2,499 or less | 8 (2.6%) | 22 (8.5%) |
| $2,500 to $4,999 | 6 (1.9%) | 37 (14.3%) |
| $5,000 to $7,499 | 3 (1.0%) | 10 (3.9%) |
| $7,500 to $9,999 | 4 (1.3%) | 7 (2.7%) |
| $10,000 to $12,499 | 16 (5.2%) | 15 (5.8%) |
| $12,500 to $14,999 | 3 (1.0%) | 0 (0.0%) |
| $15,000 to $17,499 | 3 (1.0%) | 3 (1.2%) |
| $17,500 to $19,999 | 0 (0.0%) | 12 (4.6%) |
| $20,000 to $22,499 | 3 (1.0%) | 1 (0.4%) |
| $22,500 to $24,999 | 15 (4.9%) | 6 (2.3%) |
| $25,000 to $29,999 | 14 (4.5%) | 1 (0.4%) |
| $30,000 to $34,999 | 3 (1.0%) | 4 (1.5%) |
| $35,000 to $39,999 | 7 (2.3%) | 6 (2.3%) |
| $40,000 to $44,999 | 13 (4.2%) | 15 (5.8%) |
| $45,000 to $49,999 | 6 (1.9%) | 16 (6.2%) |
| $50,000 to $54,999 | 11 (3.6%) | 3 (1.2%) |
| $55,000 to $64,999 | 25 (8.1%) | 12 (4.6%) |
| $65,000 to $74,999 | 11 (3.6%) | 18 (7.0%) |
| $75,000 to $99,999 | 66 (21.4%) | 25 (9.7%) |
| $100,000+ | 91 (29.5%) | 45 (17.4%) |
| Total | 308 (100.0%) | 258 (100.0%) |
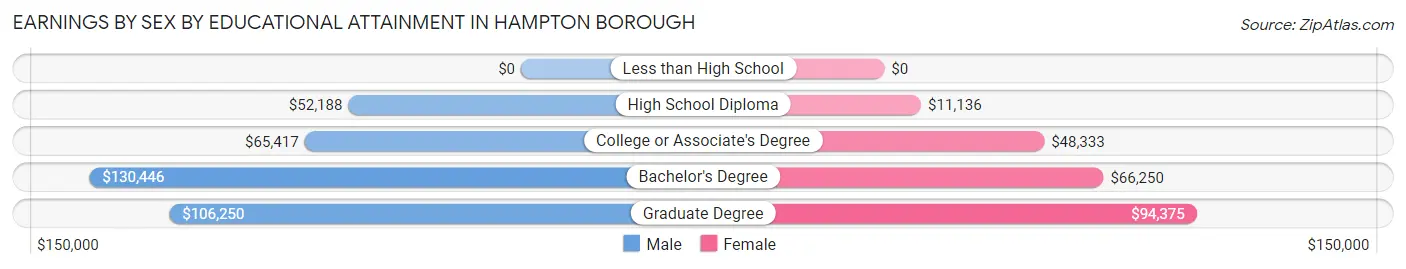
Earnings by Sex by Educational Attainment in Hampton borough
Average earnings in Hampton borough are $80,833 for men and $46,071 for women, a difference of 43.0%. Men with an educational attainment of bachelor's degree enjoy the highest average annual earnings of $130,446, while those with high school diploma education earn the least with $52,188. Women with an educational attainment of graduate degree earn the most with the average annual earnings of $94,375, while those with high school diploma education have the smallest earnings of $11,136.
| Educational Attainment | Male Income | Female Income |
| Less than High School | - | - |
| High School Diploma | $52,188 | $11,136 |
| College or Associate's Degree | $65,417 | $48,333 |
| Bachelor's Degree | $130,446 | $66,250 |
| Graduate Degree | $106,250 | $94,375 |
| Total | $80,833 | $46,071 |
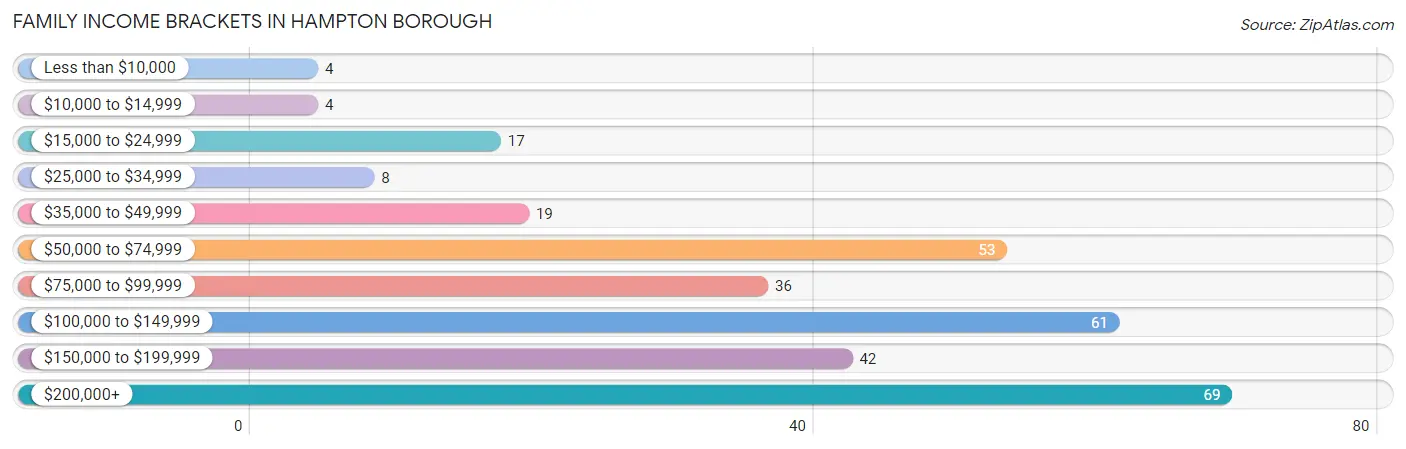
Family Income in Hampton borough
Family Income Brackets in Hampton borough
According to the Hampton borough family income data, there are 69 families falling into the $200,000+ income range, which is the most common income bracket and makes up 22.0% of all families. Conversely, the less than $10,000 income bracket is the least frequent group with only 4 families (1.3%) belonging to this category.
| Income Bracket | # Families | % Families |
| Less than $10,000 | 4 | 1.3% |
| $10,000 to $14,999 | 4 | 1.3% |
| $15,000 to $24,999 | 17 | 5.4% |
| $25,000 to $34,999 | 8 | 2.6% |
| $35,000 to $49,999 | 19 | 6.1% |
| $50,000 to $74,999 | 53 | 16.9% |
| $75,000 to $99,999 | 36 | 11.5% |
| $100,000 to $149,999 | 61 | 19.5% |
| $150,000 to $199,999 | 42 | 13.4% |
| $200,000+ | 69 | 22.0% |
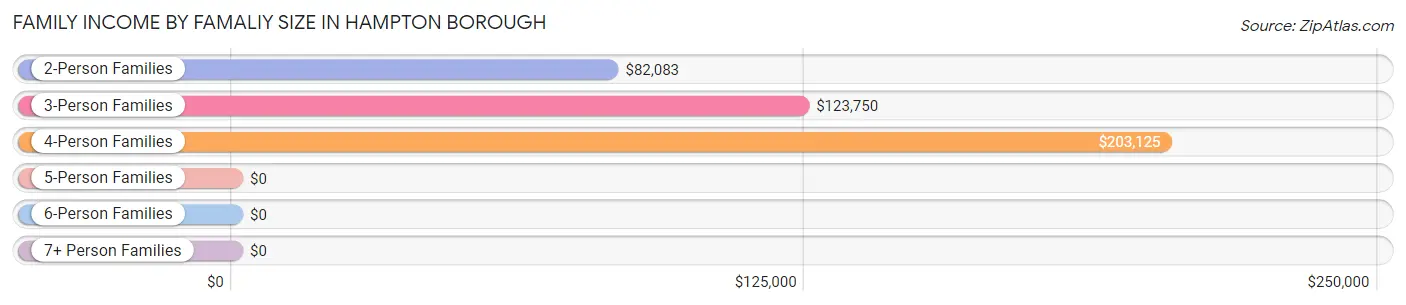
Family Income by Famaliy Size in Hampton borough
4-person families (43 | 13.7%) account for the highest median family income in Hampton borough with $203,125 per family, while 4-person families (43 | 13.7%) have the highest median income of $50,781 per family member.
| Income Bracket | # Families | Median Income |
| 2-Person Families | 140 (44.7%) | $82,083 |
| 3-Person Families | 108 (34.5%) | $123,750 |
| 4-Person Families | 43 (13.7%) | $203,125 |
| 5-Person Families | 18 (5.8%) | $0 |
| 6-Person Families | 1 (0.3%) | $0 |
| 7+ Person Families | 3 (1.0%) | $0 |
| Total | 313 (100.0%) | $119,583 |
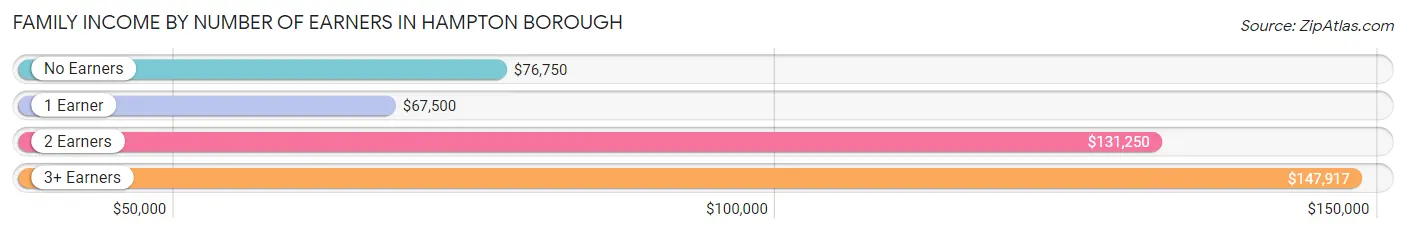
Family Income by Number of Earners in Hampton borough
The median family income in Hampton borough is $119,583, with families comprising 3+ earners (33) having the highest median family income of $147,917, while families with 1 earner (92) have the lowest median family income of $67,500, accounting for 10.5% and 29.4% of families, respectively.
| Number of Earners | # Families | Median Income |
| No Earners | 46 (14.7%) | $76,750 |
| 1 Earner | 92 (29.4%) | $67,500 |
| 2 Earners | 142 (45.4%) | $131,250 |
| 3+ Earners | 33 (10.5%) | $147,917 |
| Total | 313 (100.0%) | $119,583 |
Household Income in Hampton borough
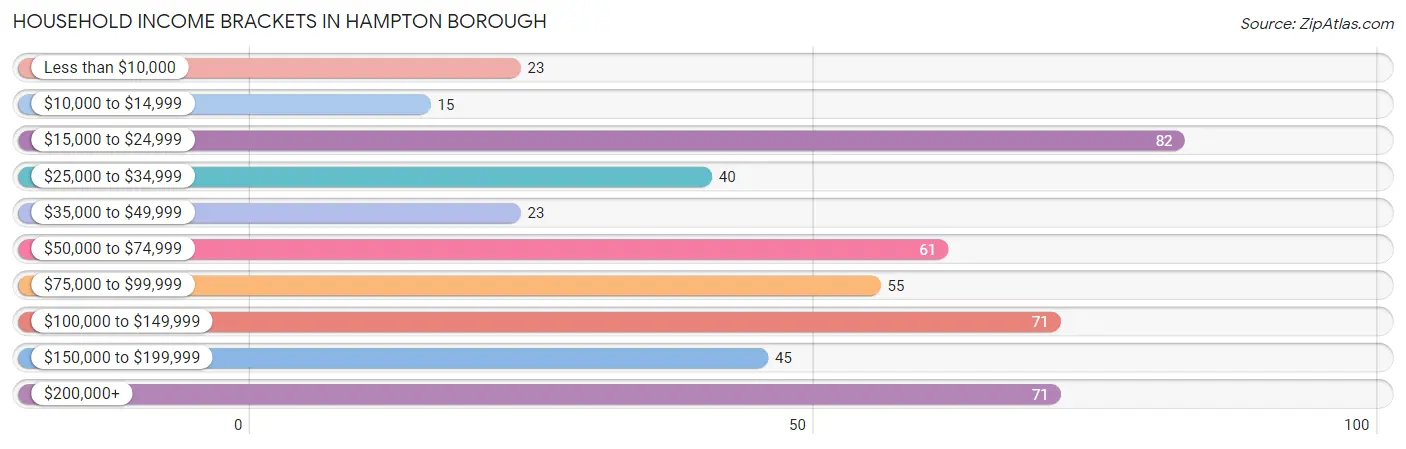
Household Income Brackets in Hampton borough
With 82 households falling in the category, the $15,000 to $24,999 income range is the most frequent in Hampton borough, accounting for 16.9% of all households. In contrast, only 15 households (3.1%) fall into the $10,000 to $14,999 income bracket, making it the least populous group.
| Income Bracket | # Households | % Households |
| Less than $10,000 | 23 | 4.7% |
| $10,000 to $14,999 | 15 | 3.1% |
| $15,000 to $24,999 | 82 | 16.9% |
| $25,000 to $34,999 | 40 | 8.2% |
| $35,000 to $49,999 | 23 | 4.7% |
| $50,000 to $74,999 | 61 | 12.6% |
| $75,000 to $99,999 | 55 | 11.3% |
| $100,000 to $149,999 | 71 | 14.6% |
| $150,000 to $199,999 | 45 | 9.3% |
| $200,000+ | 71 | 14.6% |
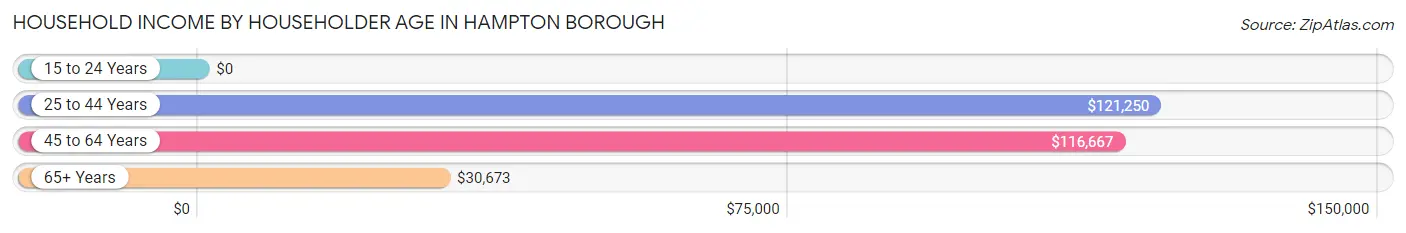
Household Income by Householder Age in Hampton borough
The median household income in Hampton borough is $74,833, with the highest median household income of $121,250 found in the 25 to 44 years age bracket for the primary householder. A total of 129 households (26.5%) fall into this category.
| Income Bracket | # Households | Median Income |
| 15 to 24 Years | 0 (0.0%) | $0 |
| 25 to 44 Years | 129 (26.5%) | $121,250 |
| 45 to 64 Years | 162 (33.3%) | $116,667 |
| 65+ Years | 195 (40.1%) | $30,673 |
| Total | 486 (100.0%) | $74,833 |
Poverty in Hampton borough
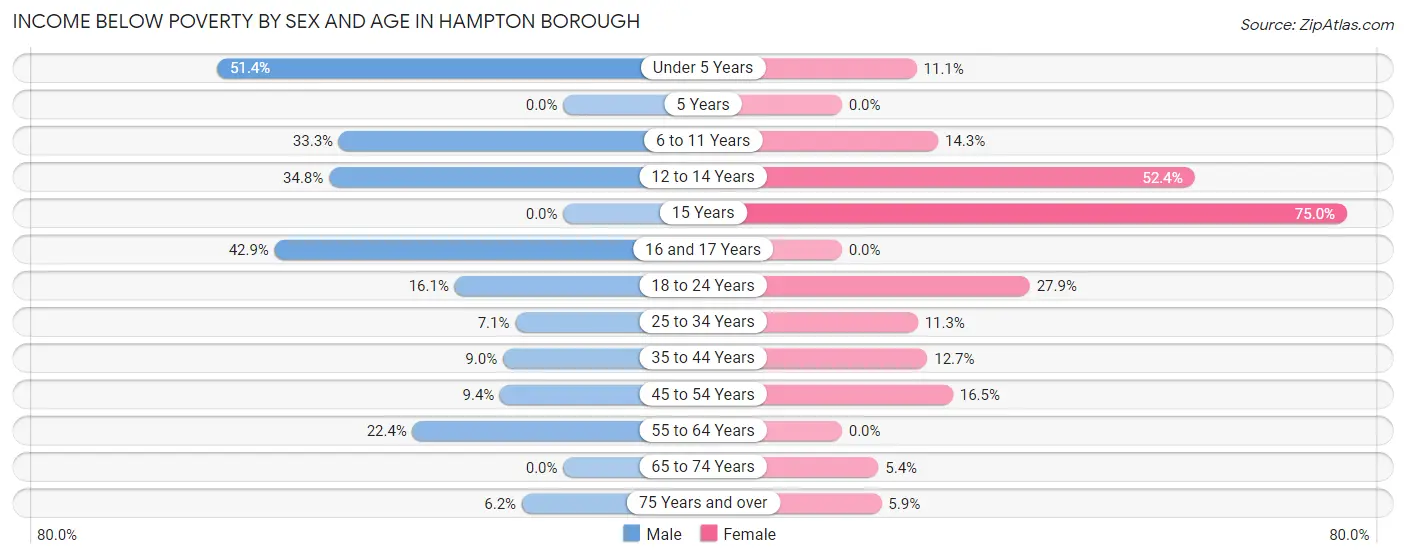
Income Below Poverty by Sex and Age in Hampton borough
With 15.7% poverty level for males and 13.2% for females among the residents of Hampton borough, under 5 year old males and 15 year old females are the most vulnerable to poverty, with 18 males (51.4%) and 3 females (75.0%) in their respective age groups living below the poverty level.
| Age Bracket | Male | Female |
| Under 5 Years | 18 (51.4%) | 5 (11.1%) |
| 5 Years | 0 (0.0%) | 0 (0.0%) |
| 6 to 11 Years | 8 (33.3%) | 3 (14.3%) |
| 12 to 14 Years | 8 (34.8%) | 11 (52.4%) |
| 15 Years | 0 (0.0%) | 3 (75.0%) |
| 16 and 17 Years | 3 (42.9%) | 0 (0.0%) |
| 18 to 24 Years | 5 (16.1%) | 12 (27.9%) |
| 25 to 34 Years | 5 (7.1%) | 8 (11.3%) |
| 35 to 44 Years | 6 (9.0%) | 8 (12.7%) |
| 45 to 54 Years | 6 (9.4%) | 15 (16.5%) |
| 55 to 64 Years | 17 (22.4%) | 0 (0.0%) |
| 65 to 74 Years | 0 (0.0%) | 5 (5.4%) |
| 75 Years and over | 4 (6.1%) | 3 (5.9%) |
| Total | 80 (15.7%) | 73 (13.2%) |
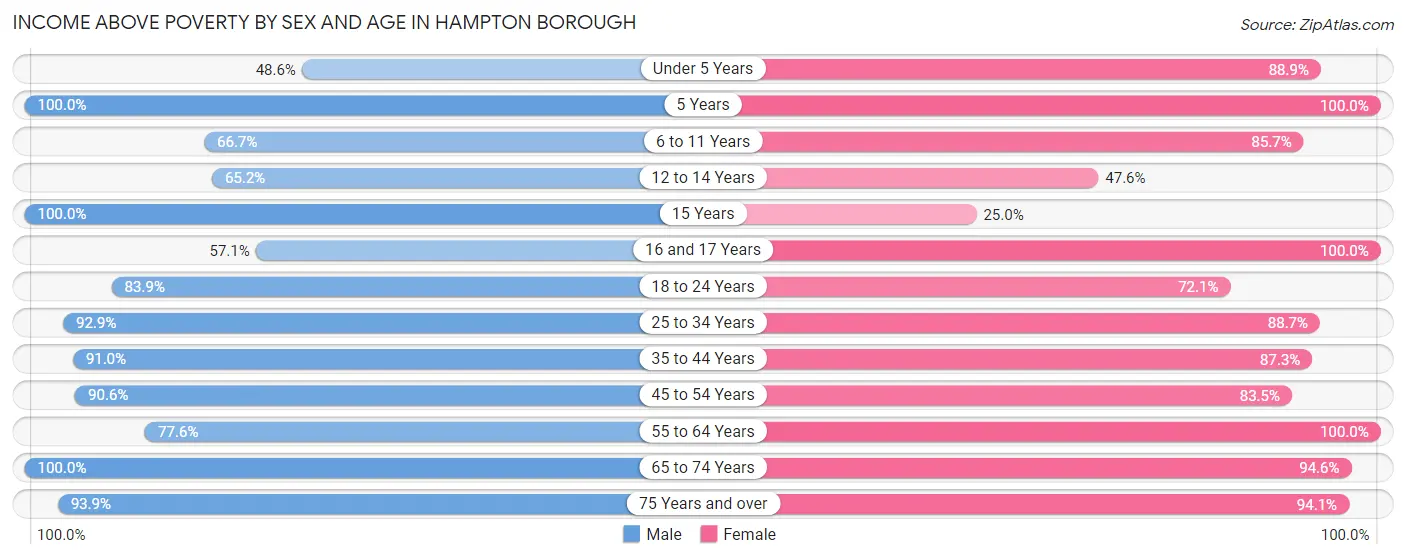
Income Above Poverty by Sex and Age in Hampton borough
According to the poverty statistics in Hampton borough, males aged 5 years and females aged 5 years are the age groups that are most secure financially, with 100.0% of males and 100.0% of females in these age groups living above the poverty line.
| Age Bracket | Male | Female |
| Under 5 Years | 17 (48.6%) | 40 (88.9%) |
| 5 Years | 2 (100.0%) | 4 (100.0%) |
| 6 to 11 Years | 16 (66.7%) | 18 (85.7%) |
| 12 to 14 Years | 15 (65.2%) | 10 (47.6%) |
| 15 Years | 1 (100.0%) | 1 (25.0%) |
| 16 and 17 Years | 4 (57.1%) | 8 (100.0%) |
| 18 to 24 Years | 26 (83.9%) | 31 (72.1%) |
| 25 to 34 Years | 65 (92.9%) | 63 (88.7%) |
| 35 to 44 Years | 61 (91.0%) | 55 (87.3%) |
| 45 to 54 Years | 58 (90.6%) | 76 (83.5%) |
| 55 to 64 Years | 59 (77.6%) | 41 (100.0%) |
| 65 to 74 Years | 44 (100.0%) | 87 (94.6%) |
| 75 Years and over | 61 (93.9%) | 48 (94.1%) |
| Total | 429 (84.3%) | 482 (86.9%) |
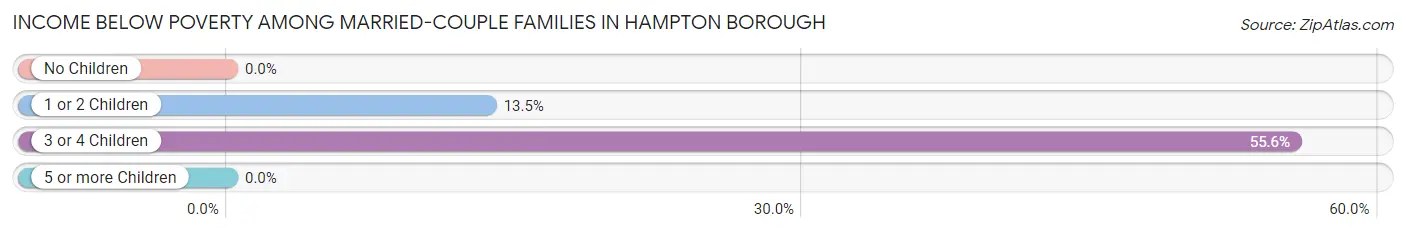
Income Below Poverty Among Married-Couple Families in Hampton borough
The poverty statistics for married-couple families in Hampton borough show that 7.7% or 20 of the total 259 families live below the poverty line. Families with 3 or 4 children have the highest poverty rate of 55.6%, comprising of 5 families. On the other hand, families with no children have the lowest poverty rate of 0.0%, which includes 0 families.
| Children | Above Poverty | Below Poverty |
| No Children | 139 (100.0%) | 0 (0.0%) |
| 1 or 2 Children | 96 (86.5%) | 15 (13.5%) |
| 3 or 4 Children | 4 (44.4%) | 5 (55.6%) |
| 5 or more Children | 0 (0.0%) | 0 (0.0%) |
| Total | 239 (92.3%) | 20 (7.7%) |
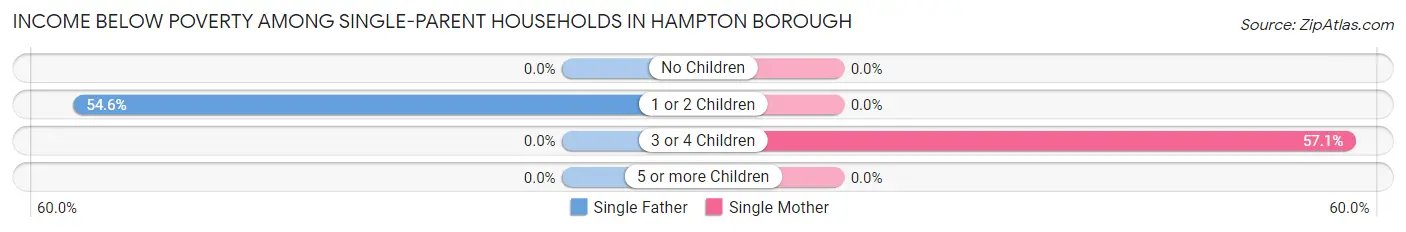
Income Below Poverty Among Single-Parent Households in Hampton borough
According to the poverty data in Hampton borough, 27.3% or 6 single-father households and 12.5% or 4 single-mother households are living below the poverty line. Among single-father households, those with 1 or 2 children have the highest poverty rate, with 6 households (54.5%) experiencing poverty. Likewise, among single-mother households, those with 3 or 4 children have the highest poverty rate, with 4 households (57.1%) falling below the poverty line.
| Children | Single Father | Single Mother |
| No Children | 0 (0.0%) | 0 (0.0%) |
| 1 or 2 Children | 6 (54.5%) | 0 (0.0%) |
| 3 or 4 Children | 0 (0.0%) | 4 (57.1%) |
| 5 or more Children | 0 (0.0%) | 0 (0.0%) |
| Total | 6 (27.3%) | 4 (12.5%) |
Income Below Poverty Among Married-Couple vs Single-Parent Households in Hampton borough
The poverty data for Hampton borough shows that 20 of the married-couple family households (7.7%) and 10 of the single-parent households (18.5%) are living below the poverty level. Within the married-couple family households, those with 3 or 4 children have the highest poverty rate, with 5 households (55.6%) falling below the poverty line. Among the single-parent households, those with 3 or 4 children have the highest poverty rate, with 4 household (57.1%) living below poverty.
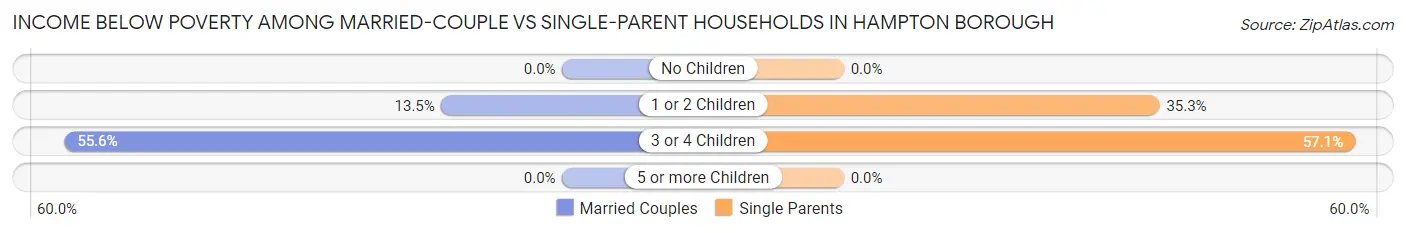
| Children | Married-Couple Families | Single-Parent Households |
| No Children | 0 (0.0%) | 0 (0.0%) |
| 1 or 2 Children | 15 (13.5%) | 6 (35.3%) |
| 3 or 4 Children | 5 (55.6%) | 4 (57.1%) |
| 5 or more Children | 0 (0.0%) | 0 (0.0%) |
| Total | 20 (7.7%) | 10 (18.5%) |
Race in Hampton borough
The most populous races in Hampton borough are White / Caucasian (962 | 90.4%), Hispanic or Latino (62 | 5.8%), and Asian (55 | 5.2%).
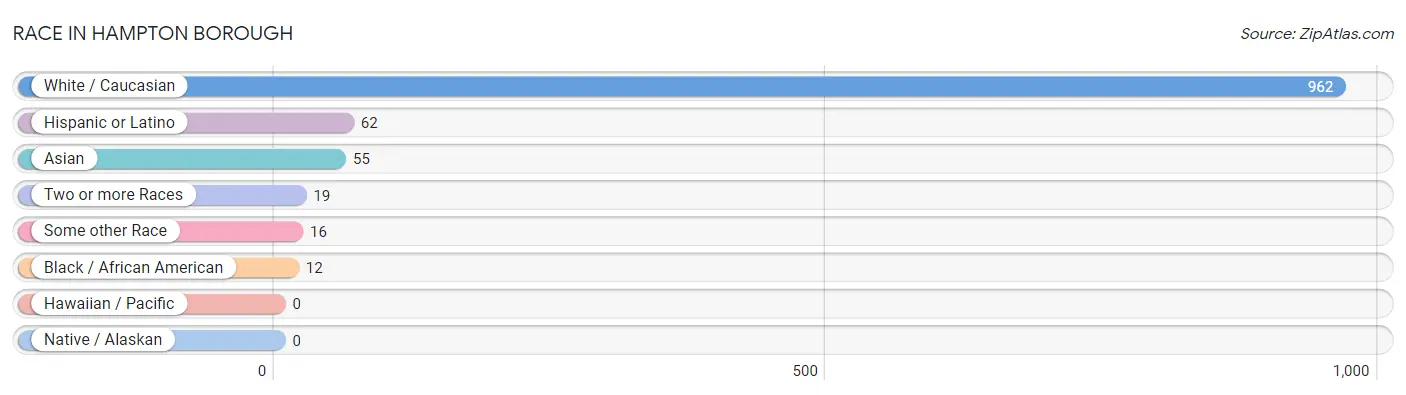
| Race | # Population | % Population |
| Asian | 55 | 5.2% |
| Black / African American | 12 | 1.1% |
| Hawaiian / Pacific | 0 | 0.0% |
| Hispanic or Latino | 62 | 5.8% |
| Native / Alaskan | 0 | 0.0% |
| White / Caucasian | 962 | 90.4% |
| Two or more Races | 19 | 1.8% |
| Some other Race | 16 | 1.5% |
| Total | 1,064 | 100.0% |
Ancestry in Hampton borough
The most populous ancestries reported in Hampton borough are German (249 | 23.4%), Irish (244 | 22.9%), Italian (174 | 16.4%), English (100 | 9.4%), and Polish (74 | 7.0%), together accounting for 79.0% of all Hampton borough residents.
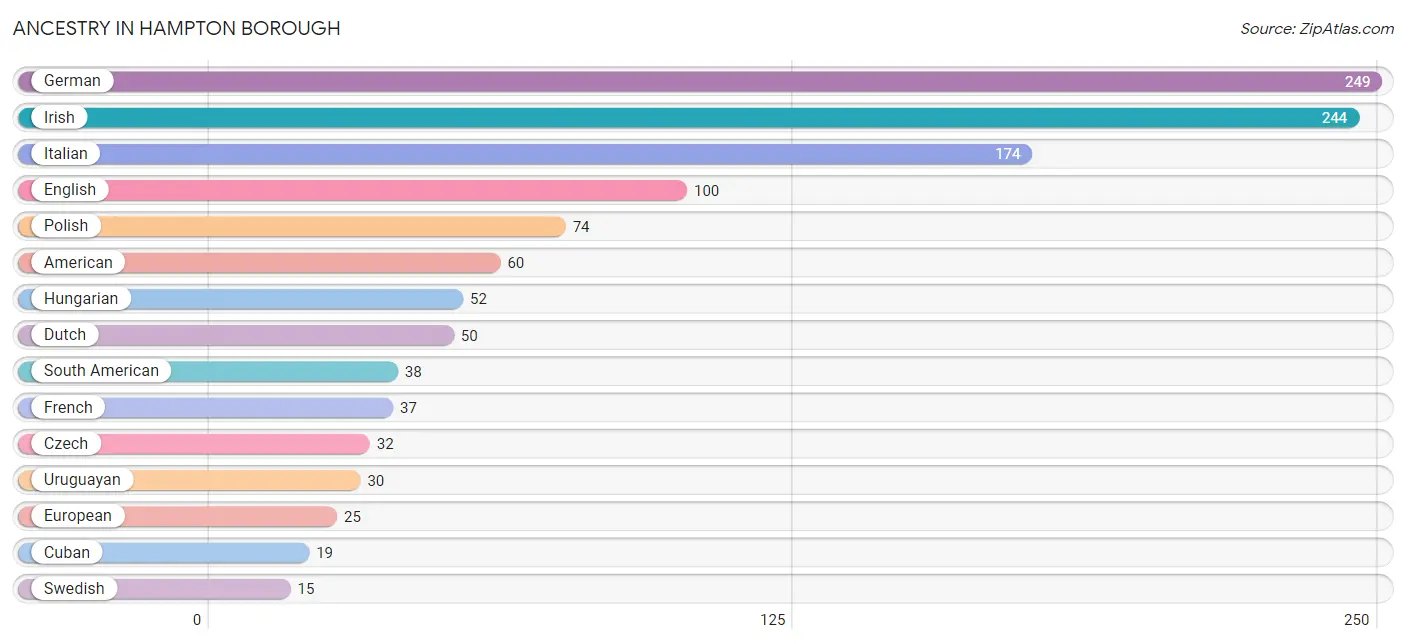
| Ancestry | # Population | % Population |
| American | 60 | 5.6% |
| Arab | 2 | 0.2% |
| Austrian | 2 | 0.2% |
| Bhutanese | 11 | 1.0% |
| Brazilian | 9 | 0.9% |
| British | 9 | 0.9% |
| Central American | 5 | 0.5% |
| Cherokee | 12 | 1.1% |
| Colombian | 8 | 0.7% |
| Cuban | 19 | 1.8% |
| Czech | 32 | 3.0% |
| Danish | 13 | 1.2% |
| Dutch | 50 | 4.7% |
| English | 100 | 9.4% |
| European | 25 | 2.4% |
| French | 37 | 3.5% |
| French Canadian | 6 | 0.6% |
| German | 249 | 23.4% |
| Greek | 3 | 0.3% |
| Guatemalan | 5 | 0.5% |
| Hungarian | 52 | 4.9% |
| Indian (Asian) | 4 | 0.4% |
| Irish | 244 | 22.9% |
| Italian | 174 | 16.4% |
| Korean | 4 | 0.4% |
| Latvian | 3 | 0.3% |
| Lithuanian | 4 | 0.4% |
| Northern European | 3 | 0.3% |
| Norwegian | 8 | 0.7% |
| Pennsylvania German | 8 | 0.7% |
| Polish | 74 | 7.0% |
| Portuguese | 2 | 0.2% |
| Romanian | 7 | 0.7% |
| Russian | 5 | 0.5% |
| Scandinavian | 12 | 1.1% |
| Scotch-Irish | 8 | 0.7% |
| Scottish | 10 | 0.9% |
| Slovak | 12 | 1.1% |
| South American | 38 | 3.6% |
| Swedish | 15 | 1.4% |
| Syrian | 2 | 0.2% |
| Thai | 9 | 0.9% |
| Turkish | 10 | 0.9% |
| Ukrainian | 3 | 0.3% |
| Uruguayan | 30 | 2.8% |
| West Indian | 9 | 0.9% | View All 46 Rows |
Immigrants in Hampton borough
The most numerous immigrant groups reported in Hampton borough came from Asia (47 | 4.4%), South Central Asia (37 | 3.5%), Latin America (30 | 2.8%), South America (30 | 2.8%), and Pakistan (28 | 2.6%), together accounting for 16.2% of all Hampton borough residents.
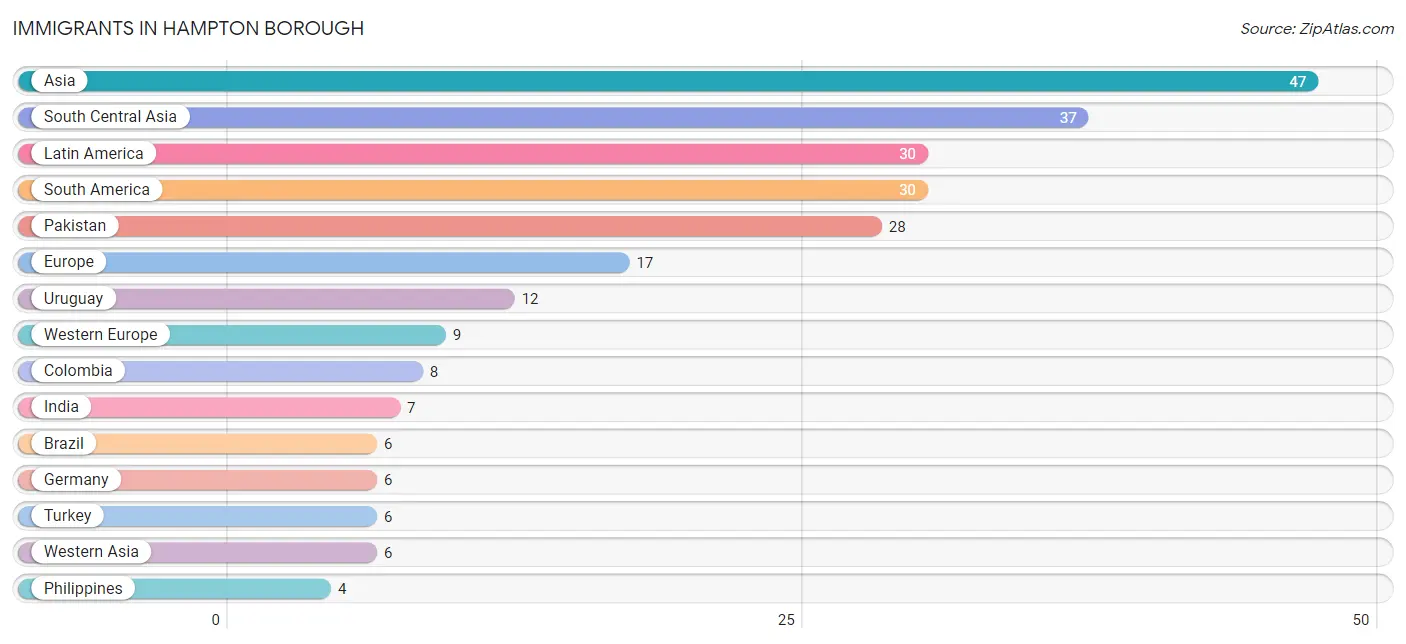
| Immigration Origin | # Population | % Population |
| Asia | 47 | 4.4% |
| Brazil | 6 | 0.6% |
| Colombia | 8 | 0.7% |
| Czechoslovakia | 3 | 0.3% |
| Eastern Europe | 3 | 0.3% |
| Europe | 17 | 1.6% |
| Germany | 6 | 0.6% |
| India | 7 | 0.7% |
| Latin America | 30 | 2.8% |
| Netherlands | 3 | 0.3% |
| Northern Europe | 3 | 0.3% |
| Pakistan | 28 | 2.6% |
| Philippines | 4 | 0.4% |
| Portugal | 2 | 0.2% |
| South America | 30 | 2.8% |
| South Central Asia | 37 | 3.5% |
| South Eastern Asia | 4 | 0.4% |
| Southern Europe | 2 | 0.2% |
| Sri Lanka | 2 | 0.2% |
| Turkey | 6 | 0.6% |
| Uruguay | 12 | 1.1% |
| Western Asia | 6 | 0.6% |
| Western Europe | 9 | 0.9% | View All 23 Rows |
Sex and Age in Hampton borough
Sex and Age in Hampton borough
The most populous age groups in Hampton borough are 30 to 34 Years (42 | 8.3%) for men and 65 to 69 Years (65 | 11.7%) for women.
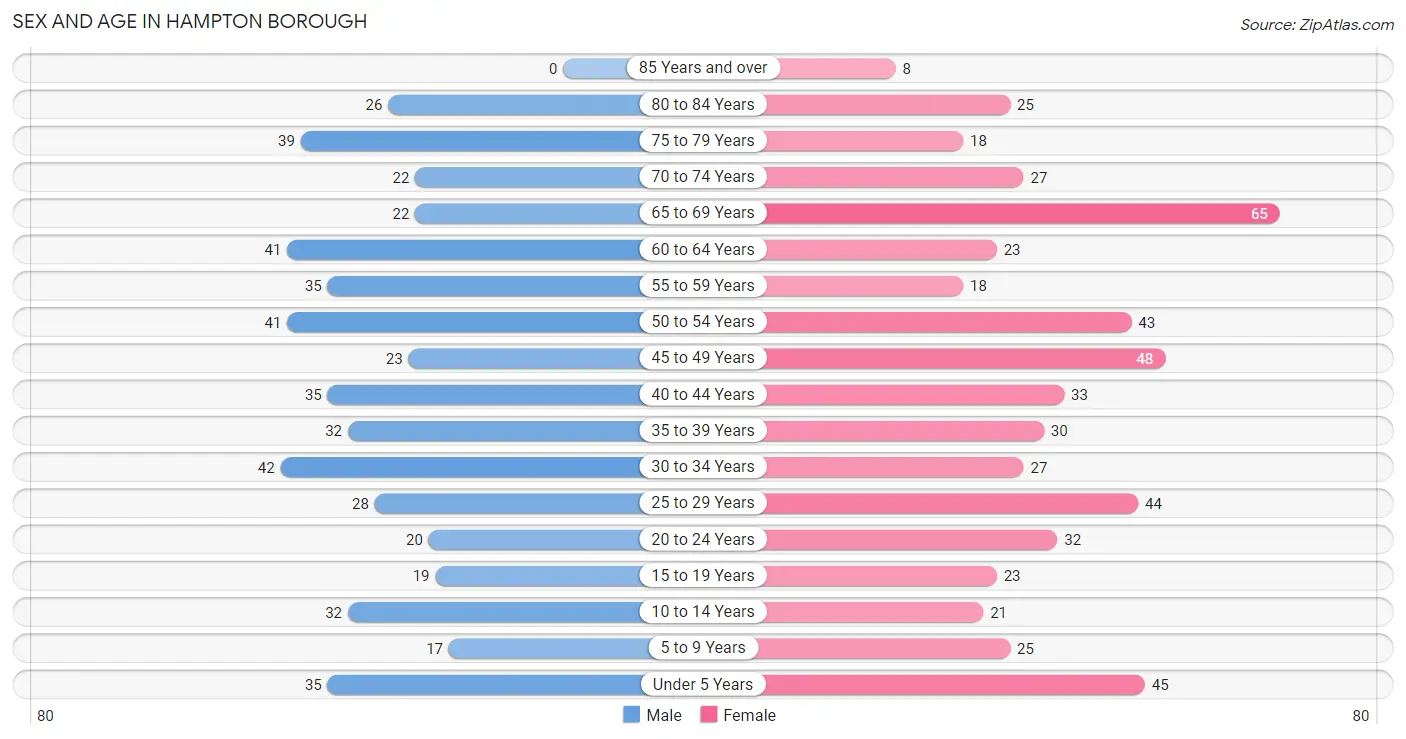
| Age Bracket | Male | Female |
| Under 5 Years | 35 (6.9%) | 45 (8.1%) |
| 5 to 9 Years | 17 (3.3%) | 25 (4.5%) |
| 10 to 14 Years | 32 (6.3%) | 21 (3.8%) |
| 15 to 19 Years | 19 (3.7%) | 23 (4.1%) |
| 20 to 24 Years | 20 (3.9%) | 32 (5.8%) |
| 25 to 29 Years | 28 (5.5%) | 44 (7.9%) |
| 30 to 34 Years | 42 (8.3%) | 27 (4.9%) |
| 35 to 39 Years | 32 (6.3%) | 30 (5.4%) |
| 40 to 44 Years | 35 (6.9%) | 33 (5.9%) |
| 45 to 49 Years | 23 (4.5%) | 48 (8.6%) |
| 50 to 54 Years | 41 (8.1%) | 43 (7.7%) |
| 55 to 59 Years | 35 (6.9%) | 18 (3.2%) |
| 60 to 64 Years | 41 (8.1%) | 23 (4.1%) |
| 65 to 69 Years | 22 (4.3%) | 65 (11.7%) |
| 70 to 74 Years | 22 (4.3%) | 27 (4.9%) |
| 75 to 79 Years | 39 (7.7%) | 18 (3.2%) |
| 80 to 84 Years | 26 (5.1%) | 25 (4.5%) |
| 85 Years and over | 0 (0.0%) | 8 (1.4%) |
| Total | 509 (100.0%) | 555 (100.0%) |
Families and Households in Hampton borough
Median Family Size in Hampton borough
The median family size in Hampton borough is 2.79 persons per family, with single female/mother families (32 | 10.2%) accounting for the largest median family size of 3.13 persons per family. On the other hand, single male/father families (22 | 7.0%) represent the smallest median family size with 2.45 persons per family.
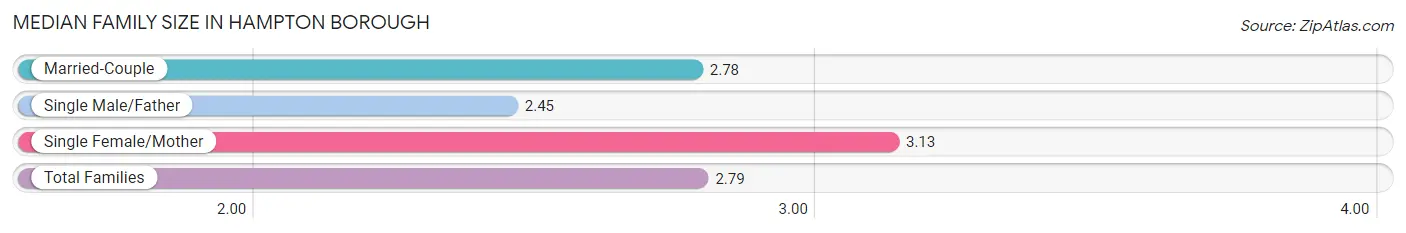
| Family Type | # Families | Family Size |
| Married-Couple | 259 (82.8%) | 2.78 |
| Single Male/Father | 22 (7.0%) | 2.45 |
| Single Female/Mother | 32 (10.2%) | 3.13 |
| Total Families | 313 (100.0%) | 2.79 |
Median Household Size in Hampton borough
The median household size in Hampton borough is 2.19 persons per household, with single female/mother households (32 | 6.6%) accounting for the largest median household size of 3.13 persons per household. non-family households (173 | 35.6%) represent the smallest median household size with 1.05 persons per household.
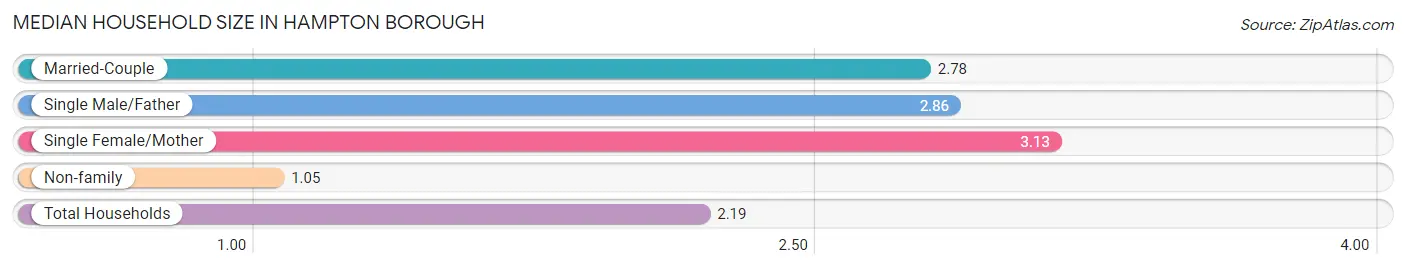
| Household Type | # Households | Household Size |
| Married-Couple | 259 (53.3%) | 2.78 |
| Single Male/Father | 22 (4.5%) | 2.86 |
| Single Female/Mother | 32 (6.6%) | 3.13 |
| Non-family | 173 (35.6%) | 1.05 |
| Total Households | 486 (100.0%) | 2.19 |
Household Size by Marriage Status in Hampton borough
Out of a total of 486 households in Hampton borough, 313 (64.4%) are family households, while 173 (35.6%) are nonfamily households. The most numerous type of family households are 2-person households, comprising 135, and the most common type of nonfamily households are 1-person households, comprising 167.
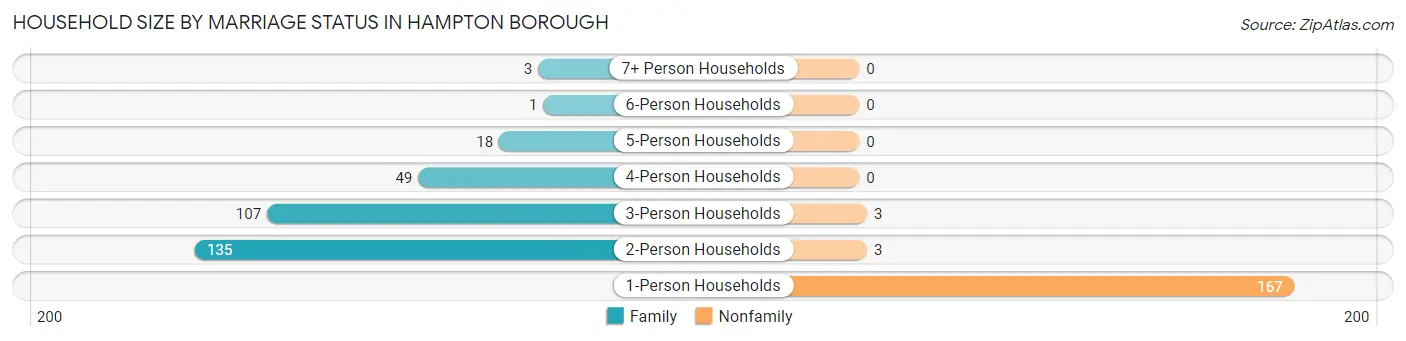
| Household Size | Family Households | Nonfamily Households |
| 1-Person Households | - | 167 (34.4%) |
| 2-Person Households | 135 (27.8%) | 3 (0.6%) |
| 3-Person Households | 107 (22.0%) | 3 (0.6%) |
| 4-Person Households | 49 (10.1%) | 0 (0.0%) |
| 5-Person Households | 18 (3.7%) | 0 (0.0%) |
| 6-Person Households | 1 (0.2%) | 0 (0.0%) |
| 7+ Person Households | 3 (0.6%) | 0 (0.0%) |
| Total | 313 (64.4%) | 173 (35.6%) |
Female Fertility in Hampton borough
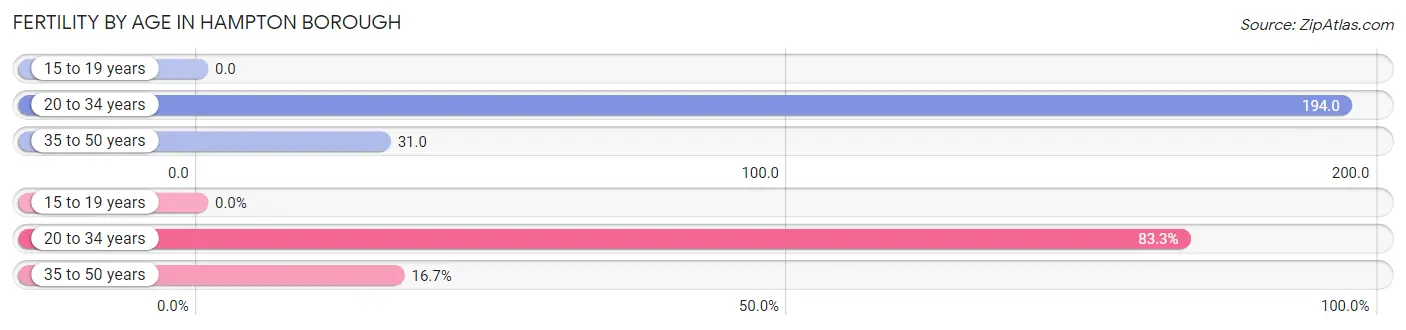
Fertility by Age in Hampton borough
Average fertility rate in Hampton borough is 94.0 births per 1,000 women. Women in the age bracket of 20 to 34 years have the highest fertility rate with 194.0 births per 1,000 women. Women in the age bracket of 20 to 34 years acount for 83.3% of all women with births.
| Age Bracket | Women with Births | Births / 1,000 Women |
| 15 to 19 years | 0 (0.0%) | 0.0 |
| 20 to 34 years | 20 (83.3%) | 194.0 |
| 35 to 50 years | 4 (16.7%) | 31.0 |
| Total | 24 (100.0%) | 94.0 |
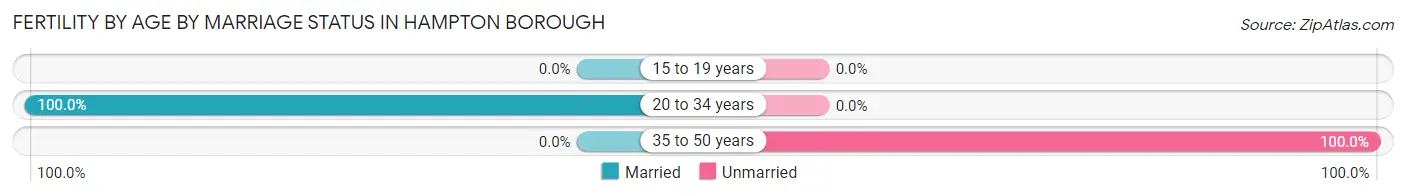
Fertility by Age by Marriage Status in Hampton borough
83.3% of women with births (24) in Hampton borough are married. The highest percentage of unmarried women with births falls into 35 to 50 years age bracket with 100.0% of them unmarried at the time of birth, while the lowest percentage of unmarried women with births belong to 20 to 34 years age bracket with 0.0% of them unmarried.
| Age Bracket | Married | Unmarried |
| 15 to 19 years | 0 (0.0%) | 0 (0.0%) |
| 20 to 34 years | 20 (100.0%) | 0 (0.0%) |
| 35 to 50 years | 0 (0.0%) | 4 (100.0%) |
| Total | 20 (83.3%) | 4 (16.7%) |
Fertility by Education in Hampton borough
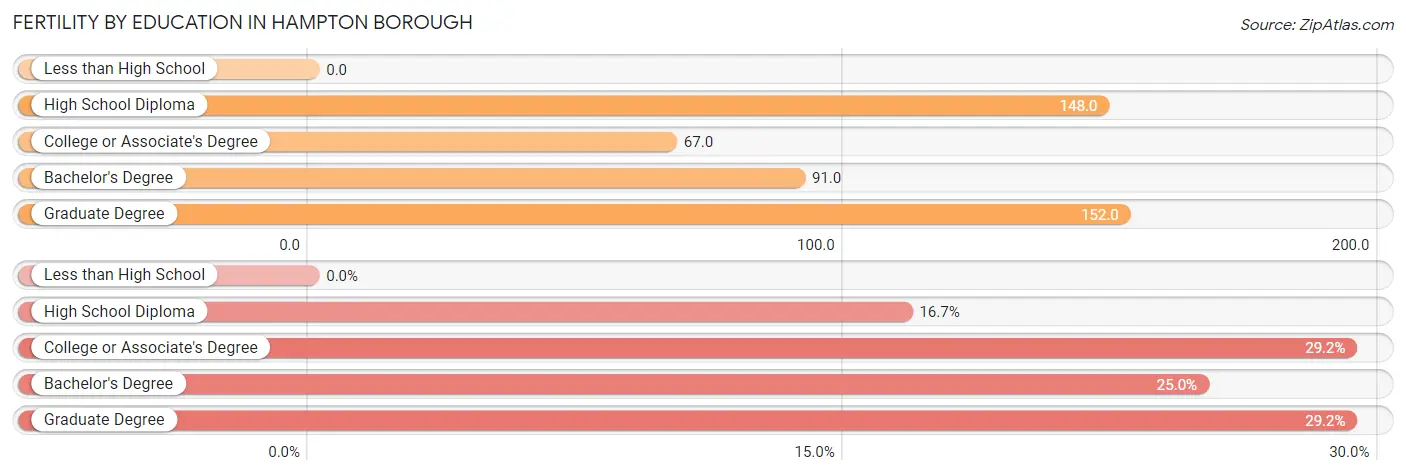
| Educational Attainment | Women with Births | Births / 1,000 Women |
| Less than High School | 0 (0.0%) | 0.0 |
| High School Diploma | 4 (16.7%) | 148.0 |
| College or Associate's Degree | 7 (29.2%) | 67.0 |
| Bachelor's Degree | 6 (25.0%) | 91.0 |
| Graduate Degree | 7 (29.2%) | 152.0 |
| Total | 24 (100.0%) | 94.0 |
Fertility by Education by Marriage Status in Hampton borough
16.7% of women with births in Hampton borough are unmarried. Women with the educational attainment of college or associate's degree are most likely to be married with 100.0% of them married at childbirth, while women with the educational attainment of high school diploma are least likely to be married with 100.0% of them unmarried at childbirth.
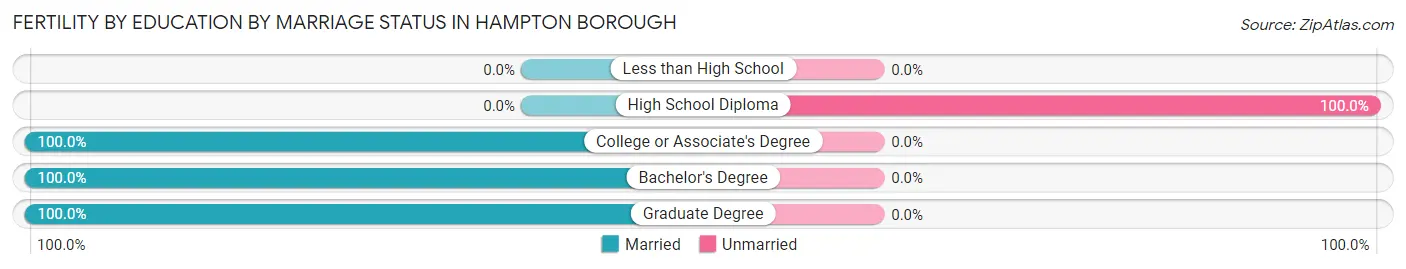
| Educational Attainment | Married | Unmarried |
| Less than High School | 0 (0.0%) | 0 (0.0%) |
| High School Diploma | 0 (0.0%) | 4 (100.0%) |
| College or Associate's Degree | 7 (100.0%) | 0 (0.0%) |
| Bachelor's Degree | 6 (100.0%) | 0 (0.0%) |
| Graduate Degree | 7 (100.0%) | 0 (0.0%) |
| Total | 20 (83.3%) | 4 (16.7%) |
Employment Characteristics in Hampton borough
Employment by Class of Employer in Hampton borough
Among the 490 employed individuals in Hampton borough, private company employees (311 | 63.5%), self-employed (not incorporated) (66 | 13.5%), and not-for-profit organizations (44 | 9.0%) make up the most common classes of employment.
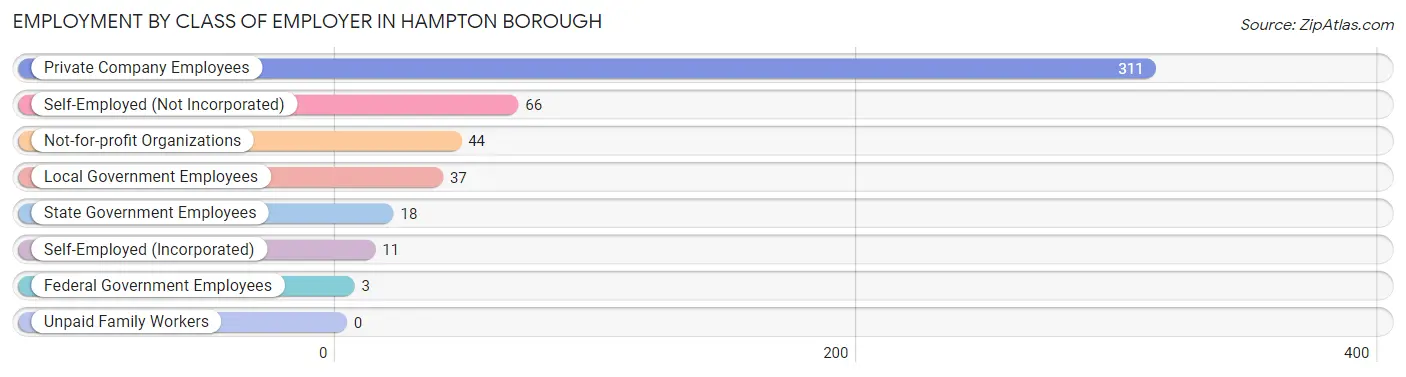
| Employer Class | # Employees | % Employees |
| Private Company Employees | 311 | 63.5% |
| Self-Employed (Incorporated) | 11 | 2.2% |
| Self-Employed (Not Incorporated) | 66 | 13.5% |
| Not-for-profit Organizations | 44 | 9.0% |
| Local Government Employees | 37 | 7.5% |
| State Government Employees | 18 | 3.7% |
| Federal Government Employees | 3 | 0.6% |
| Unpaid Family Workers | 0 | 0.0% |
| Total | 490 | 100.0% |
Employment Status by Age in Hampton borough
According to the labor force statistics for Hampton borough, out of the total population over 16 years of age (884), 59.6% or 527 individuals are in the labor force, with 4.7% or 25 of them unemployed. The age group with the highest labor force participation rate is 30 to 34 years, with 95.7% or 66 individuals in the labor force. Within the labor force, the 55 to 59 years age range has the highest percentage of unemployed individuals, with 24.2% or 8 of them being unemployed.
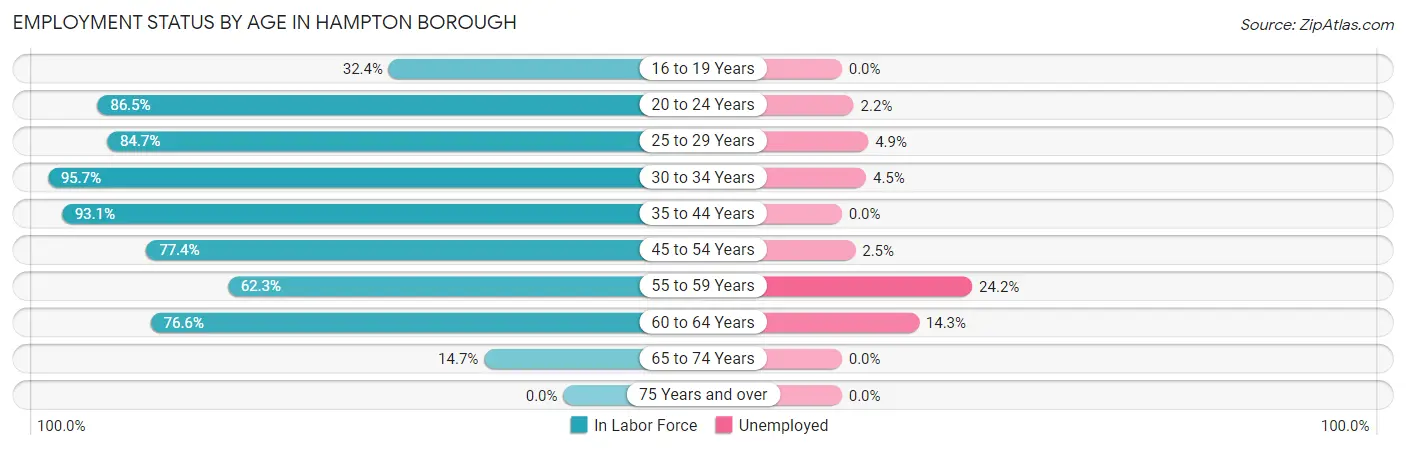
| Age Bracket | In Labor Force | Unemployed |
| 16 to 19 Years | 12 (32.4%) | 0 (0.0%) |
| 20 to 24 Years | 45 (86.5%) | 1 (2.2%) |
| 25 to 29 Years | 61 (84.7%) | 3 (4.9%) |
| 30 to 34 Years | 66 (95.7%) | 3 (4.5%) |
| 35 to 44 Years | 121 (93.1%) | 0 (0.0%) |
| 45 to 54 Years | 120 (77.4%) | 3 (2.5%) |
| 55 to 59 Years | 33 (62.3%) | 8 (24.2%) |
| 60 to 64 Years | 49 (76.6%) | 7 (14.3%) |
| 65 to 74 Years | 20 (14.7%) | 0 (0.0%) |
| 75 Years and over | 0 (0.0%) | 0 (0.0%) |
| Total | 527 (59.6%) | 25 (4.7%) |
Employment Status by Educational Attainment in Hampton borough
According to labor force statistics for Hampton borough, 82.9% of individuals (450) out of the total population between 25 and 64 years of age (543) are in the labor force, with 5.3% or 24 of them being unemployed. The group with the highest labor force participation rate are those with the educational attainment of less than high school, with 100.0% or 26 individuals in the labor force. Within the labor force, individuals with less than high school education have the highest percentage of unemployment, with 30.8% or 8 of them being unemployed.
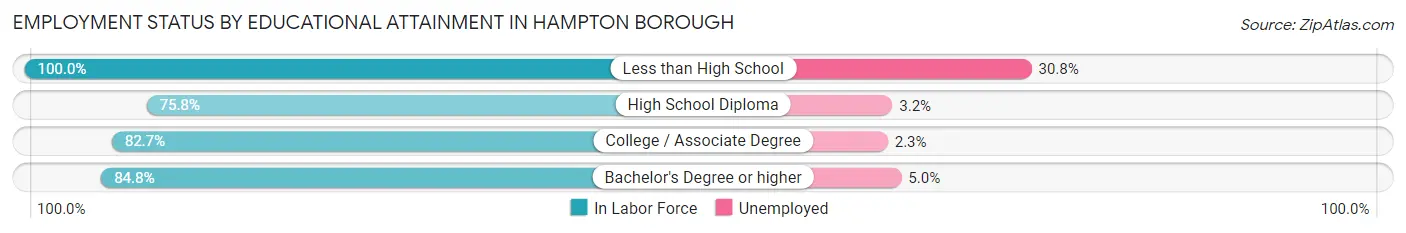
| Educational Attainment | In Labor Force | Unemployed |
| Less than High School | 26 (100.0%) | 8 (30.8%) |
| High School Diploma | 94 (75.8%) | 4 (3.2%) |
| College / Associate Degree | 129 (82.7%) | 4 (2.3%) |
| Bachelor's Degree or higher | 201 (84.8%) | 12 (5.0%) |
| Total | 450 (82.9%) | 29 (5.3%) |
Employment Occupations by Sex in Hampton borough
Management, Business, Science and Arts Occupations
The most common Management, Business, Science and Arts occupations in Hampton borough are Management (88 | 17.5%), Community & Social Service (62 | 12.3%), Education Instruction & Library (42 | 8.4%), Business & Financial (35 | 7.0%), and Computers, Engineering & Science (29 | 5.8%).
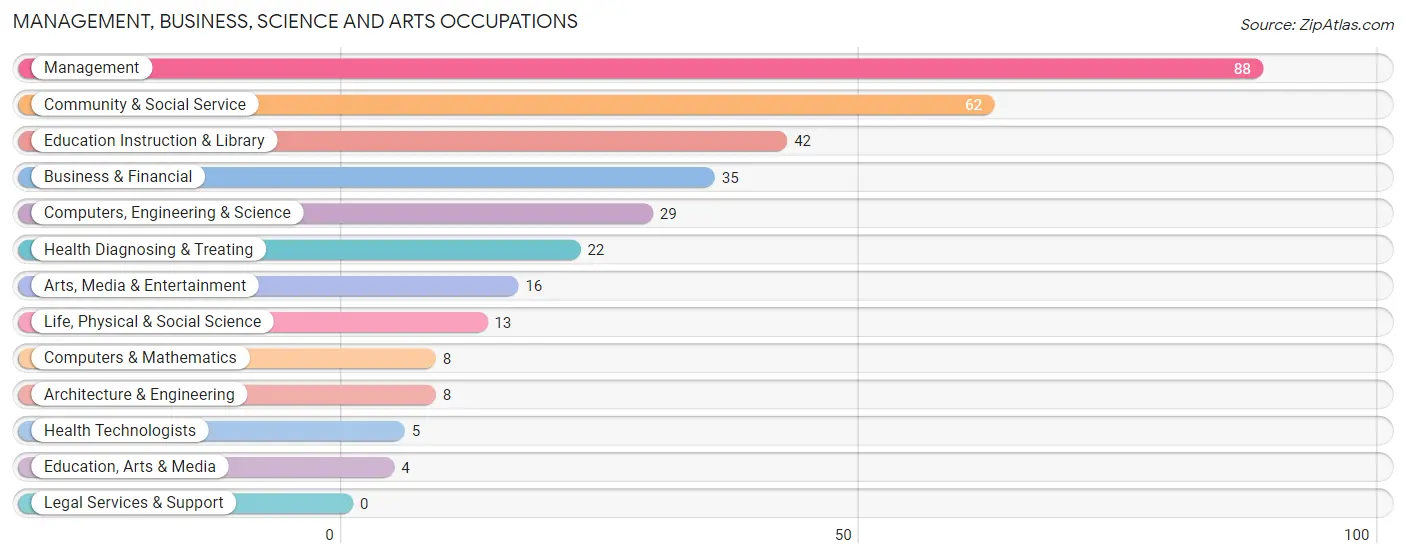
Management, Business, Science and Arts Occupations by Sex
Within the Management, Business, Science and Arts occupations in Hampton borough, the most male-oriented occupations are Computers & Mathematics (100.0%), Architecture & Engineering (100.0%), and Computers, Engineering & Science (65.5%), while the most female-oriented occupations are Education, Arts & Media (100.0%), Health Technologists (100.0%), and Health Diagnosing & Treating (86.4%).
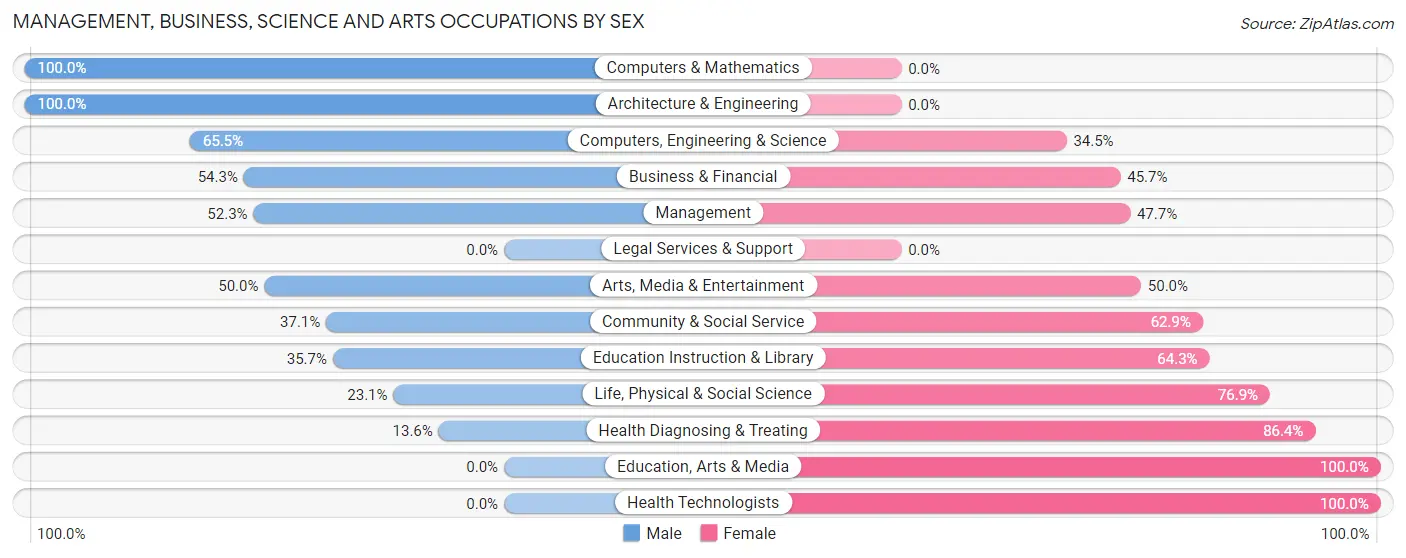
| Occupation | Male | Female |
| Management | 46 (52.3%) | 42 (47.7%) |
| Business & Financial | 19 (54.3%) | 16 (45.7%) |
| Computers, Engineering & Science | 19 (65.5%) | 10 (34.5%) |
| Computers & Mathematics | 8 (100.0%) | 0 (0.0%) |
| Architecture & Engineering | 8 (100.0%) | 0 (0.0%) |
| Life, Physical & Social Science | 3 (23.1%) | 10 (76.9%) |
| Community & Social Service | 23 (37.1%) | 39 (62.9%) |
| Education, Arts & Media | 0 (0.0%) | 4 (100.0%) |
| Legal Services & Support | 0 (0.0%) | 0 (0.0%) |
| Education Instruction & Library | 15 (35.7%) | 27 (64.3%) |
| Arts, Media & Entertainment | 8 (50.0%) | 8 (50.0%) |
| Health Diagnosing & Treating | 3 (13.6%) | 19 (86.4%) |
| Health Technologists | 0 (0.0%) | 5 (100.0%) |
| Total (Category) | 110 (46.6%) | 126 (53.4%) |
| Total (Overall) | 269 (53.6%) | 233 (46.4%) |
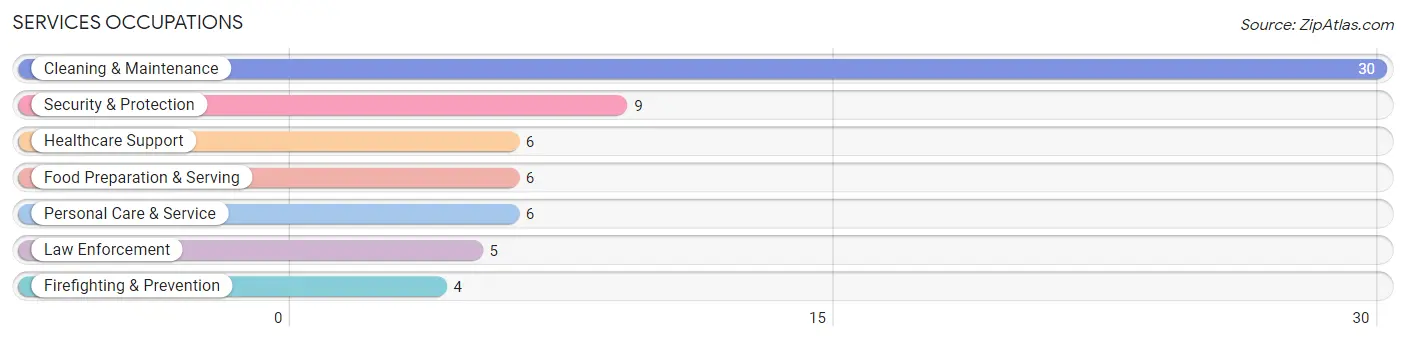
Services Occupations
The most common Services occupations in Hampton borough are Cleaning & Maintenance (30 | 6.0%), Security & Protection (9 | 1.8%), Healthcare Support (6 | 1.2%), Food Preparation & Serving (6 | 1.2%), and Personal Care & Service (6 | 1.2%).
Services Occupations by Sex
Within the Services occupations in Hampton borough, the most male-oriented occupations are Security & Protection (100.0%), Firefighting & Prevention (100.0%), and Law Enforcement (100.0%), while the most female-oriented occupations are Healthcare Support (100.0%), Food Preparation & Serving (100.0%), and Personal Care & Service (100.0%).
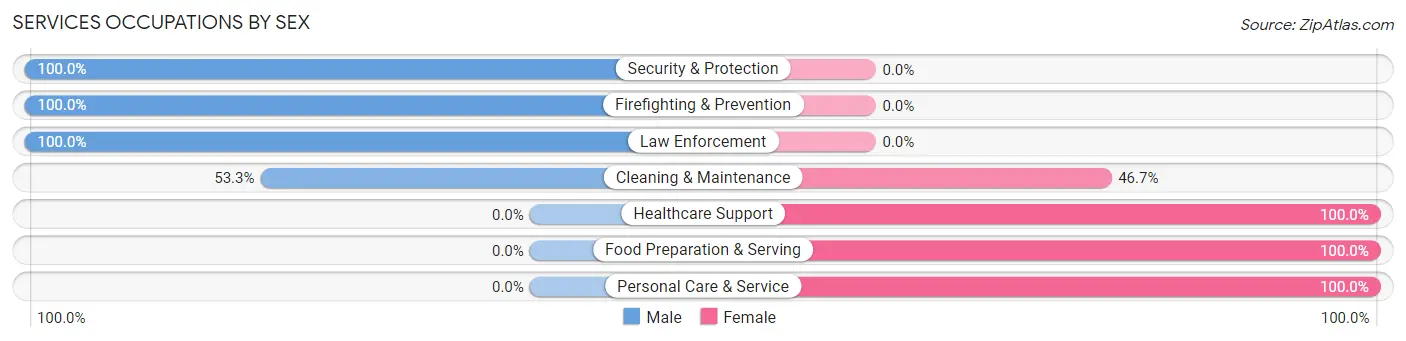
| Occupation | Male | Female |
| Healthcare Support | 0 (0.0%) | 6 (100.0%) |
| Security & Protection | 9 (100.0%) | 0 (0.0%) |
| Firefighting & Prevention | 4 (100.0%) | 0 (0.0%) |
| Law Enforcement | 5 (100.0%) | 0 (0.0%) |
| Food Preparation & Serving | 0 (0.0%) | 6 (100.0%) |
| Cleaning & Maintenance | 16 (53.3%) | 14 (46.7%) |
| Personal Care & Service | 0 (0.0%) | 6 (100.0%) |
| Total (Category) | 25 (43.9%) | 32 (56.1%) |
| Total (Overall) | 269 (53.6%) | 233 (46.4%) |
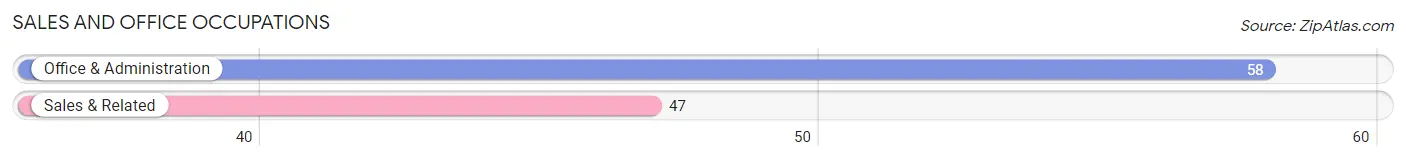
Sales and Office Occupations
The most common Sales and Office occupations in Hampton borough are Office & Administration (58 | 11.6%), and Sales & Related (47 | 9.4%).
Sales and Office Occupations by Sex
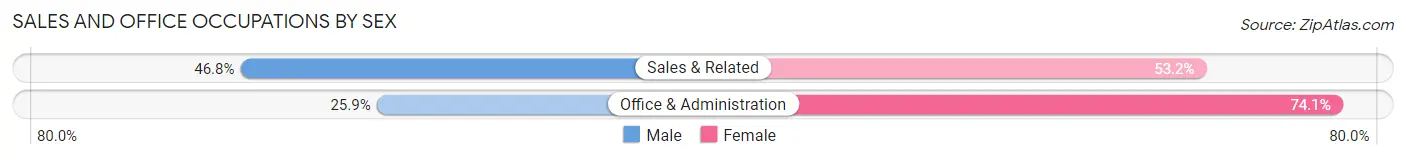
| Occupation | Male | Female |
| Sales & Related | 22 (46.8%) | 25 (53.2%) |
| Office & Administration | 15 (25.9%) | 43 (74.1%) |
| Total (Category) | 37 (35.2%) | 68 (64.8%) |
| Total (Overall) | 269 (53.6%) | 233 (46.4%) |
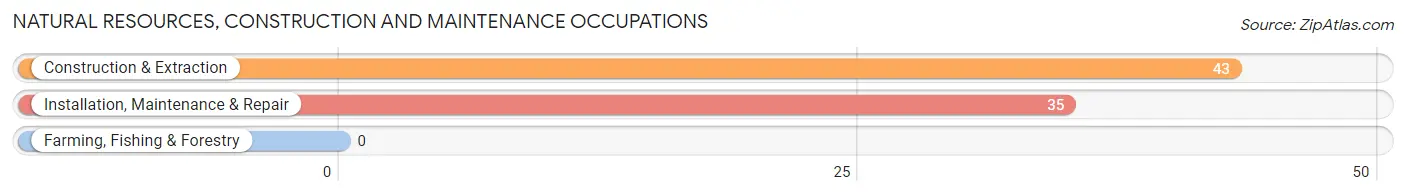
Natural Resources, Construction and Maintenance Occupations
The most common Natural Resources, Construction and Maintenance occupations in Hampton borough are Construction & Extraction (43 | 8.6%), and Installation, Maintenance & Repair (35 | 7.0%).
Natural Resources, Construction and Maintenance Occupations by Sex
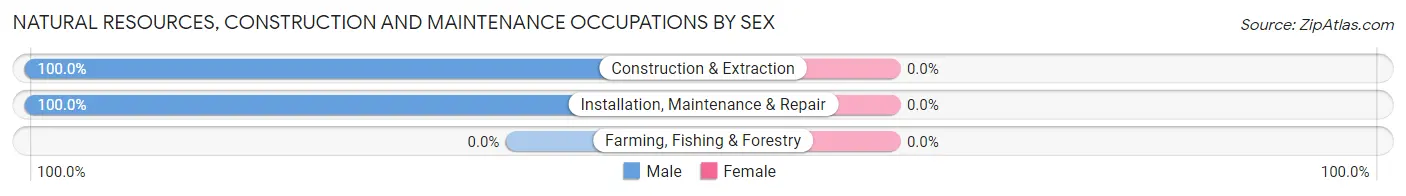
| Occupation | Male | Female |
| Farming, Fishing & Forestry | 0 (0.0%) | 0 (0.0%) |
| Construction & Extraction | 43 (100.0%) | 0 (0.0%) |
| Installation, Maintenance & Repair | 35 (100.0%) | 0 (0.0%) |
| Total (Category) | 78 (100.0%) | 0 (0.0%) |
| Total (Overall) | 269 (53.6%) | 233 (46.4%) |
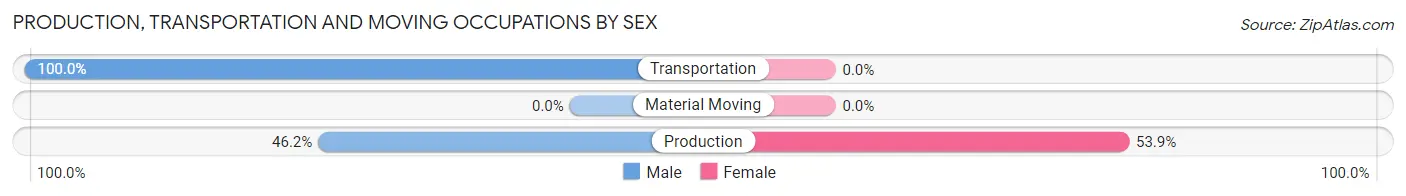
Production, Transportation and Moving Occupations
The most common Production, Transportation and Moving occupations in Hampton borough are Production (13 | 2.6%), and Transportation (13 | 2.6%).
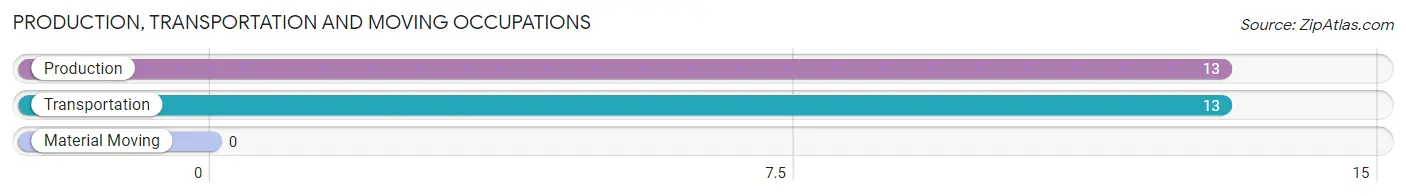
Production, Transportation and Moving Occupations by Sex
| Occupation | Male | Female |
| Production | 6 (46.2%) | 7 (53.8%) |
| Transportation | 13 (100.0%) | 0 (0.0%) |
| Material Moving | 0 (0.0%) | 0 (0.0%) |
| Total (Category) | 19 (73.1%) | 7 (26.9%) |
| Total (Overall) | 269 (53.6%) | 233 (46.4%) |
Employment Industries by Sex in Hampton borough
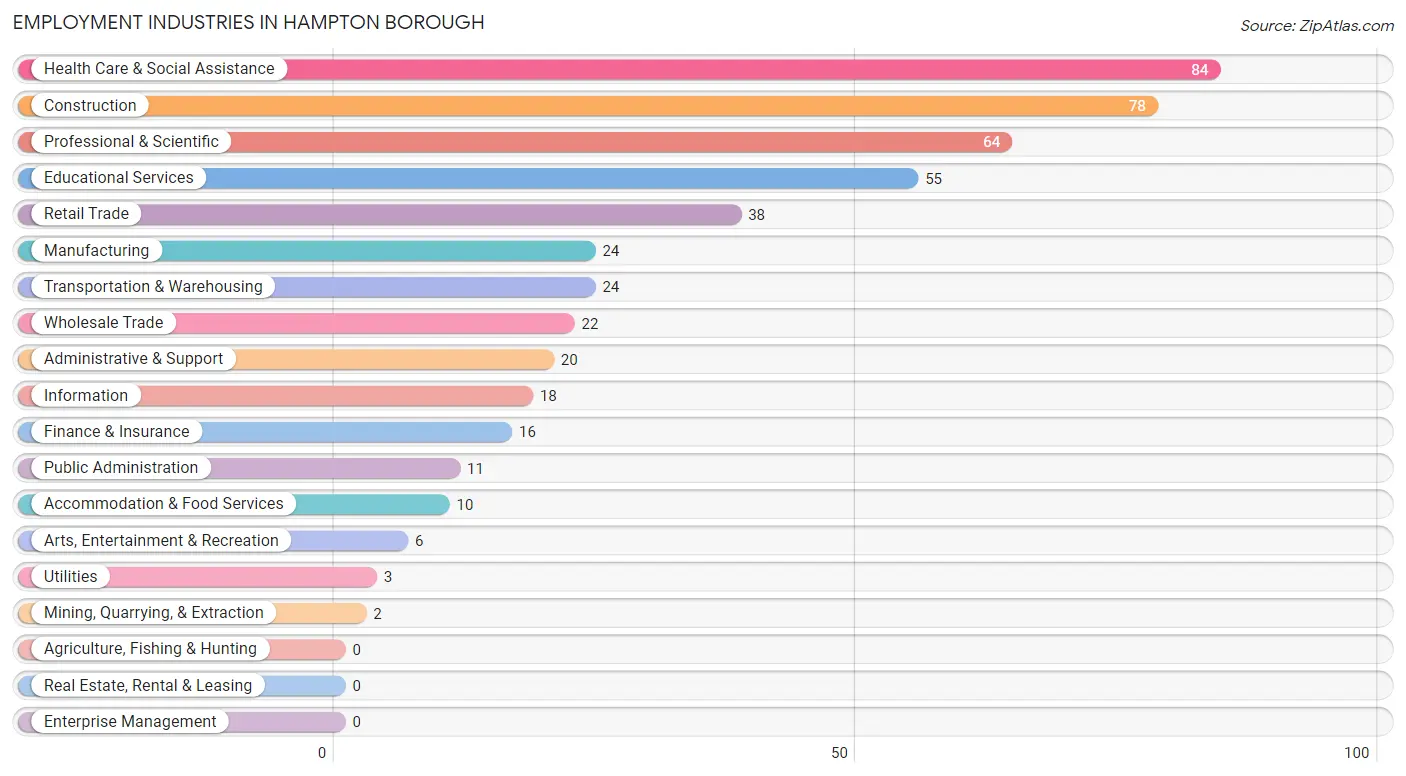
Employment Industries in Hampton borough
The major employment industries in Hampton borough include Health Care & Social Assistance (84 | 16.7%), Construction (78 | 15.5%), Professional & Scientific (64 | 12.8%), Educational Services (55 | 11.0%), and Retail Trade (38 | 7.6%).
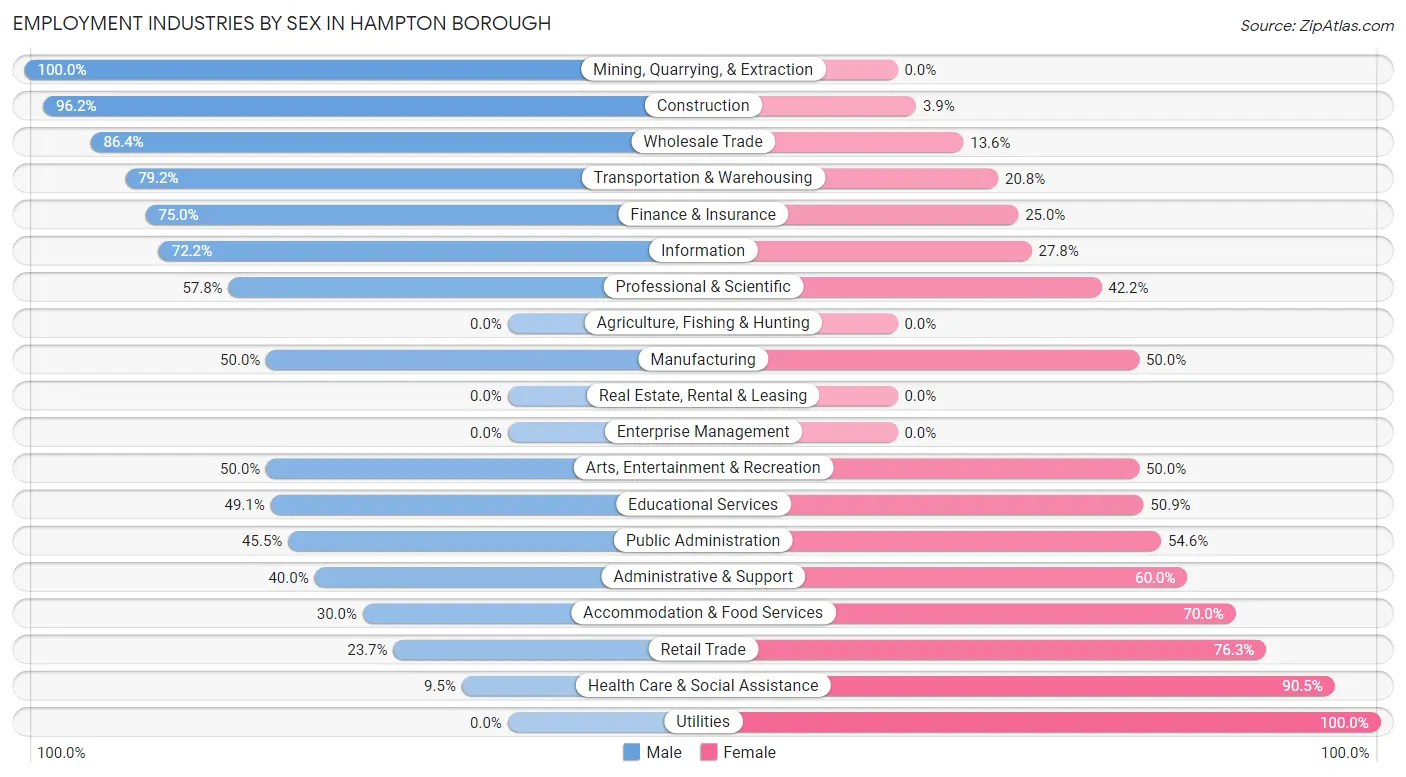
Employment Industries by Sex in Hampton borough
The Hampton borough industries that see more men than women are Mining, Quarrying, & Extraction (100.0%), Construction (96.2%), and Wholesale Trade (86.4%), whereas the industries that tend to have a higher number of women are Utilities (100.0%), Health Care & Social Assistance (90.5%), and Retail Trade (76.3%).
| Industry | Male | Female |
| Agriculture, Fishing & Hunting | 0 (0.0%) | 0 (0.0%) |
| Mining, Quarrying, & Extraction | 2 (100.0%) | 0 (0.0%) |
| Construction | 75 (96.2%) | 3 (3.8%) |
| Manufacturing | 12 (50.0%) | 12 (50.0%) |
| Wholesale Trade | 19 (86.4%) | 3 (13.6%) |
| Retail Trade | 9 (23.7%) | 29 (76.3%) |
| Transportation & Warehousing | 19 (79.2%) | 5 (20.8%) |
| Utilities | 0 (0.0%) | 3 (100.0%) |
| Information | 13 (72.2%) | 5 (27.8%) |
| Finance & Insurance | 12 (75.0%) | 4 (25.0%) |
| Real Estate, Rental & Leasing | 0 (0.0%) | 0 (0.0%) |
| Professional & Scientific | 37 (57.8%) | 27 (42.2%) |
| Enterprise Management | 0 (0.0%) | 0 (0.0%) |
| Administrative & Support | 8 (40.0%) | 12 (60.0%) |
| Educational Services | 27 (49.1%) | 28 (50.9%) |
| Health Care & Social Assistance | 8 (9.5%) | 76 (90.5%) |
| Arts, Entertainment & Recreation | 3 (50.0%) | 3 (50.0%) |
| Accommodation & Food Services | 3 (30.0%) | 7 (70.0%) |
| Public Administration | 5 (45.5%) | 6 (54.5%) |
| Total | 269 (53.6%) | 233 (46.4%) |
Education in Hampton borough
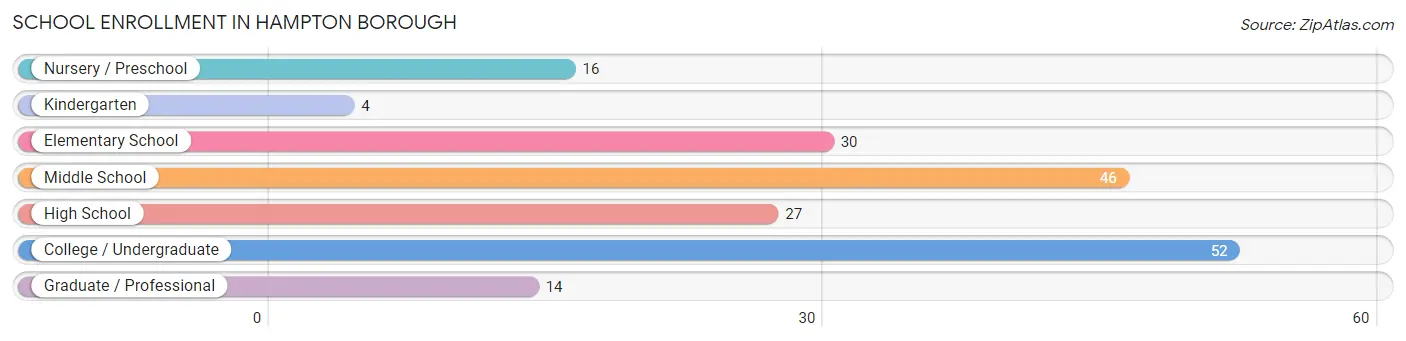
School Enrollment in Hampton borough
The most common levels of schooling among the 189 students in Hampton borough are college / undergraduate (52 | 27.5%), middle school (46 | 24.3%), and elementary school (30 | 15.9%).
| School Level | # Students | % Students |
| Nursery / Preschool | 16 | 8.5% |
| Kindergarten | 4 | 2.1% |
| Elementary School | 30 | 15.9% |
| Middle School | 46 | 24.3% |
| High School | 27 | 14.3% |
| College / Undergraduate | 52 | 27.5% |
| Graduate / Professional | 14 | 7.4% |
| Total | 189 | 100.0% |
School Enrollment by Age by Funding Source in Hampton borough
Out of a total of 189 students who are enrolled in schools in Hampton borough, 30 (15.9%) attend a private institution, while the remaining 159 (84.1%) are enrolled in public schools. The age group of 3 to 4 year olds has the highest likelihood of being enrolled in private schools, with 8 (57.1% in the age bracket) enrolled. Conversely, the age group of 15 to 17 year olds has the lowest likelihood of being enrolled in a private school, with 20 (100.0% in the age bracket) attending a public institution.
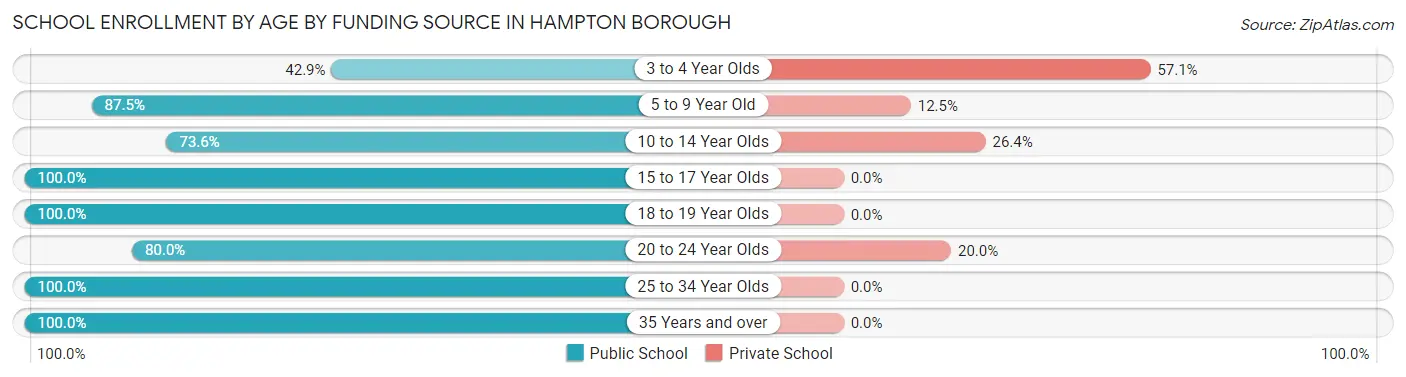
| Age Bracket | Public School | Private School |
| 3 to 4 Year Olds | 6 (42.9%) | 8 (57.1%) |
| 5 to 9 Year Old | 28 (87.5%) | 4 (12.5%) |
| 10 to 14 Year Olds | 39 (73.6%) | 14 (26.4%) |
| 15 to 17 Year Olds | 20 (100.0%) | 0 (0.0%) |
| 18 to 19 Year Olds | 18 (100.0%) | 0 (0.0%) |
| 20 to 24 Year Olds | 16 (80.0%) | 4 (20.0%) |
| 25 to 34 Year Olds | 28 (100.0%) | 0 (0.0%) |
| 35 Years and over | 4 (100.0%) | 0 (0.0%) |
| Total | 159 (84.1%) | 30 (15.9%) |
Educational Attainment by Field of Study in Hampton borough
Business (86 | 26.8%), literature & languages (47 | 14.6%), engineering (31 | 9.7%), education (31 | 9.7%), and psychology (22 | 6.9%) are the most common fields of study among 321 individuals in Hampton borough who have obtained a bachelor's degree or higher.
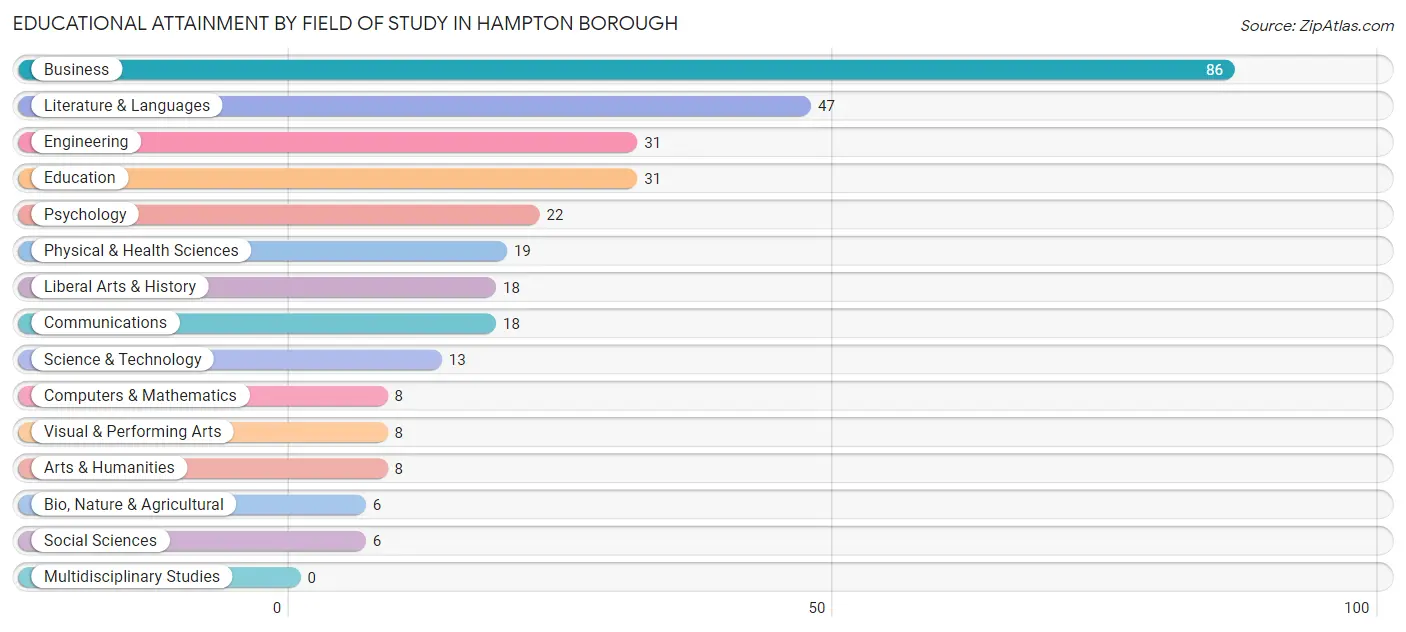
| Field of Study | # Graduates | % Graduates |
| Computers & Mathematics | 8 | 2.5% |
| Bio, Nature & Agricultural | 6 | 1.9% |
| Physical & Health Sciences | 19 | 5.9% |
| Psychology | 22 | 6.9% |
| Social Sciences | 6 | 1.9% |
| Engineering | 31 | 9.7% |
| Multidisciplinary Studies | 0 | 0.0% |
| Science & Technology | 13 | 4.1% |
| Business | 86 | 26.8% |
| Education | 31 | 9.7% |
| Literature & Languages | 47 | 14.6% |
| Liberal Arts & History | 18 | 5.6% |
| Visual & Performing Arts | 8 | 2.5% |
| Communications | 18 | 5.6% |
| Arts & Humanities | 8 | 2.5% |
| Total | 321 | 100.0% |
Transportation & Commute in Hampton borough
Vehicle Availability by Sex in Hampton borough
The most prevalent vehicle ownership categories in Hampton borough are males with 2 vehicles (134, accounting for 49.8%) and females with 2 vehicles (116, making up 60.6%).
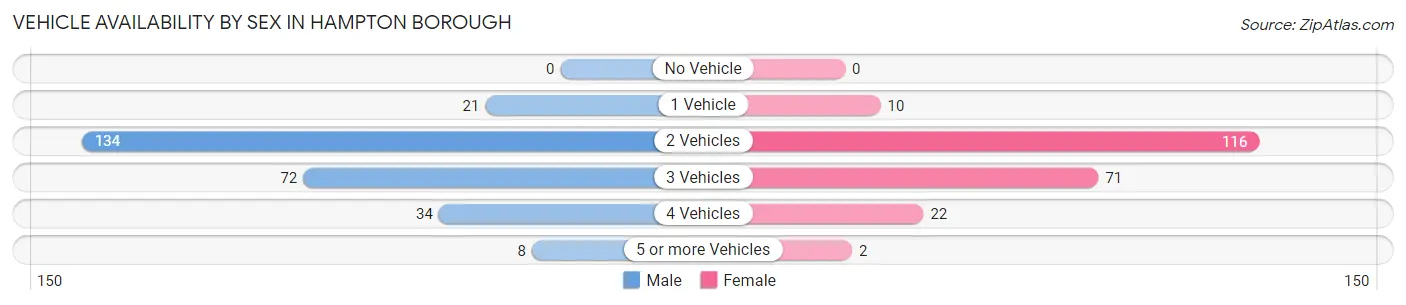
| Vehicles Available | Male | Female |
| No Vehicle | 0 (0.0%) | 0 (0.0%) |
| 1 Vehicle | 21 (7.8%) | 10 (4.5%) |
| 2 Vehicles | 134 (49.8%) | 116 (52.5%) |
| 3 Vehicles | 72 (26.8%) | 71 (32.1%) |
| 4 Vehicles | 34 (12.6%) | 22 (10.0%) |
| 5 or more Vehicles | 8 (3.0%) | 2 (0.9%) |
| Total | 269 (100.0%) | 221 (100.0%) |
Commute Time in Hampton borough
The most frequently occuring commute durations in Hampton borough are 30 to 34 minutes (72 commuters, 16.7%), 20 to 24 minutes (66 commuters, 15.3%), and 25 to 29 minutes (54 commuters, 12.5%).
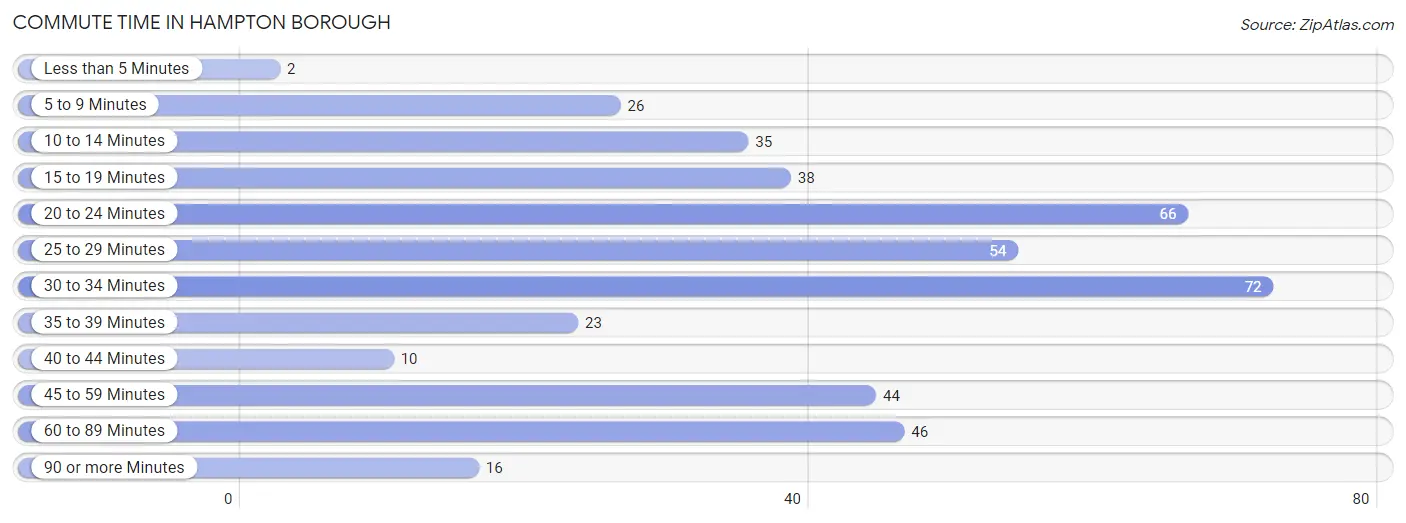
| Commute Time | # Commuters | % Commuters |
| Less than 5 Minutes | 2 | 0.5% |
| 5 to 9 Minutes | 26 | 6.0% |
| 10 to 14 Minutes | 35 | 8.1% |
| 15 to 19 Minutes | 38 | 8.8% |
| 20 to 24 Minutes | 66 | 15.3% |
| 25 to 29 Minutes | 54 | 12.5% |
| 30 to 34 Minutes | 72 | 16.7% |
| 35 to 39 Minutes | 23 | 5.3% |
| 40 to 44 Minutes | 10 | 2.3% |
| 45 to 59 Minutes | 44 | 10.2% |
| 60 to 89 Minutes | 46 | 10.6% |
| 90 or more Minutes | 16 | 3.7% |
Commute Time by Sex in Hampton borough
The most common commute times in Hampton borough are 30 to 34 minutes (47 commuters, 19.8%) for males and 20 to 24 minutes (60 commuters, 30.9%) for females.
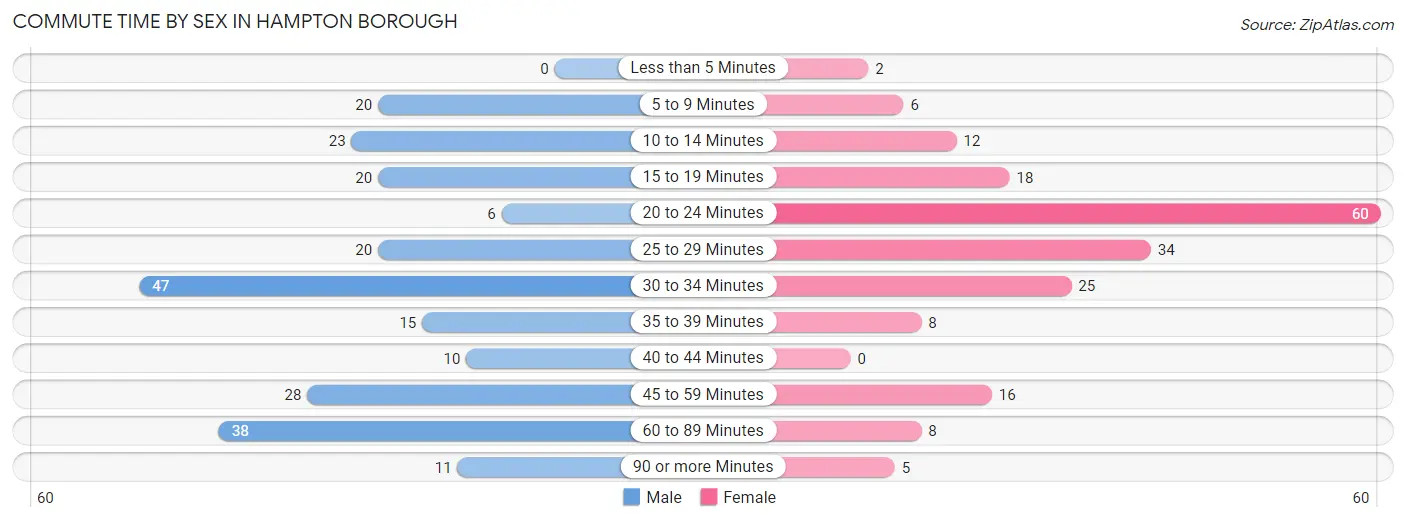
| Commute Time | Male | Female |
| Less than 5 Minutes | 0 (0.0%) | 2 (1.0%) |
| 5 to 9 Minutes | 20 (8.4%) | 6 (3.1%) |
| 10 to 14 Minutes | 23 (9.7%) | 12 (6.2%) |
| 15 to 19 Minutes | 20 (8.4%) | 18 (9.3%) |
| 20 to 24 Minutes | 6 (2.5%) | 60 (30.9%) |
| 25 to 29 Minutes | 20 (8.4%) | 34 (17.5%) |
| 30 to 34 Minutes | 47 (19.8%) | 25 (12.9%) |
| 35 to 39 Minutes | 15 (6.3%) | 8 (4.1%) |
| 40 to 44 Minutes | 10 (4.2%) | 0 (0.0%) |
| 45 to 59 Minutes | 28 (11.8%) | 16 (8.3%) |
| 60 to 89 Minutes | 38 (16.0%) | 8 (4.1%) |
| 90 or more Minutes | 11 (4.6%) | 5 (2.6%) |
Time of Departure to Work by Sex in Hampton borough
The most frequent times of departure to work in Hampton borough are 6:00 AM to 6:29 AM (39, 16.4%) for males and 7:30 AM to 7:59 AM (57, 29.4%) for females.
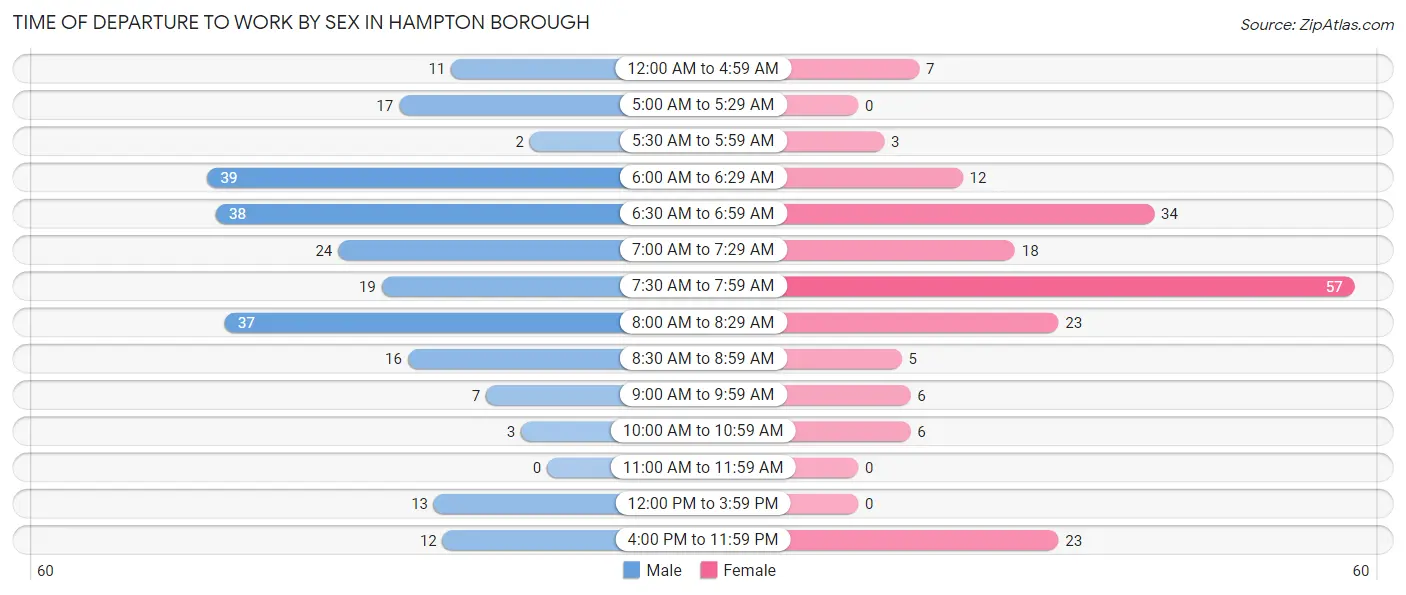
| Time of Departure | Male | Female |
| 12:00 AM to 4:59 AM | 11 (4.6%) | 7 (3.6%) |
| 5:00 AM to 5:29 AM | 17 (7.1%) | 0 (0.0%) |
| 5:30 AM to 5:59 AM | 2 (0.8%) | 3 (1.5%) |
| 6:00 AM to 6:29 AM | 39 (16.4%) | 12 (6.2%) |
| 6:30 AM to 6:59 AM | 38 (16.0%) | 34 (17.5%) |
| 7:00 AM to 7:29 AM | 24 (10.1%) | 18 (9.3%) |
| 7:30 AM to 7:59 AM | 19 (8.0%) | 57 (29.4%) |
| 8:00 AM to 8:29 AM | 37 (15.5%) | 23 (11.9%) |
| 8:30 AM to 8:59 AM | 16 (6.7%) | 5 (2.6%) |
| 9:00 AM to 9:59 AM | 7 (2.9%) | 6 (3.1%) |
| 10:00 AM to 10:59 AM | 3 (1.3%) | 6 (3.1%) |
| 11:00 AM to 11:59 AM | 0 (0.0%) | 0 (0.0%) |
| 12:00 PM to 3:59 PM | 13 (5.5%) | 0 (0.0%) |
| 4:00 PM to 11:59 PM | 12 (5.0%) | 23 (11.9%) |
| Total | 238 (100.0%) | 194 (100.0%) |
Housing Occupancy in Hampton borough
Occupancy by Ownership in Hampton borough
Of the total 486 dwellings in Hampton borough, owner-occupied units account for 355 (73.1%), while renter-occupied units make up 131 (27.0%).
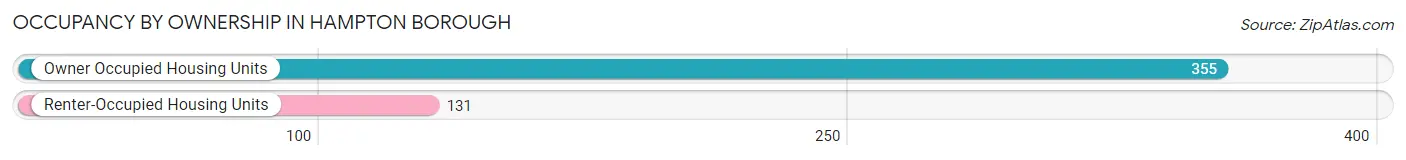
| Occupancy | # Housing Units | % Housing Units |
| Owner Occupied Housing Units | 355 | 73.1% |
| Renter-Occupied Housing Units | 131 | 27.0% |
| Total Occupied Housing Units | 486 | 100.0% |
Occupancy by Household Size in Hampton borough
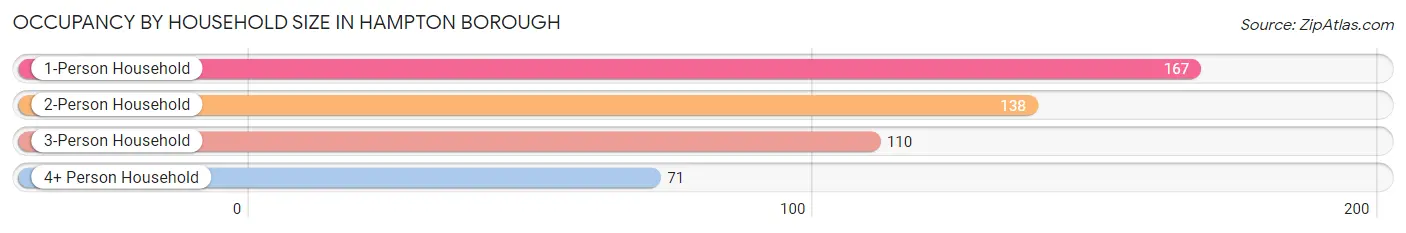
| Household Size | # Housing Units | % Housing Units |
| 1-Person Household | 167 | 34.4% |
| 2-Person Household | 138 | 28.4% |
| 3-Person Household | 110 | 22.6% |
| 4+ Person Household | 71 | 14.6% |
| Total Housing Units | 486 | 100.0% |
Occupancy by Ownership by Household Size in Hampton borough
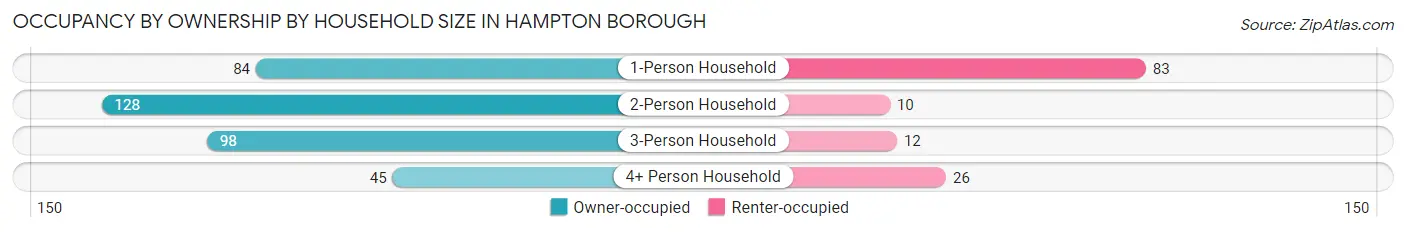
| Household Size | Owner-occupied | Renter-occupied |
| 1-Person Household | 84 (50.3%) | 83 (49.7%) |
| 2-Person Household | 128 (92.7%) | 10 (7.2%) |
| 3-Person Household | 98 (89.1%) | 12 (10.9%) |
| 4+ Person Household | 45 (63.4%) | 26 (36.6%) |
| Total Housing Units | 355 (73.1%) | 131 (27.0%) |
Occupancy by Educational Attainment in Hampton borough
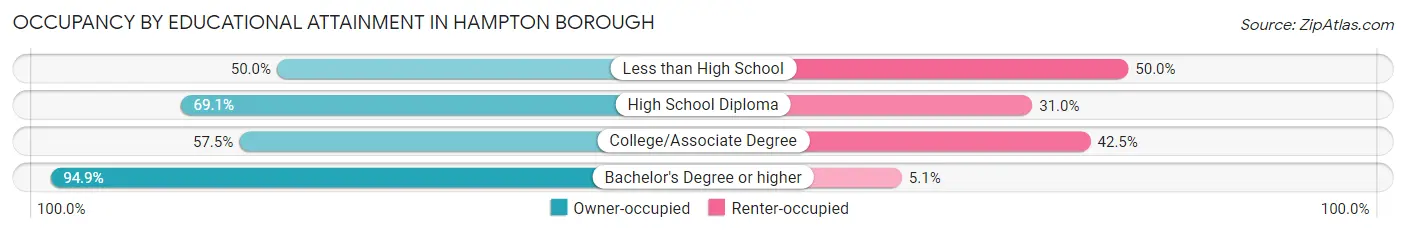
| Household Size | Owner-occupied | Renter-occupied |
| Less than High School | 17 (50.0%) | 17 (50.0%) |
| High School Diploma | 116 (69.1%) | 52 (30.9%) |
| College/Associate Degree | 73 (57.5%) | 54 (42.5%) |
| Bachelor's Degree or higher | 149 (94.9%) | 8 (5.1%) |
Occupancy by Age of Householder in Hampton borough
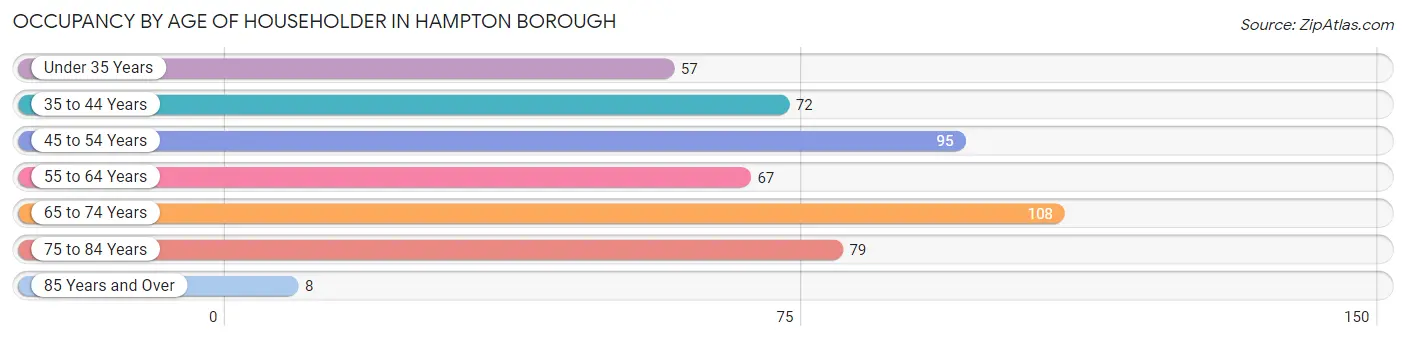
| Age Bracket | # Households | % Households |
| Under 35 Years | 57 | 11.7% |
| 35 to 44 Years | 72 | 14.8% |
| 45 to 54 Years | 95 | 19.6% |
| 55 to 64 Years | 67 | 13.8% |
| 65 to 74 Years | 108 | 22.2% |
| 75 to 84 Years | 79 | 16.3% |
| 85 Years and Over | 8 | 1.7% |
| Total | 486 | 100.0% |
Housing Finances in Hampton borough
Median Income by Occupancy in Hampton borough
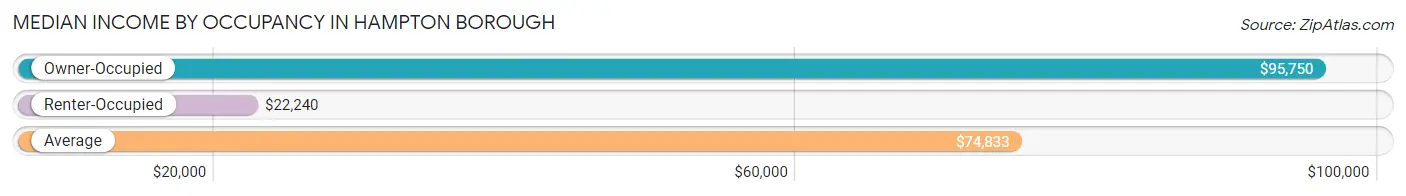
| Occupancy Type | # Households | Median Income |
| Owner-Occupied | 355 (73.1%) | $95,750 |
| Renter-Occupied | 131 (27.0%) | $22,240 |
| Average | 486 (100.0%) | $74,833 |
Occupancy by Householder Income Bracket in Hampton borough
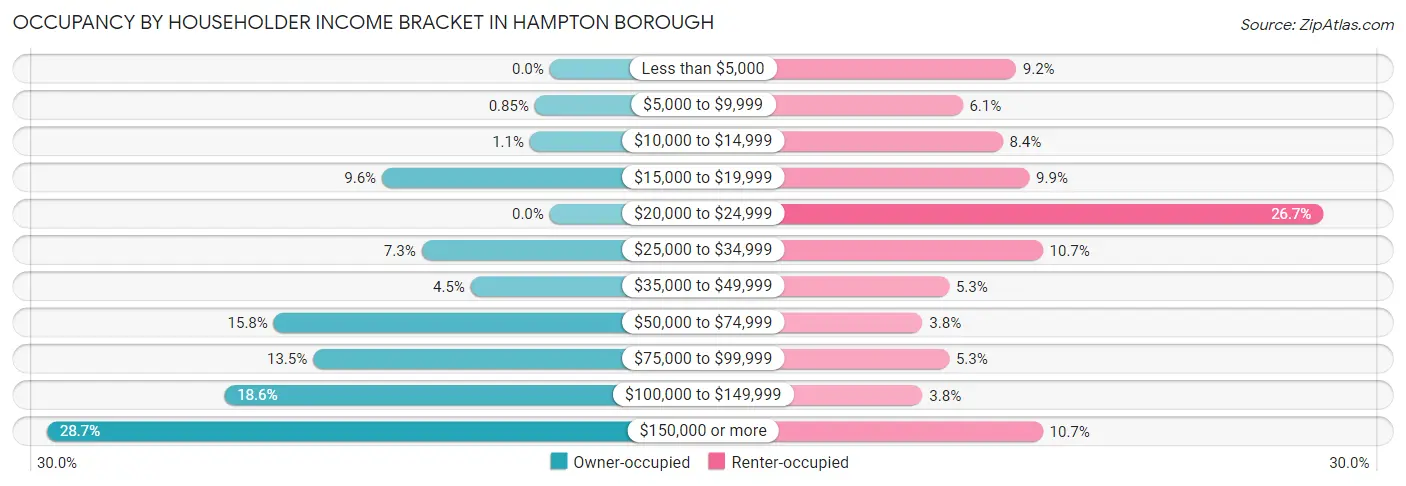
| Income Bracket | Owner-occupied | Renter-occupied |
| Less than $5,000 | 0 (0.0%) | 12 (9.2%) |
| $5,000 to $9,999 | 3 (0.9%) | 8 (6.1%) |
| $10,000 to $14,999 | 4 (1.1%) | 11 (8.4%) |
| $15,000 to $19,999 | 34 (9.6%) | 13 (9.9%) |
| $20,000 to $24,999 | 0 (0.0%) | 35 (26.7%) |
| $25,000 to $34,999 | 26 (7.3%) | 14 (10.7%) |
| $35,000 to $49,999 | 16 (4.5%) | 7 (5.3%) |
| $50,000 to $74,999 | 56 (15.8%) | 5 (3.8%) |
| $75,000 to $99,999 | 48 (13.5%) | 7 (5.3%) |
| $100,000 to $149,999 | 66 (18.6%) | 5 (3.8%) |
| $150,000 or more | 102 (28.7%) | 14 (10.7%) |
| Total | 355 (100.0%) | 131 (100.0%) |
Monthly Housing Cost Tiers in Hampton borough
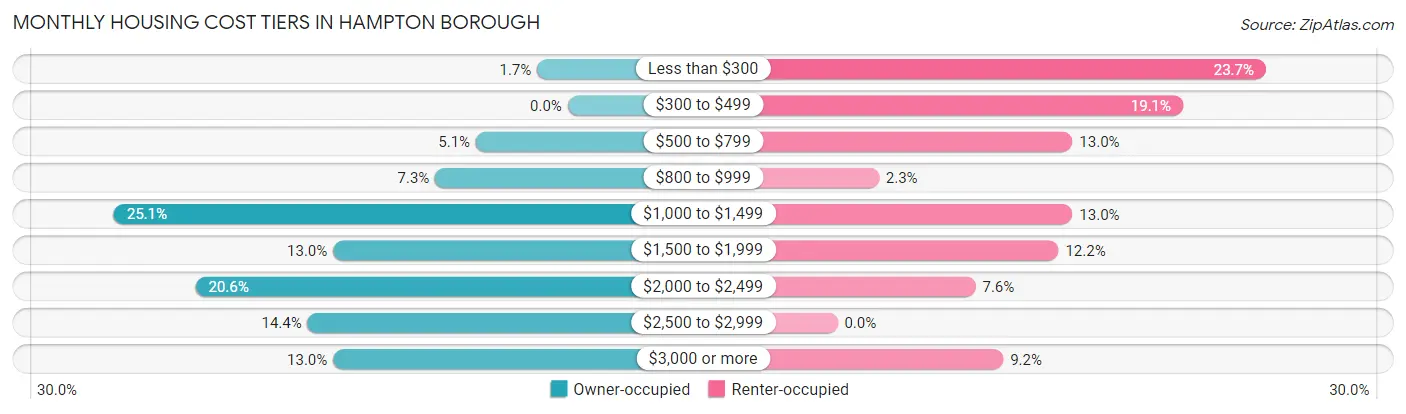
| Monthly Cost | Owner-occupied | Renter-occupied |
| Less than $300 | 6 (1.7%) | 31 (23.7%) |
| $300 to $499 | 0 (0.0%) | 25 (19.1%) |
| $500 to $799 | 18 (5.1%) | 17 (13.0%) |
| $800 to $999 | 26 (7.3%) | 3 (2.3%) |
| $1,000 to $1,499 | 89 (25.1%) | 17 (13.0%) |
| $1,500 to $1,999 | 46 (13.0%) | 16 (12.2%) |
| $2,000 to $2,499 | 73 (20.6%) | 10 (7.6%) |
| $2,500 to $2,999 | 51 (14.4%) | 0 (0.0%) |
| $3,000 or more | 46 (13.0%) | 12 (9.2%) |
| Total | 355 (100.0%) | 131 (100.0%) |
Physical Housing Characteristics in Hampton borough
Housing Structures in Hampton borough
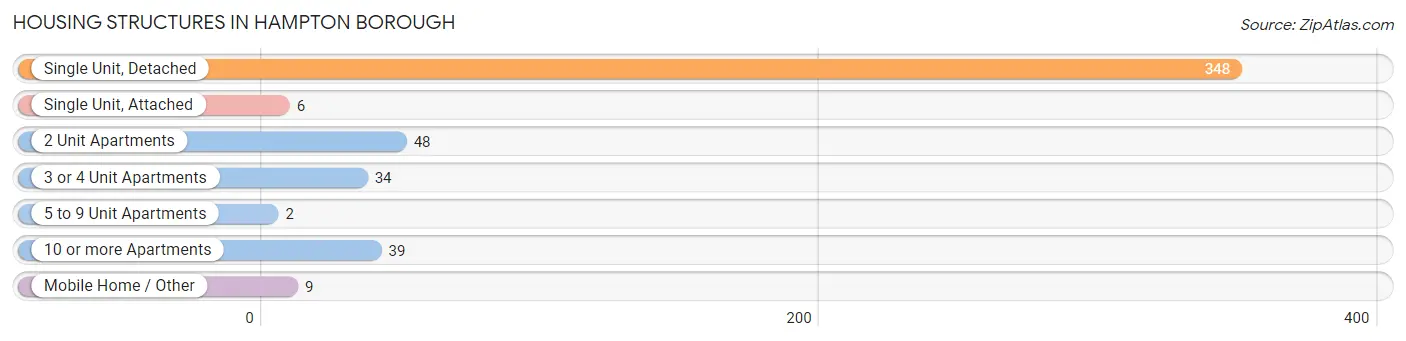
| Structure Type | # Housing Units | % Housing Units |
| Single Unit, Detached | 348 | 71.6% |
| Single Unit, Attached | 6 | 1.2% |
| 2 Unit Apartments | 48 | 9.9% |
| 3 or 4 Unit Apartments | 34 | 7.0% |
| 5 to 9 Unit Apartments | 2 | 0.4% |
| 10 or more Apartments | 39 | 8.0% |
| Mobile Home / Other | 9 | 1.8% |
| Total | 486 | 100.0% |
Housing Structures by Occupancy in Hampton borough
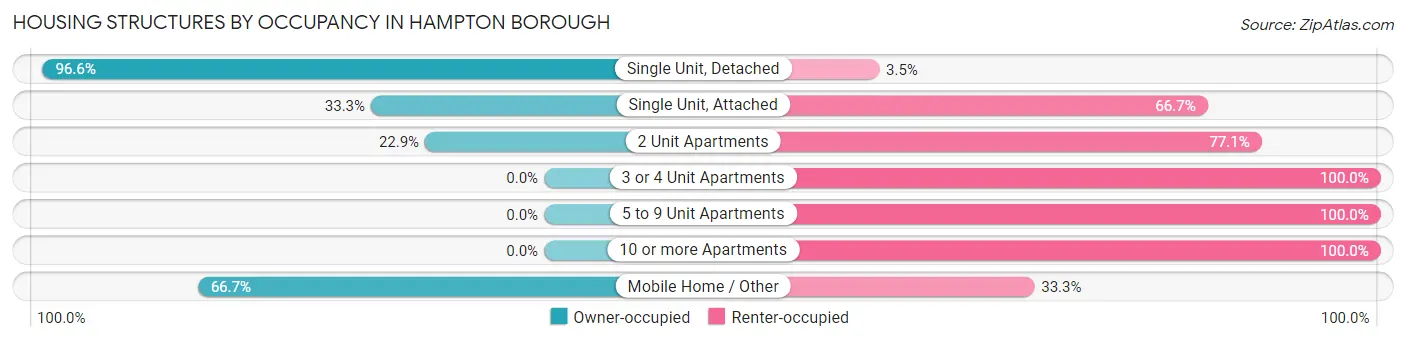
| Structure Type | Owner-occupied | Renter-occupied |
| Single Unit, Detached | 336 (96.6%) | 12 (3.5%) |
| Single Unit, Attached | 2 (33.3%) | 4 (66.7%) |
| 2 Unit Apartments | 11 (22.9%) | 37 (77.1%) |
| 3 or 4 Unit Apartments | 0 (0.0%) | 34 (100.0%) |
| 5 to 9 Unit Apartments | 0 (0.0%) | 2 (100.0%) |
| 10 or more Apartments | 0 (0.0%) | 39 (100.0%) |
| Mobile Home / Other | 6 (66.7%) | 3 (33.3%) |
| Total | 355 (73.1%) | 131 (27.0%) |
Housing Structures by Number of Rooms in Hampton borough
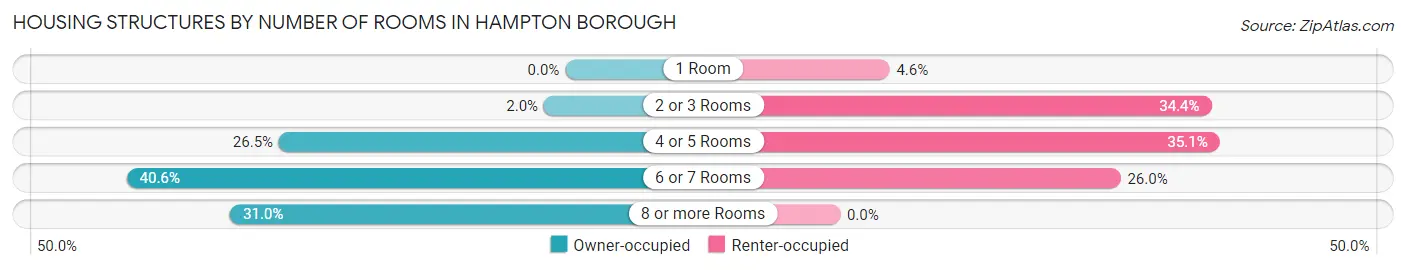
| Number of Rooms | Owner-occupied | Renter-occupied |
| 1 Room | 0 (0.0%) | 6 (4.6%) |
| 2 or 3 Rooms | 7 (2.0%) | 45 (34.4%) |
| 4 or 5 Rooms | 94 (26.5%) | 46 (35.1%) |
| 6 or 7 Rooms | 144 (40.6%) | 34 (26.0%) |
| 8 or more Rooms | 110 (31.0%) | 0 (0.0%) |
| Total | 355 (100.0%) | 131 (100.0%) |
Housing Structure by Heating Type in Hampton borough
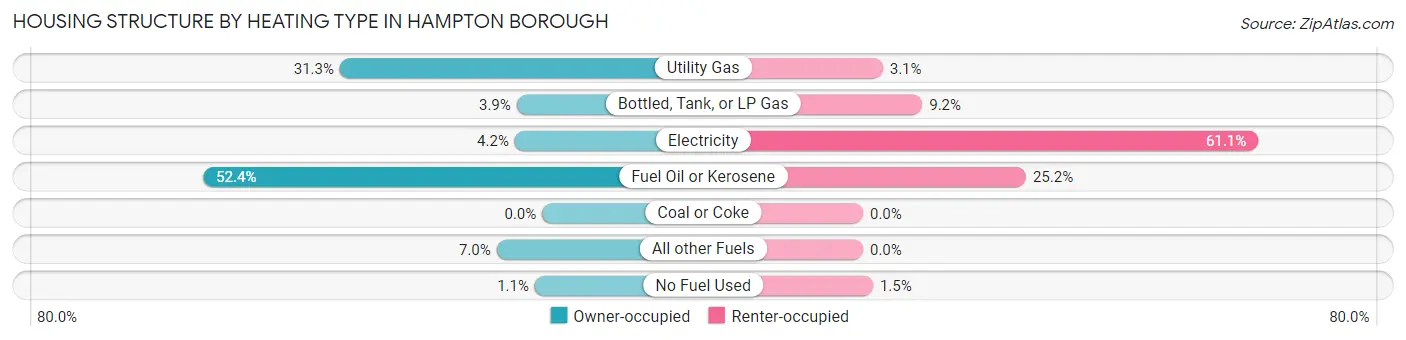
| Heating Type | Owner-occupied | Renter-occupied |
| Utility Gas | 111 (31.3%) | 4 (3.0%) |
| Bottled, Tank, or LP Gas | 14 (3.9%) | 12 (9.2%) |
| Electricity | 15 (4.2%) | 80 (61.1%) |
| Fuel Oil or Kerosene | 186 (52.4%) | 33 (25.2%) |
| Coal or Coke | 0 (0.0%) | 0 (0.0%) |
| All other Fuels | 25 (7.0%) | 0 (0.0%) |
| No Fuel Used | 4 (1.1%) | 2 (1.5%) |
| Total | 355 (100.0%) | 131 (100.0%) |
Household Vehicle Usage in Hampton borough
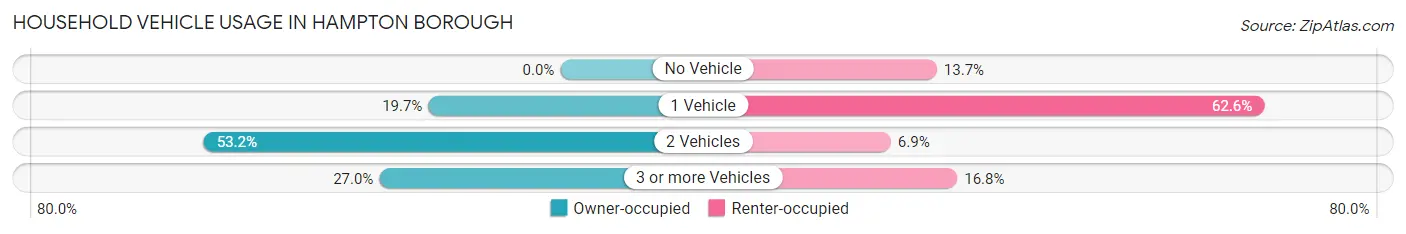
| Vehicles per Household | Owner-occupied | Renter-occupied |
| No Vehicle | 0 (0.0%) | 18 (13.7%) |
| 1 Vehicle | 70 (19.7%) | 82 (62.6%) |
| 2 Vehicles | 189 (53.2%) | 9 (6.9%) |
| 3 or more Vehicles | 96 (27.0%) | 22 (16.8%) |
| Total | 355 (100.0%) | 131 (100.0%) |
Real Estate & Mortgages in Hampton borough
Real Estate and Mortgage Overview in Hampton borough
| Characteristic | Without Mortgage | With Mortgage |
| Housing Units | 91 | 264 |
| Median Property Value | $325,000 | $284,300 |
| Median Household Income | $75,625 | $96 |
| Monthly Housing Costs | $1,018 | $46 |
| Real Estate Taxes | $8,686 | $3 |
Property Value by Mortgage Status in Hampton borough
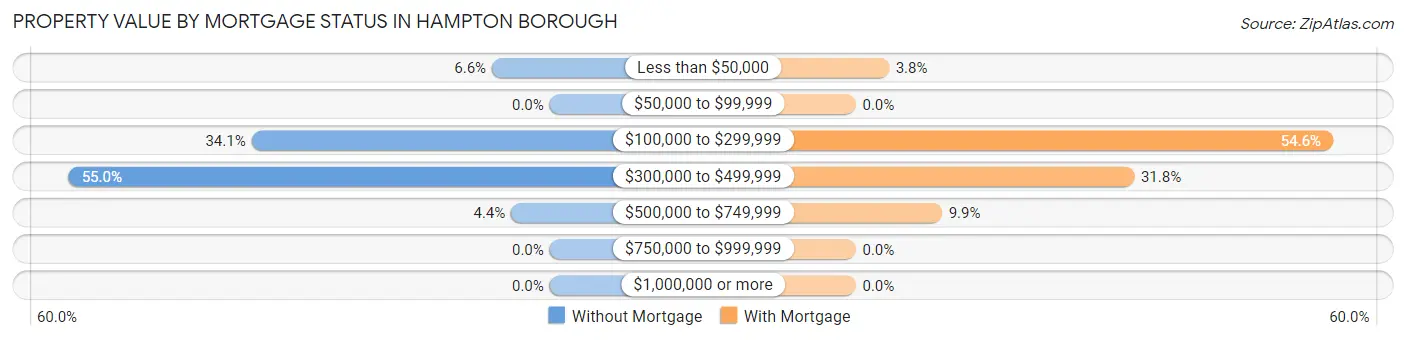
| Property Value | Without Mortgage | With Mortgage |
| Less than $50,000 | 6 (6.6%) | 10 (3.8%) |
| $50,000 to $99,999 | 0 (0.0%) | 0 (0.0%) |
| $100,000 to $299,999 | 31 (34.1%) | 144 (54.5%) |
| $300,000 to $499,999 | 50 (54.9%) | 84 (31.8%) |
| $500,000 to $749,999 | 4 (4.4%) | 26 (9.9%) |
| $750,000 to $999,999 | 0 (0.0%) | 0 (0.0%) |
| $1,000,000 or more | 0 (0.0%) | 0 (0.0%) |
| Total | 91 (100.0%) | 264 (100.0%) |
Household Income by Mortgage Status in Hampton borough
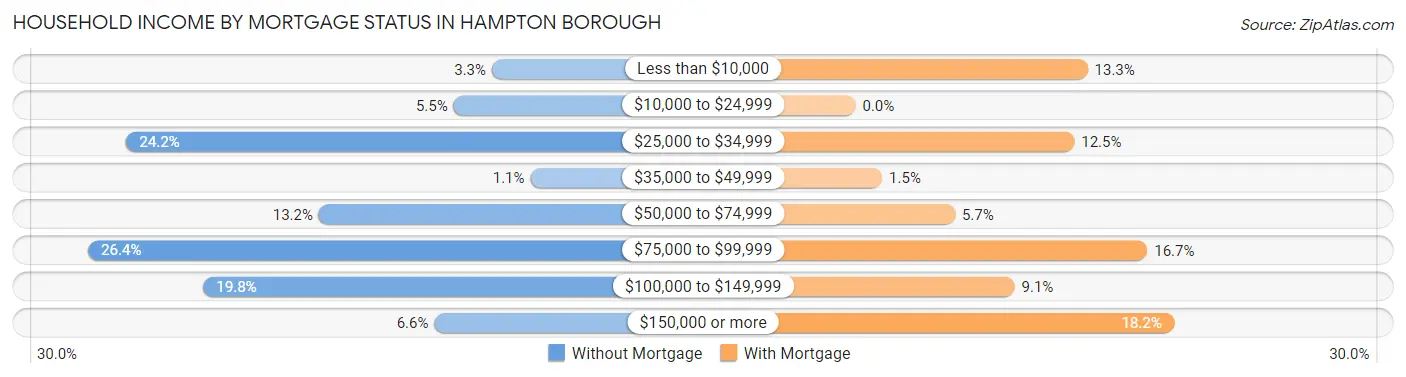
| Household Income | Without Mortgage | With Mortgage |
| Less than $10,000 | 3 (3.3%) | 35 (13.3%) |
| $10,000 to $24,999 | 5 (5.5%) | 0 (0.0%) |
| $25,000 to $34,999 | 22 (24.2%) | 33 (12.5%) |
| $35,000 to $49,999 | 1 (1.1%) | 4 (1.5%) |
| $50,000 to $74,999 | 12 (13.2%) | 15 (5.7%) |
| $75,000 to $99,999 | 24 (26.4%) | 44 (16.7%) |
| $100,000 to $149,999 | 18 (19.8%) | 24 (9.1%) |
| $150,000 or more | 6 (6.6%) | 48 (18.2%) |
| Total | 91 (100.0%) | 264 (100.0%) |
Property Value to Household Income Ratio in Hampton borough
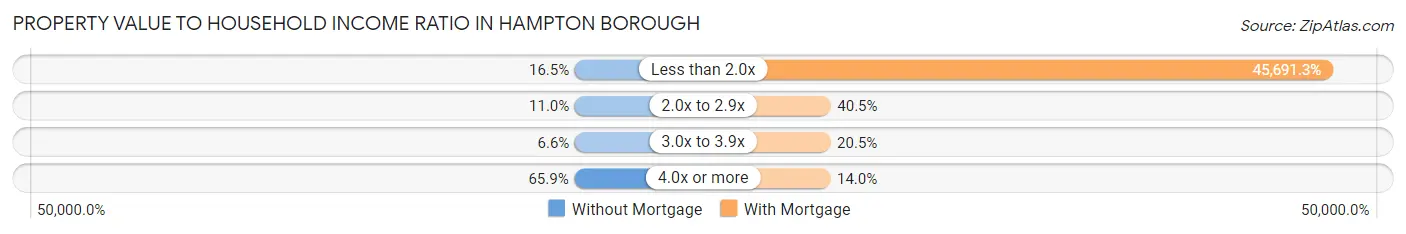
| Value-to-Income Ratio | Without Mortgage | With Mortgage |
| Less than 2.0x | 15 (16.5%) | 120,625 (45,691.3%) |
| 2.0x to 2.9x | 10 (11.0%) | 107 (40.5%) |
| 3.0x to 3.9x | 6 (6.6%) | 54 (20.4%) |
| 4.0x or more | 60 (65.9%) | 37 (14.0%) |
| Total | 91 (100.0%) | 264 (100.0%) |
Real Estate Taxes by Mortgage Status in Hampton borough
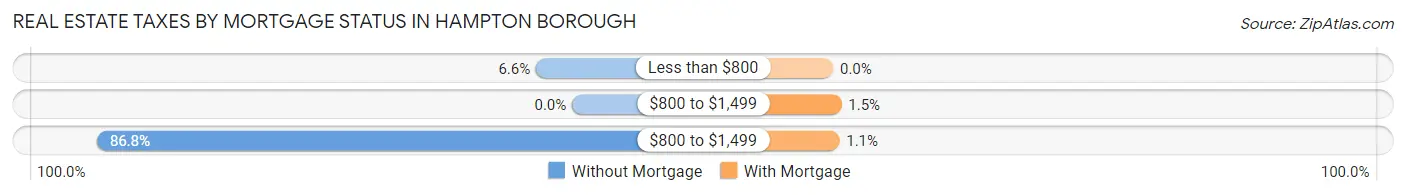
| Property Taxes | Without Mortgage | With Mortgage |
| Less than $800 | 6 (6.6%) | 0 (0.0%) |
| $800 to $1,499 | 0 (0.0%) | 4 (1.5%) |
| $800 to $1,499 | 79 (86.8%) | 3 (1.1%) |
| Total | 91 (100.0%) | 264 (100.0%) |
Health & Disability in Hampton borough
Health Insurance Coverage by Age in Hampton borough
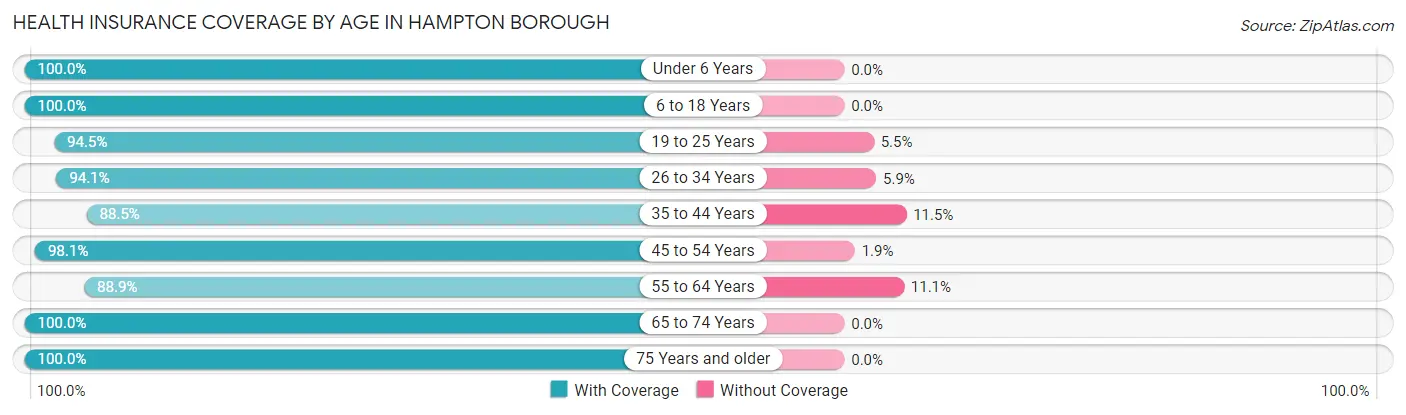
| Age Bracket | With Coverage | Without Coverage |
| Under 6 Years | 86 (100.0%) | 0 (0.0%) |
| 6 to 18 Years | 115 (100.0%) | 0 (0.0%) |
| 19 to 25 Years | 86 (94.5%) | 5 (5.5%) |
| 26 to 34 Years | 111 (94.1%) | 7 (5.9%) |
| 35 to 44 Years | 115 (88.5%) | 15 (11.5%) |
| 45 to 54 Years | 152 (98.1%) | 3 (1.9%) |
| 55 to 64 Years | 104 (88.9%) | 13 (11.1%) |
| 65 to 74 Years | 136 (100.0%) | 0 (0.0%) |
| 75 Years and older | 116 (100.0%) | 0 (0.0%) |
| Total | 1,021 (96.0%) | 43 (4.0%) |
Health Insurance Coverage by Citizenship Status in Hampton borough
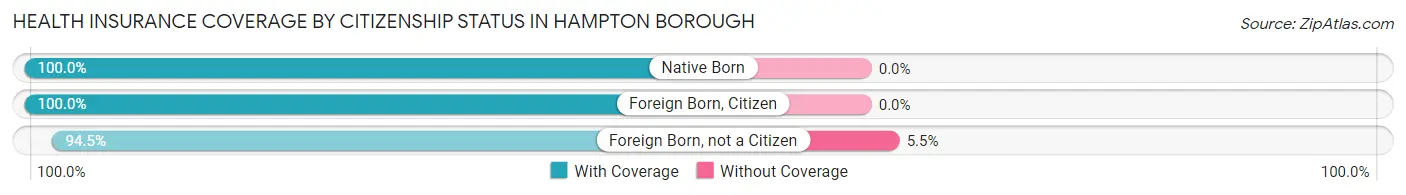
| Citizenship Status | With Coverage | Without Coverage |
| Native Born | 86 (100.0%) | 0 (0.0%) |
| Foreign Born, Citizen | 115 (100.0%) | 0 (0.0%) |
| Foreign Born, not a Citizen | 86 (94.5%) | 5 (5.5%) |
Health Insurance Coverage by Household Income in Hampton borough
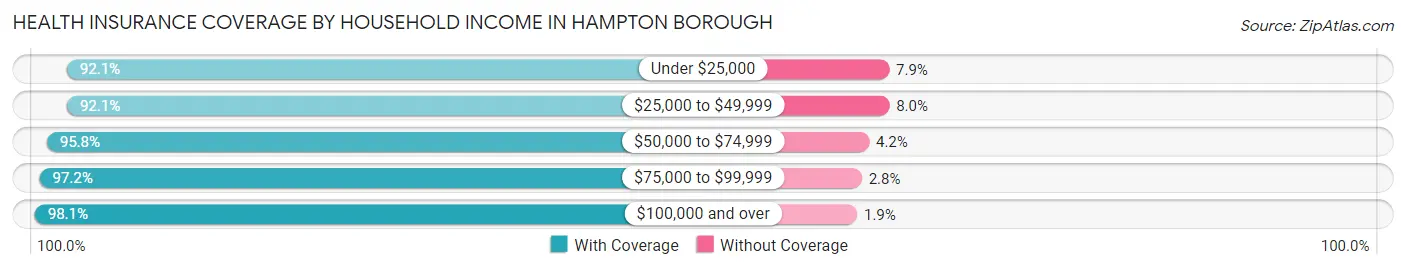
| Household Income | With Coverage | Without Coverage |
| Under $25,000 | 151 (92.1%) | 13 (7.9%) |
| $25,000 to $49,999 | 139 (92.0%) | 12 (8.0%) |
| $50,000 to $74,999 | 115 (95.8%) | 5 (4.2%) |
| $75,000 to $99,999 | 104 (97.2%) | 3 (2.8%) |
| $100,000 and over | 512 (98.1%) | 10 (1.9%) |
Public vs Private Health Insurance Coverage by Age in Hampton borough
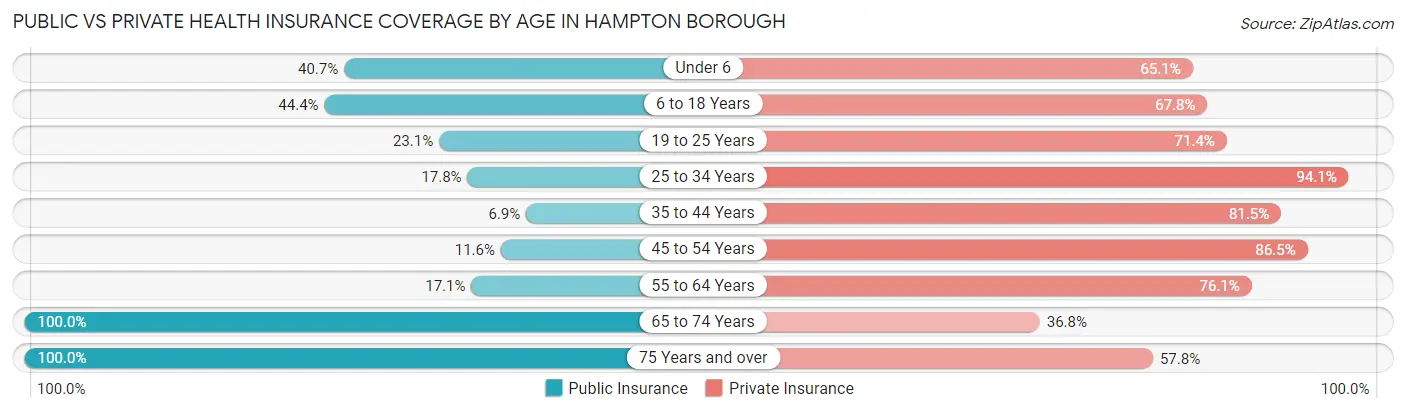
| Age Bracket | Public Insurance | Private Insurance |
| Under 6 | 35 (40.7%) | 56 (65.1%) |
| 6 to 18 Years | 51 (44.4%) | 78 (67.8%) |
| 19 to 25 Years | 21 (23.1%) | 65 (71.4%) |
| 25 to 34 Years | 21 (17.8%) | 111 (94.1%) |
| 35 to 44 Years | 9 (6.9%) | 106 (81.5%) |
| 45 to 54 Years | 18 (11.6%) | 134 (86.5%) |
| 55 to 64 Years | 20 (17.1%) | 89 (76.1%) |
| 65 to 74 Years | 136 (100.0%) | 50 (36.8%) |
| 75 Years and over | 116 (100.0%) | 67 (57.8%) |
| Total | 427 (40.1%) | 756 (71.1%) |
Disability Status by Sex by Age in Hampton borough
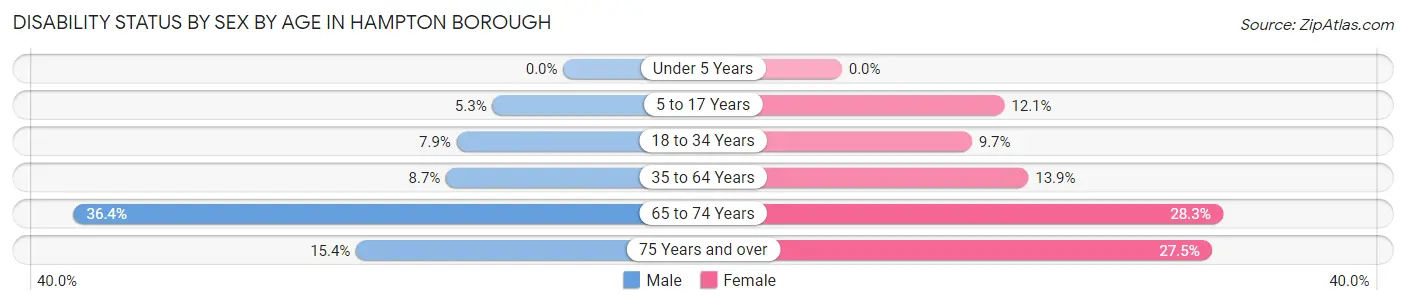
| Age Bracket | Male | Female |
| Under 5 Years | 0 (0.0%) | 0 (0.0%) |
| 5 to 17 Years | 3 (5.3%) | 7 (12.1%) |
| 18 to 34 Years | 8 (7.9%) | 11 (9.7%) |
| 35 to 64 Years | 18 (8.7%) | 27 (13.9%) |
| 65 to 74 Years | 16 (36.4%) | 26 (28.3%) |
| 75 Years and over | 10 (15.4%) | 14 (27.5%) |
Disability Class by Sex by Age in Hampton borough
Disability Class: Hearing Difficulty
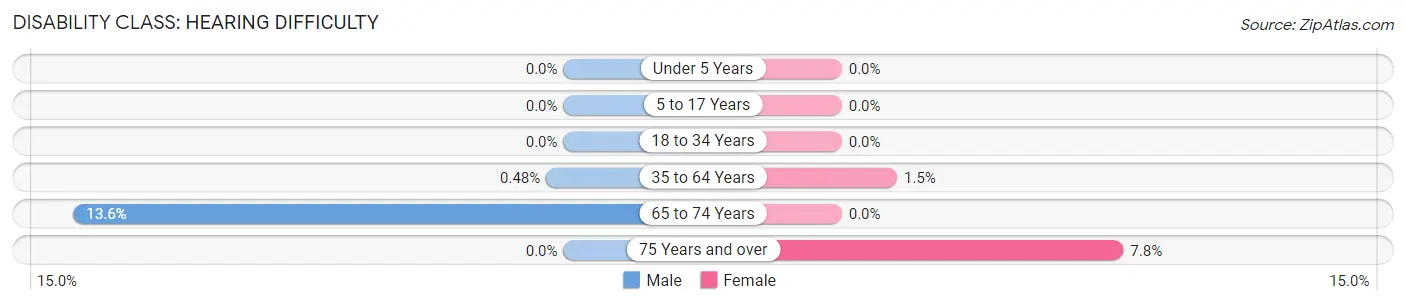
| Age Bracket | Male | Female |
| Under 5 Years | 0 (0.0%) | 0 (0.0%) |
| 5 to 17 Years | 0 (0.0%) | 0 (0.0%) |
| 18 to 34 Years | 0 (0.0%) | 0 (0.0%) |
| 35 to 64 Years | 1 (0.5%) | 3 (1.5%) |
| 65 to 74 Years | 6 (13.6%) | 0 (0.0%) |
| 75 Years and over | 0 (0.0%) | 4 (7.8%) |
Disability Class: Vision Difficulty
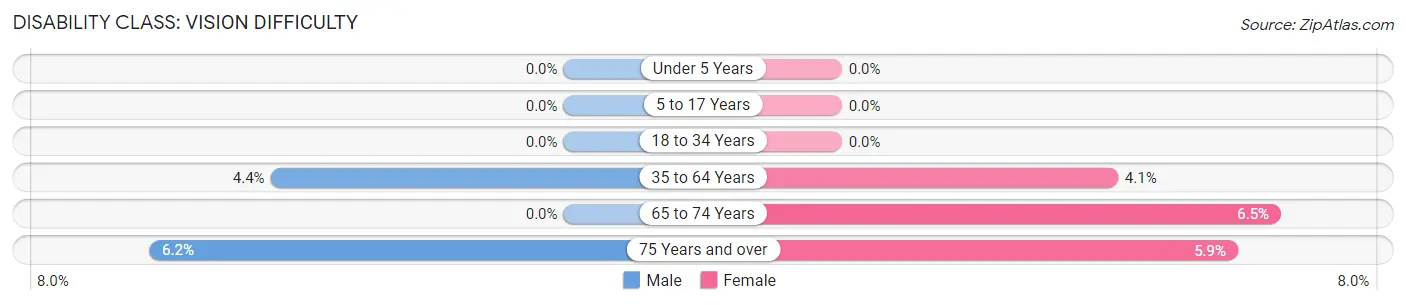
| Age Bracket | Male | Female |
| Under 5 Years | 0 (0.0%) | 0 (0.0%) |
| 5 to 17 Years | 0 (0.0%) | 0 (0.0%) |
| 18 to 34 Years | 0 (0.0%) | 0 (0.0%) |
| 35 to 64 Years | 9 (4.3%) | 8 (4.1%) |
| 65 to 74 Years | 0 (0.0%) | 6 (6.5%) |
| 75 Years and over | 4 (6.1%) | 3 (5.9%) |
Disability Class: Cognitive Difficulty
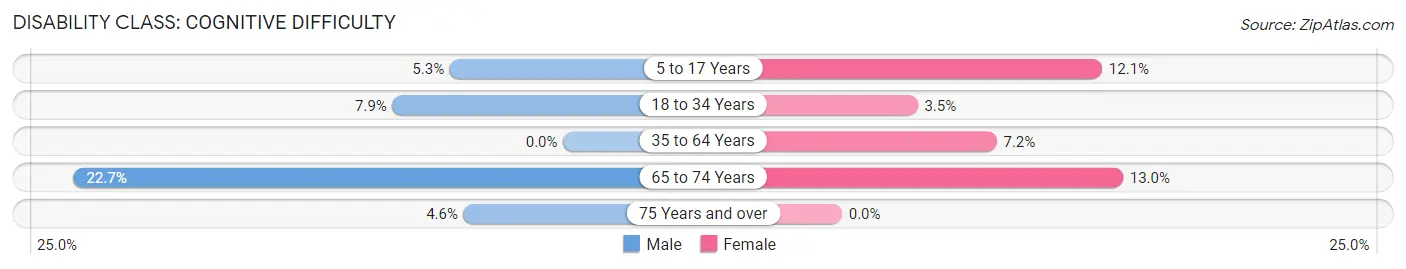
| Age Bracket | Male | Female |
| 5 to 17 Years | 3 (5.3%) | 7 (12.1%) |
| 18 to 34 Years | 8 (7.9%) | 4 (3.5%) |
| 35 to 64 Years | 0 (0.0%) | 14 (7.2%) |
| 65 to 74 Years | 10 (22.7%) | 12 (13.0%) |
| 75 Years and over | 3 (4.6%) | 0 (0.0%) |
Disability Class: Ambulatory Difficulty
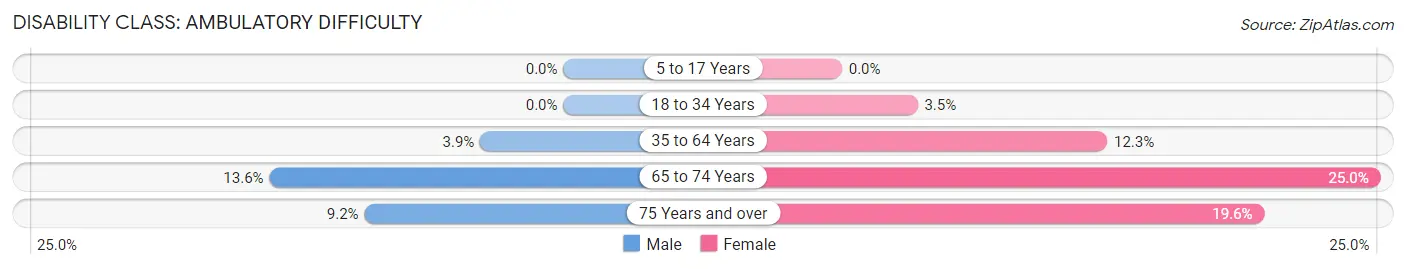
| Age Bracket | Male | Female |
| 5 to 17 Years | 0 (0.0%) | 0 (0.0%) |
| 18 to 34 Years | 0 (0.0%) | 4 (3.5%) |
| 35 to 64 Years | 8 (3.9%) | 24 (12.3%) |
| 65 to 74 Years | 6 (13.6%) | 23 (25.0%) |
| 75 Years and over | 6 (9.2%) | 10 (19.6%) |
Disability Class: Self-Care Difficulty
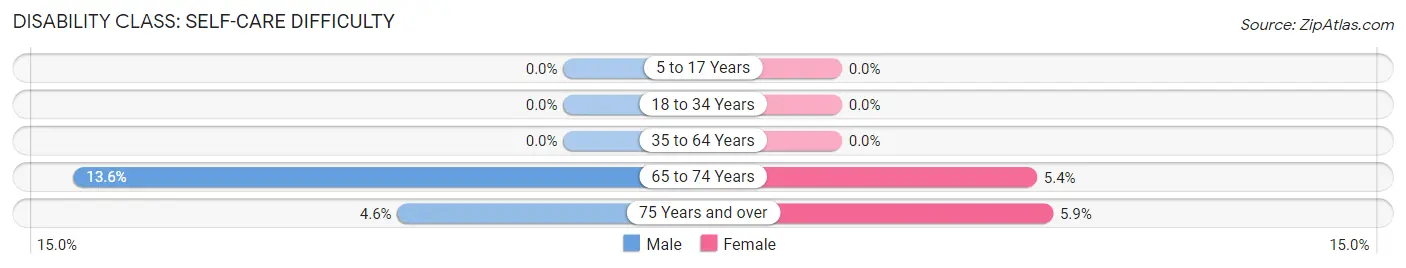
| Age Bracket | Male | Female |
| 5 to 17 Years | 0 (0.0%) | 0 (0.0%) |
| 18 to 34 Years | 0 (0.0%) | 0 (0.0%) |
| 35 to 64 Years | 0 (0.0%) | 0 (0.0%) |
| 65 to 74 Years | 6 (13.6%) | 5 (5.4%) |
| 75 Years and over | 3 (4.6%) | 3 (5.9%) |
Technology Access in Hampton borough
Computing Device Access in Hampton borough
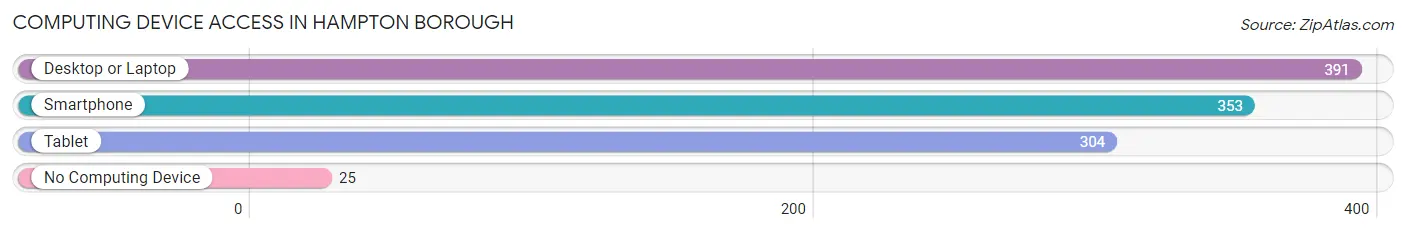
| Device Type | # Households | % Households |
| Desktop or Laptop | 391 | 80.4% |
| Smartphone | 353 | 72.6% |
| Tablet | 304 | 62.5% |
| No Computing Device | 25 | 5.1% |
| Total | 486 | 100.0% |
Internet Access in Hampton borough
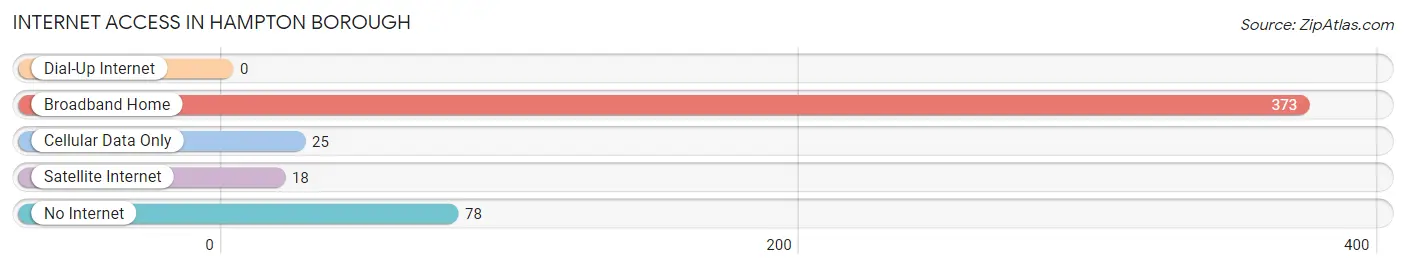
| Internet Type | # Households | % Households |
| Dial-Up Internet | 0 | 0.0% |
| Broadband Home | 373 | 76.7% |
| Cellular Data Only | 25 | 5.1% |
| Satellite Internet | 18 | 3.7% |
| No Internet | 78 | 16.1% |
| Total | 486 | 100.0% |
Hampton borough Summary
Hampton Borough is a small borough located in Hunterdon County, New Jersey. It is situated in the northwest corner of the county, and is bordered by the townships of Alexandria, Bethlehem, Franklin, and Union. The borough was incorporated in 1891, and is home to approximately 1,400 residents.
Geography
Hampton Borough is located in the northwest corner of Hunterdon County, New Jersey. It is bordered by the townships of Alexandria, Bethlehem, Franklin, and Union. The borough is situated on the banks of the Musconetcong River, and is surrounded by rolling hills and farmland. The borough covers an area of 1.2 square miles, and is home to approximately 1,400 residents.
The climate in Hampton Borough is typical of the northeastern United States, with cold winters and warm summers. The average annual temperature is around 50 degrees Fahrenheit, and the average annual precipitation is around 40 inches.
Demographics
As of the 2010 census, there were 1,400 people, 545 households, and 393 families residing in the borough. The population density was 1,167.7 people per square mile. The racial makeup of the borough was 97.4% White, 0.6% African American, 0.1% Native American, 0.6% Asian, 0.1% from other races, and 1.2% from two or more races. Hispanic or Latino of any race were 1.6% of the population.
The median age in the borough was 44.7 years. About 24.6% of residents were under the age of 18, 5.3% were between the ages of 18 and 24, 24.6% were from 25 to 44, 33.3% were from 45 to 64, and 12.2% were 65 years of age or older. The gender makeup of the borough was 48.6% male and 51.4% female.
Economy
The economy of Hampton Borough is largely based on agriculture and tourism. The borough is home to several farms, which produce a variety of crops, including corn, soybeans, hay, and vegetables. The borough is also home to several wineries, which attract tourists from all over the region.
In addition to agriculture and tourism, the borough is home to several small businesses, including restaurants, retail stores, and professional services. The borough is also home to several manufacturing companies, which produce a variety of products, including furniture, clothing, and electronics.
Conclusion
Hampton Borough is a small borough located in Hunterdon County, New Jersey. It is situated in the northwest corner of the county, and is bordered by the townships of Alexandria, Bethlehem, Franklin, and Union. The borough was incorporated in 1891, and is home to approximately 1,400 residents. The economy of Hampton Borough is largely based on agriculture and tourism, and the borough is home to several small businesses, including restaurants, retail stores, and professional services. The borough is also home to several manufacturing companies, which produce a variety of products.
Common Questions
What is Per Capita Income in Hampton borough?
Per Capita income in Hampton borough is $50,459.
What is the Median Family Income in Hampton borough?
Median Family Income in Hampton borough is $119,583.
What is the Median Household income in Hampton borough?
Median Household Income in Hampton borough is $74,833.
What is Income or Wage Gap in Hampton borough?
Income or Wage Gap in Hampton borough is 44.8%.
Women in Hampton borough earn 55.2 cents for every dollar earned by a man.
What is Inequality or Gini Index in Hampton borough?
Inequality or Gini Index in Hampton borough is 0.51.
What is the Total Population of Hampton borough?
Total Population of Hampton borough is 1,064.
What is the Total Male Population of Hampton borough?
Total Male Population of Hampton borough is 509.
What is the Total Female Population of Hampton borough?
Total Female Population of Hampton borough is 555.
What is the Ratio of Males per 100 Females in Hampton borough?
There are 91.71 Males per 100 Females in Hampton borough.
What is the Ratio of Females per 100 Males in Hampton borough?
There are 109.04 Females per 100 Males in Hampton borough.
What is the Median Population Age in Hampton borough?
Median Population Age in Hampton borough is 44.3 Years.
What is the Average Family Size in Hampton borough
Average Family Size in Hampton borough is 2.8 People.
What is the Average Household Size in Hampton borough
Average Household Size in Hampton borough is 2.2 People.
How Large is the Labor Force in Hampton borough?
There are 527 People in the Labor Forcein in Hampton borough.
What is the Percentage of People in the Labor Force in Hampton borough?
59.6% of People are in the Labor Force in Hampton borough.
What is the Unemployment Rate in Hampton borough?
Unemployment Rate in Hampton borough is 4.7%.