Cities with the Highest Percentage of Immigrants from Jordan in New Jersey
RELATED REPORTS & OPTIONS
Jordan
New Jersey
Compare Cities
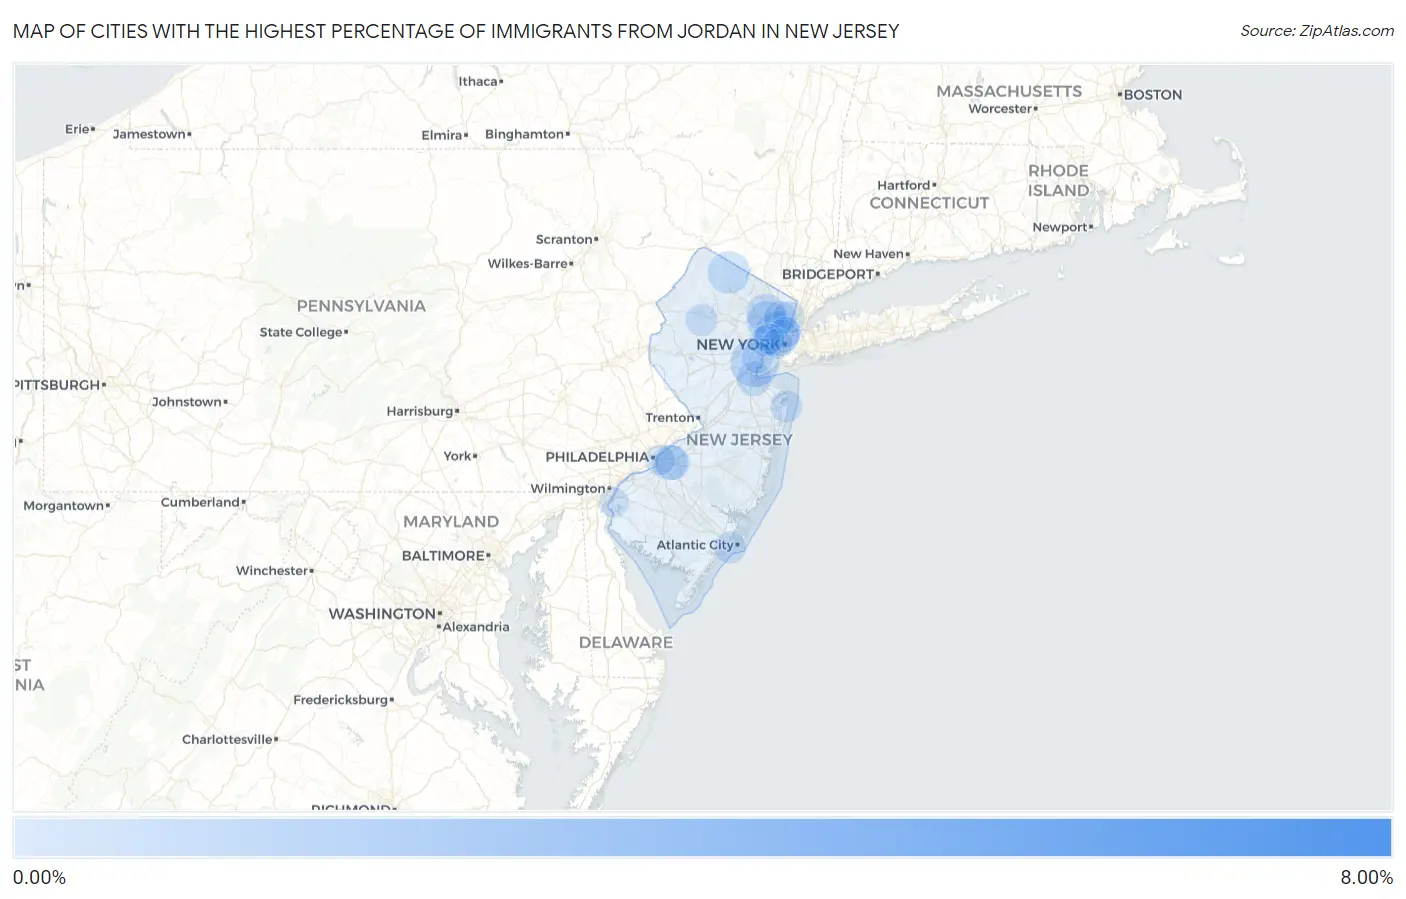
Map of Cities with the Highest Percentage of Immigrants from Jordan in New Jersey
0.00%
8.00%
Cities with the Highest Percentage of Immigrants from Jordan in New Jersey
| City | Jordan | vs State | vs National | |
| 1. | Teterboro Borough | 7.69% | 0.048%(+7.64)#-1 | 0.027%(+7.67)#0 |
| 2. | Bloomingdale Borough | 2.76% | 0.048%(+2.71)#0 | 0.027%(+2.73)#1 |
| 3. | Woodland Park Borough | 2.54% | 0.048%(+2.49)#21 | 0.027%(+2.51)#101 |
| 4. | Paulsboro Borough | 1.28% | 0.048%(+1.23)#22 | 0.027%(+1.25)#102 |
| 5. | Mount Hope | 1.26% | 0.048%(+1.21)#23 | 0.027%(+1.23)#103 |
| 6. | Macopin | 1.02% | 0.048%(+0.968)#24 | 0.027%(+0.989)#104 |
| 7. | Prospect Park Borough | 0.87% | 0.048%(+0.826)#25 | 0.027%(+0.847)#105 |
| 8. | Avenel | 0.83% | 0.048%(+0.783)#26 | 0.027%(+0.804)#106 |
| 9. | Bradley Beach Borough | 0.70% | 0.048%(+0.655)#27 | 0.027%(+0.676)#107 |
| 10. | Preakness | 0.68% | 0.048%(+0.636)#28 | 0.027%(+0.657)#108 |
| 11. | Secaucus | 0.66% | 0.048%(+0.614)#29 | 0.027%(+0.635)#109 |
| 12. | Hawthorne Borough | 0.57% | 0.048%(+0.518)#30 | 0.027%(+0.539)#110 |
| 13. | Vernon Center | 0.54% | 0.048%(+0.488)#31 | 0.027%(+0.509)#111 |
| 14. | Hasbrouck Heights Borough | 0.50% | 0.048%(+0.457)#32 | 0.027%(+0.478)#112 |
| 15. | Clifton | 0.45% | 0.048%(+0.402)#43 | 0.027%(+0.423)#303 |
| 16. | Paterson | 0.43% | 0.048%(+0.378)#44 | 0.027%(+0.399)#304 |
| 17. | Totowa Borough | 0.41% | 0.048%(+0.362)#45 | 0.027%(+0.383)#305 |
| 18. | Watchung Borough | 0.33% | 0.048%(+0.280)#46 | 0.027%(+0.301)#306 |
| 19. | East Rutherford Borough | 0.32% | 0.048%(+0.272)#47 | 0.027%(+0.293)#307 |
| 20. | Atlantic Highlands Borough | 0.29% | 0.048%(+0.247)#48 | 0.027%(+0.268)#308 |
| 21. | Lake Hopatcong | 0.25% | 0.048%(+0.201)#49 | 0.027%(+0.221)#309 |
| 22. | South Toms River Borough | 0.25% | 0.048%(+0.198)#50 | 0.027%(+0.219)#310 |
| 23. | Ellisburg | 0.24% | 0.048%(+0.190)#51 | 0.027%(+0.211)#311 |
| 24. | Little Ferry Borough | 0.23% | 0.048%(+0.181)#52 | 0.027%(+0.202)#312 |
| 25. | Pine Brook | 0.21% | 0.048%(+0.164)#53 | 0.027%(+0.185)#313 |
| 26. | South Amboy | 0.20% | 0.048%(+0.156)#54 | 0.027%(+0.177)#314 |
| 27. | Kingston Estates | 0.20% | 0.048%(+0.152)#55 | 0.027%(+0.173)#315 |
| 28. | Ogdensburg Borough | 0.18% | 0.048%(+0.133)#56 | 0.027%(+0.154)#316 |
| 29. | Fair Lawn Borough | 0.17% | 0.048%(+0.121)#57 | 0.027%(+0.142)#317 |
| 30. | Demarest Borough | 0.16% | 0.048%(+0.115)#58 | 0.027%(+0.136)#318 |
| 31. | Sayreville Borough | 0.15% | 0.048%(+0.105)#59 | 0.027%(+0.126)#319 |
| 32. | Union City | 0.13% | 0.048%(+0.080)#60 | 0.027%(+0.101)#320 |
| 33. | Franklin Lakes Borough | 0.12% | 0.048%(+0.071)#61 | 0.027%(+0.092)#321 |
| 34. | Hackensack | 0.12% | 0.048%(+0.070)#62 | 0.027%(+0.091)#322 |
| 35. | Bogota Borough | 0.11% | 0.048%(+0.064)#63 | 0.027%(+0.085)#323 |
| 36. | Palisades Park Borough | 0.11% | 0.048%(+0.061)#64 | 0.027%(+0.082)#324 |
| 37. | Englewood | 0.100% | 0.048%(+0.052)#65 | 0.027%(+0.073)#325 |
| 38. | South Plainfield Borough | 0.099% | 0.048%(+0.051)#66 | 0.027%(+0.072)#326 |
| 39. | Long Branch | 0.091% | 0.048%(+0.043)#67 | 0.027%(+0.064)#327 |
| 40. | Budd Lake | 0.090% | 0.048%(+0.043)#68 | 0.027%(+0.064)#328 |
| 41. | Ventnor City | 0.086% | 0.048%(+0.039)#69 | 0.027%(+0.060)#329 |
| 42. | Linden | 0.083% | 0.048%(+0.035)#70 | 0.027%(+0.056)#330 |
| 43. | Kinnelon Borough | 0.080% | 0.048%(+0.033)#71 | 0.027%(+0.054)#331 |
| 44. | Fort Lee Borough | 0.078% | 0.048%(+0.030)#72 | 0.027%(+0.051)#332 |
| 45. | Maywood Borough | 0.070% | 0.048%(+0.022)#73 | 0.027%(+0.043)#333 |
| 46. | Lodi Borough | 0.065% | 0.048%(+0.018)#74 | 0.027%(+0.039)#334 |
| 47. | Fairview Borough | 0.054% | 0.048%(+0.006)#75 | 0.027%(+0.027)#335 |
| 48. | West New York | 0.053% | 0.048%(+0.006)#76 | 0.027%(+0.027)#336 |
| 49. | Newark | 0.040% | 0.048%(-0.008)#77 | 0.027%(+0.013)#337 |
| 50. | Cliffside Park Borough | 0.039% | 0.048%(-0.008)#78 | 0.027%(+0.013)#338 |
| 51. | Harrison | 0.031% | 0.048%(-0.016)#79 | 0.027%(+0.005)#339 |
| 52. | Elmwood Park Borough | 0.019% | 0.048%(-0.029)#80 | 0.027%(-0.008)#340 |
| 53. | Jersey City | 0.017% | 0.048%(-0.031)#81 | 0.027%(-0.010)#341 |
| 54. | Pennsville | 0.016% | 0.048%(-0.031)#82 | 0.027%(-0.010)#342 |
| 55. | Bergenfield Borough | 0.014% | 0.048%(-0.033)#83 | 0.027%(-0.012)#343 |
| 56. | Camden | 0.013% | 0.048%(-0.035)#84 | 0.027%(-0.014)#344 |
Common Questions
What are the Top 10 Cities with the Highest Percentage of Immigrants from Jordan in New Jersey?
Top 10 Cities with the Highest Percentage of Immigrants from Jordan in New Jersey are:
#1
0.83%
#2
0.66%
#3
0.54%
#4
0.45%
#5
0.43%
#6
0.24%
#7
0.20%
#8
0.20%
#9
0.13%
#10
0.12%
What city has the Highest Percentage of Immigrants from Jordan in New Jersey?
Avenel has the Highest Percentage of Immigrants from Jordan in New Jersey with 0.83%.
What is the Percentage of Immigrants from Jordan in the State of New Jersey?
Percentage of Immigrants from Jordan in New Jersey is 0.048%.
What is the Percentage of Immigrants from Jordan in the United States?
Percentage of Immigrants from Jordan in the United States is 0.027%.