Cities with the Highest Percentage of Population Employed in Firefighting & Prevention in New Jersey
RELATED REPORTS & OPTIONS
Firefighting & Prevention
New Jersey
Compare Cities
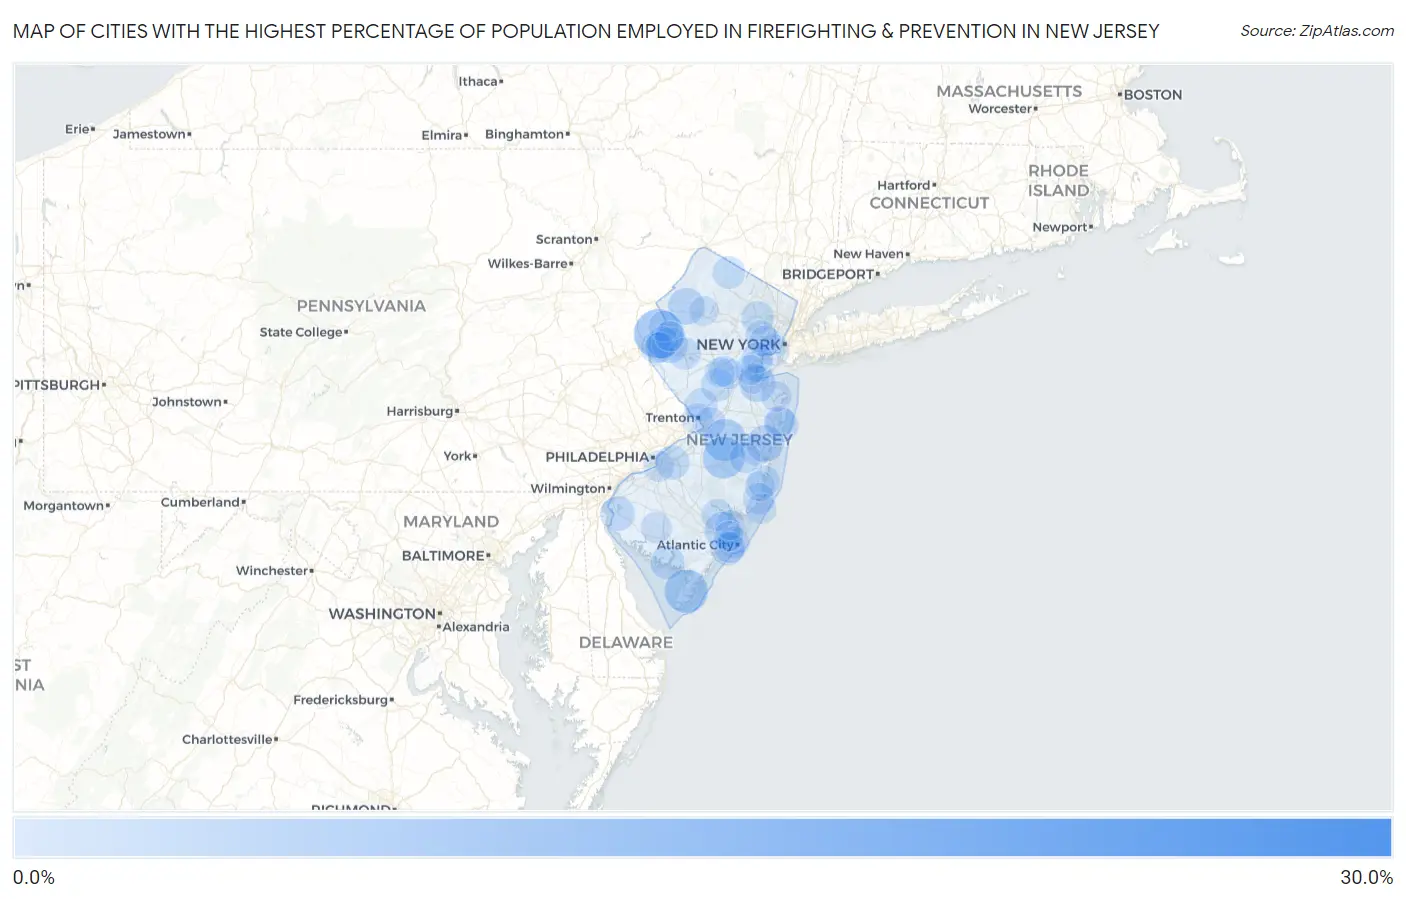
Map of Cities with the Highest Percentage of Population Employed in Firefighting & Prevention in New Jersey
0.0%
30.0%
Cities with the Highest Percentage of Population Employed in Firefighting & Prevention in New Jersey
| City | % Employed | vs State | vs National | |
| 1. | Deerfield Street | 30.0% | 1.3%(+28.7)#1 | 1.2%(+28.8)#55 |
| 2. | Branchville Borough | 19.5% | 1.3%(+18.2)#2 | 1.2%(+18.3)#119 |
| 3. | Pine Beach Borough | 13.4% | 1.3%(+12.1)#3 | 1.2%(+12.2)#259 |
| 4. | Dividing Creek | 13.2% | 1.3%(+11.9)#4 | 1.2%(+12.0)#267 |
| 5. | Union | 12.8% | 1.3%(+11.5)#5 | 1.2%(+11.6)#281 |
| 6. | Hutchinson | 12.3% | 1.3%(+11.0)#6 | 1.2%(+11.1)#299 |
| 7. | Oceanville | 10.6% | 1.3%(+9.31)#7 | 1.2%(+9.45)#389 |
| 8. | Sweetwater | 9.7% | 1.3%(+8.39)#8 | 1.2%(+8.52)#444 |
| 9. | Whitesboro | 9.3% | 1.3%(+7.94)#9 | 1.2%(+8.08)#474 |
| 10. | Pluckemin | 8.7% | 1.3%(+7.38)#10 | 1.2%(+7.51)#536 |
| 11. | New Egypt | 8.6% | 1.3%(+7.30)#11 | 1.2%(+7.43)#540 |
| 12. | Country Lake Estates | 8.6% | 1.3%(+7.29)#12 | 1.2%(+7.42)#542 |
| 13. | West Park | 8.3% | 1.3%(+6.93)#13 | 1.2%(+7.07)#585 |
| 14. | William Paterson University Of New Jersey | 7.3% | 1.3%(+5.95)#14 | 1.2%(+6.08)#713 |
| 15. | Gouldtown | 6.3% | 1.3%(+5.00)#15 | 1.2%(+5.14)#887 |
| 16. | Leisure Village | 6.0% | 1.3%(+4.69)#16 | 1.2%(+4.83)#954 |
| 17. | Johnsonburg | 5.9% | 1.3%(+4.59)#17 | 1.2%(+4.73)#980 |
| 18. | Shrewsbury Borough | 5.8% | 1.3%(+4.46)#18 | 1.2%(+4.59)#1,020 |
| 19. | Laurence Harbor | 5.7% | 1.3%(+4.40)#19 | 1.2%(+4.54)#1,034 |
| 20. | Pomona | 5.5% | 1.3%(+4.18)#20 | 1.2%(+4.32)#1,096 |
| 21. | English Creek | 5.5% | 1.3%(+4.18)#21 | 1.2%(+4.32)#1,097 |
| 22. | Mount Hope | 5.5% | 1.3%(+4.14)#22 | 1.2%(+4.27)#1,113 |
| 23. | Woodbine Borough | 5.4% | 1.3%(+4.06)#23 | 1.2%(+4.19)#1,138 |
| 24. | Asbury | 5.3% | 1.3%(+3.94)#24 | 1.2%(+4.08)#1,184 |
| 25. | Goshen | 5.0% | 1.3%(+3.71)#25 | 1.2%(+3.84)#1,263 |
| 26. | West Belmar | 4.7% | 1.3%(+3.35)#26 | 1.2%(+3.49)#1,411 |
| 27. | Salem | 4.6% | 1.3%(+3.33)#27 | 1.2%(+3.46)#1,425 |
| 28. | Port Norris | 4.6% | 1.3%(+3.26)#28 | 1.2%(+3.40)#1,452 |
| 29. | Silver Lake Cdp Essex County | 4.6% | 1.3%(+3.24)#29 | 1.2%(+3.37)#1,465 |
| 30. | Kingston Estates | 4.5% | 1.3%(+3.19)#30 | 1.2%(+3.32)#1,497 |
| 31. | Othello | 4.4% | 1.3%(+3.13)#31 | 1.2%(+3.26)#1,526 |
| 32. | Sheppards Mill | 4.4% | 1.3%(+3.13)#32 | 1.2%(+3.26)#1,529 |
| 33. | Mount Tabor | 4.4% | 1.3%(+3.05)#33 | 1.2%(+3.18)#1,579 |
| 34. | Margate City | 4.2% | 1.3%(+2.92)#34 | 1.2%(+3.05)#1,651 |
| 35. | Millington | 4.1% | 1.3%(+2.78)#35 | 1.2%(+2.91)#1,724 |
| 36. | Griggstown | 4.0% | 1.3%(+2.73)#36 | 1.2%(+2.86)#1,760 |
| 37. | Lawrenceville | 4.0% | 1.3%(+2.71)#37 | 1.2%(+2.84)#1,774 |
| 38. | Singac | 4.0% | 1.3%(+2.70)#38 | 1.2%(+2.83)#1,784 |
| 39. | Paulsboro Borough | 4.0% | 1.3%(+2.67)#39 | 1.2%(+2.80)#1,808 |
| 40. | Marmora | 3.9% | 1.3%(+2.60)#40 | 1.2%(+2.73)#1,839 |
| 41. | Allentown Borough | 3.9% | 1.3%(+2.56)#41 | 1.2%(+2.69)#1,868 |
| 42. | Farmingdale Borough | 3.8% | 1.3%(+2.49)#42 | 1.2%(+2.63)#1,920 |
| 43. | Waretown | 3.7% | 1.3%(+2.39)#43 | 1.2%(+2.52)#2,004 |
| 44. | Vernon Center | 3.7% | 1.3%(+2.37)#44 | 1.2%(+2.51)#2,032 |
| 45. | Merchantville Borough | 3.7% | 1.3%(+2.37)#45 | 1.2%(+2.50)#2,037 |
| 46. | Port Reading | 3.7% | 1.3%(+2.34)#46 | 1.2%(+2.47)#2,056 |
| 47. | Greenwich | 3.6% | 1.3%(+2.30)#47 | 1.2%(+2.44)#2,092 |
| 48. | New Village | 3.6% | 1.3%(+2.25)#48 | 1.2%(+2.39)#2,140 |
| 49. | Park Ridge Borough | 3.5% | 1.3%(+2.23)#49 | 1.2%(+2.36)#2,165 |
| 50. | Spring Lake Heights Borough | 3.5% | 1.3%(+2.22)#50 | 1.2%(+2.35)#2,169 |
| 51. | Egg Harbor City | 3.5% | 1.3%(+2.18)#51 | 1.2%(+2.32)#2,201 |
| 52. | Annandale | 3.5% | 1.3%(+2.18)#52 | 1.2%(+2.32)#2,203 |
| 53. | Bedminster | 3.5% | 1.3%(+2.16)#53 | 1.2%(+2.29)#2,229 |
| 54. | Keasbey | 3.4% | 1.3%(+2.10)#54 | 1.2%(+2.23)#2,289 |
| 55. | Mckee | 3.4% | 1.3%(+2.06)#55 | 1.2%(+2.20)#2,336 |
| 56. | Bayonne | 3.3% | 1.3%(+2.02)#56 | 1.2%(+2.15)#2,370 |
| 57. | Beach Haven West | 3.3% | 1.3%(+2.01)#57 | 1.2%(+2.14)#2,390 |
| 58. | Carlls Corner | 3.3% | 1.3%(+1.97)#58 | 1.2%(+2.10)#2,424 |
| 59. | East Orange | 3.3% | 1.3%(+1.96)#59 | 1.2%(+2.10)#2,432 |
| 60. | Pine Lake Park | 3.2% | 1.3%(+1.92)#60 | 1.2%(+2.05)#2,500 |
| 61. | Mickleton | 3.2% | 1.3%(+1.91)#61 | 1.2%(+2.04)#2,502 |
| 62. | Atlantic City | 3.2% | 1.3%(+1.90)#62 | 1.2%(+2.04)#2,517 |
| 63. | Peapack And Gladstone Borough | 3.2% | 1.3%(+1.89)#63 | 1.2%(+2.02)#2,533 |
| 64. | Rosenhayn | 3.2% | 1.3%(+1.84)#64 | 1.2%(+1.97)#2,576 |
| 65. | Newark | 3.1% | 1.3%(+1.81)#65 | 1.2%(+1.94)#2,603 |
| 66. | Glassboro Borough | 3.1% | 1.3%(+1.78)#66 | 1.2%(+1.91)#2,631 |
| 67. | Belmar Borough | 3.1% | 1.3%(+1.75)#67 | 1.2%(+1.88)#2,682 |
| 68. | Whippany | 3.0% | 1.3%(+1.73)#68 | 1.2%(+1.86)#2,701 |
| 69. | Gloucester City | 3.0% | 1.3%(+1.72)#69 | 1.2%(+1.86)#2,708 |
| 70. | Menlo Park Terrace | 3.0% | 1.3%(+1.72)#70 | 1.2%(+1.85)#2,715 |
| 71. | Trenton | 3.0% | 1.3%(+1.72)#71 | 1.2%(+1.85)#2,716 |
| 72. | Helmetta Borough | 3.0% | 1.3%(+1.71)#72 | 1.2%(+1.84)#2,723 |
| 73. | Yardville | 3.0% | 1.3%(+1.69)#73 | 1.2%(+1.82)#2,752 |
| 74. | Ventnor City | 3.0% | 1.3%(+1.68)#74 | 1.2%(+1.81)#2,767 |
| 75. | Avon By The Sea Borough | 3.0% | 1.3%(+1.67)#75 | 1.2%(+1.80)#2,791 |
| 76. | Crestwood Village | 3.0% | 1.3%(+1.65)#76 | 1.2%(+1.79)#2,818 |
| 77. | Linden | 3.0% | 1.3%(+1.65)#77 | 1.2%(+1.79)#2,823 |
| 78. | Carteret Borough | 2.9% | 1.3%(+1.61)#78 | 1.2%(+1.74)#2,884 |
| 79. | North Arlington Borough | 2.9% | 1.3%(+1.58)#79 | 1.2%(+1.71)#2,910 |
| 80. | Shark River Hills | 2.8% | 1.3%(+1.52)#80 | 1.2%(+1.65)#2,992 |
| 81. | South Amboy | 2.8% | 1.3%(+1.48)#81 | 1.2%(+1.61)#3,048 |
| 82. | North Beach Haven | 2.8% | 1.3%(+1.46)#82 | 1.2%(+1.59)#3,071 |
| 83. | Fairview | 2.8% | 1.3%(+1.45)#83 | 1.2%(+1.59)#3,087 |
| 84. | Belvidere | 2.8% | 1.3%(+1.44)#84 | 1.2%(+1.58)#3,100 |
| 85. | Somerset | 2.8% | 1.3%(+1.44)#85 | 1.2%(+1.57)#3,103 |
| 86. | Franklin Center | 2.8% | 1.3%(+1.43)#86 | 1.2%(+1.57)#3,115 |
| 87. | Lower Berkshire Valley | 2.7% | 1.3%(+1.37)#87 | 1.2%(+1.50)#3,215 |
| 88. | Emerson Borough | 2.7% | 1.3%(+1.35)#88 | 1.2%(+1.49)#3,236 |
| 89. | Pines Lake | 2.7% | 1.3%(+1.33)#89 | 1.2%(+1.47)#3,264 |
| 90. | Barnegat | 2.6% | 1.3%(+1.32)#90 | 1.2%(+1.45)#3,286 |
| 91. | Smithville | 2.6% | 1.3%(+1.31)#91 | 1.2%(+1.44)#3,302 |
| 92. | Stockton University | 2.6% | 1.3%(+1.31)#92 | 1.2%(+1.44)#3,309 |
| 93. | Washington Borough | 2.6% | 1.3%(+1.28)#93 | 1.2%(+1.41)#3,367 |
| 94. | Stewartsville | 2.6% | 1.3%(+1.27)#94 | 1.2%(+1.40)#3,382 |
| 95. | Cedar Knolls | 2.6% | 1.3%(+1.27)#95 | 1.2%(+1.40)#3,388 |
| 96. | Brass Castle | 2.6% | 1.3%(+1.26)#96 | 1.2%(+1.39)#3,399 |
| 97. | Byram Center | 2.6% | 1.3%(+1.25)#97 | 1.2%(+1.39)#3,407 |
| 98. | Absecon | 2.6% | 1.3%(+1.25)#98 | 1.2%(+1.38)#3,418 |
| 99. | Weston | 2.6% | 1.3%(+1.24)#99 | 1.2%(+1.37)#3,437 |
| 100. | Fords | 2.5% | 1.3%(+1.22)#100 | 1.2%(+1.36)#3,463 |
Common Questions
What are the Top 10 Cities with the Highest Percentage of Population Employed in Firefighting & Prevention in New Jersey?
Top 10 Cities with the Highest Percentage of Population Employed in Firefighting & Prevention in New Jersey are:
#1
12.3%
#2
9.3%
#3
8.6%
#4
8.6%
#5
6.0%
#6
5.9%
#7
5.7%
#8
5.5%
#9
5.3%
#10
4.7%
What city has the Highest Percentage of Population Employed in Firefighting & Prevention in New Jersey?
Hutchinson has the Highest Percentage of Population Employed in Firefighting & Prevention in New Jersey with 12.3%.
What is the Percentage of Population Employed in Firefighting & Prevention in the State of New Jersey?
Percentage of Population Employed in Firefighting & Prevention in New Jersey is 1.3%.
What is the Percentage of Population Employed in Firefighting & Prevention in the United States?
Percentage of Population Employed in Firefighting & Prevention in the United States is 1.2%.