Cities with the Highest Percentage of Immigrants from South Central Asia in New Jersey
RELATED REPORTS & OPTIONS
South Central Asia
New Jersey
Compare Cities
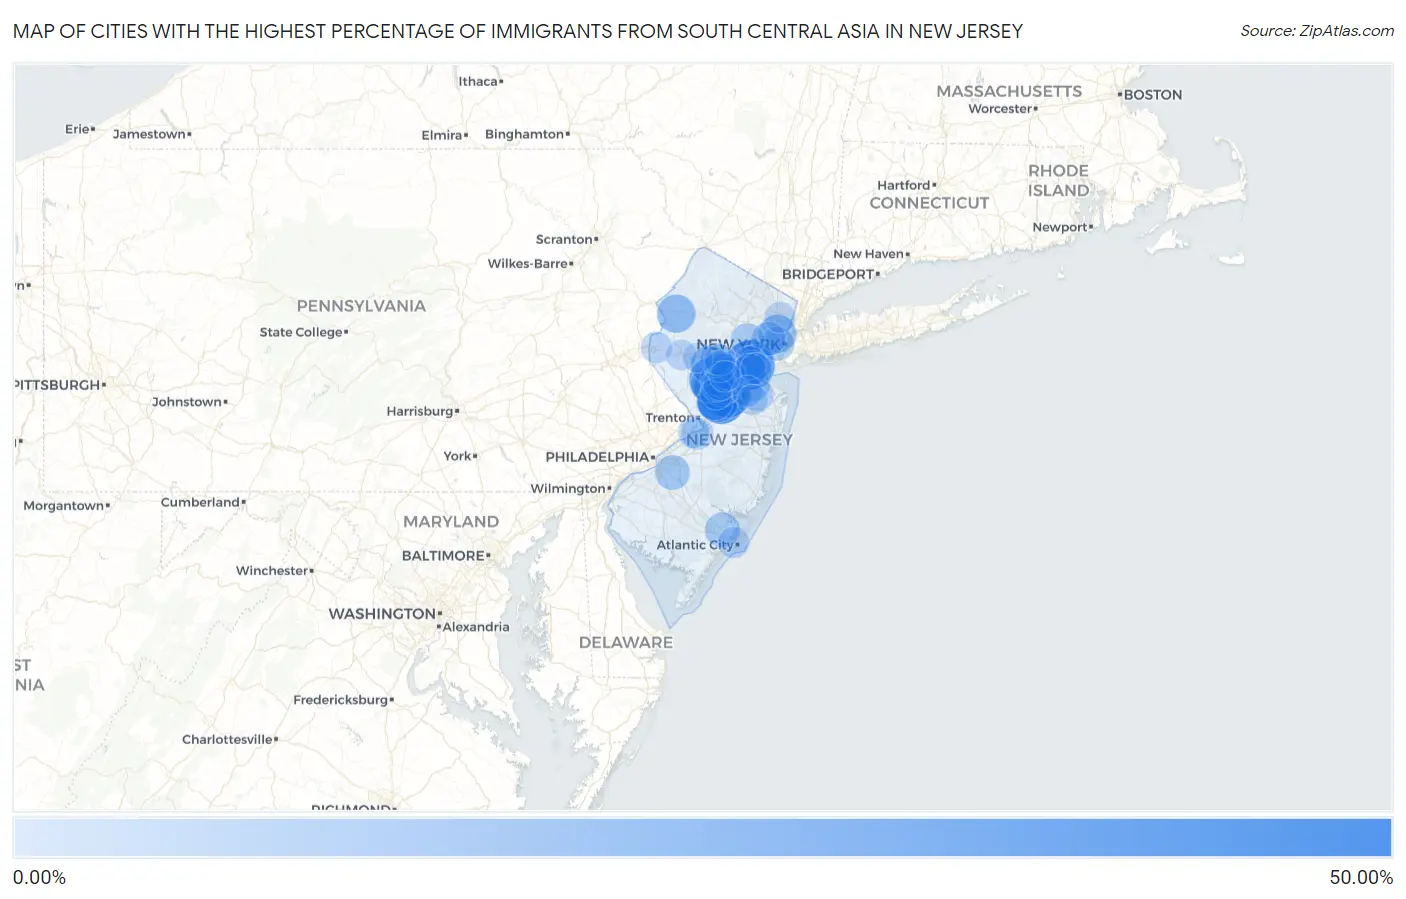
Map of Cities with the Highest Percentage of Immigrants from South Central Asia in New Jersey
0.00%
50.00%
Cities with the Highest Percentage of Immigrants from South Central Asia in New Jersey
| City | South Central Asia | vs State | vs National | |
| 1. | Monroe Manor | 41.58% | 3.62%(+38.0)#1 | 1.31%(+40.3)#2 |
| 2. | Deans | 39.37% | 3.62%(+35.8)#2 | 1.31%(+38.1)#3 |
| 3. | Iselin | 38.78% | 3.62%(+35.2)#3 | 1.31%(+37.5)#4 |
| 4. | Ten Mile Run | 37.30% | 3.62%(+33.7)#4 | 1.31%(+36.0)#5 |
| 5. | Forsgate | 36.48% | 3.62%(+32.9)#5 | 1.31%(+35.2)#7 |
| 6. | Princeton Meadows | 35.86% | 3.62%(+32.2)#6 | 1.31%(+34.6)#8 |
| 7. | Heathcote | 33.47% | 3.62%(+29.9)#7 | 1.31%(+32.2)#10 |
| 8. | Monmouth Junction | 33.22% | 3.62%(+29.6)#8 | 1.31%(+31.9)#12 |
| 9. | Dayton | 31.85% | 3.62%(+28.2)#9 | 1.31%(+30.5)#14 |
| 10. | Belle Mead | 29.66% | 3.62%(+26.0)#10 | 1.31%(+28.3)#16 |
| 11. | Parsippany | 25.96% | 3.62%(+22.3)#11 | 1.31%(+24.7)#20 |
| 12. | Troy Hills | 25.72% | 3.62%(+22.1)#12 | 1.31%(+24.4)#21 |
| 13. | Plainsboro Center | 24.48% | 3.62%(+20.9)#13 | 1.31%(+23.2)#23 |
| 14. | Franklin Park | 21.92% | 3.62%(+18.3)#14 | 1.31%(+20.6)#28 |
| 15. | Lake Hiawatha | 21.34% | 3.62%(+17.7)#15 | 1.31%(+20.0)#31 |
| 16. | Weston | 20.15% | 3.62%(+16.5)#16 | 1.31%(+18.8)#34 |
| 17. | Hope | 18.72% | 3.62%(+15.1)#17 | 1.31%(+17.4)#42 |
| 18. | Harlingen | 18.65% | 3.62%(+15.0)#18 | 1.31%(+17.3)#44 |
| 19. | Bradley Gardens | 18.60% | 3.62%(+15.0)#19 | 1.31%(+17.3)#45 |
| 20. | Secaucus | 17.78% | 3.62%(+14.2)#20 | 1.31%(+16.5)#50 |
| 21. | Menlo Park Terrace | 16.62% | 3.62%(+13.0)#21 | 1.31%(+15.3)#57 |
| 22. | Carteret Borough | 16.00% | 3.62%(+12.4)#22 | 1.31%(+14.7)#63 |
| 23. | Six Mile Run | 15.87% | 3.62%(+12.2)#23 | 1.31%(+14.6)#65 |
| 24. | Robbinsville Center | 13.85% | 3.62%(+10.2)#24 | 1.31%(+12.5)#92 |
| 25. | Kendall Park | 13.44% | 3.62%(+9.82)#25 | 1.31%(+12.1)#96 |
| 26. | Princeton Junction | 13.40% | 3.62%(+9.78)#26 | 1.31%(+12.1)#97 |
| 27. | Avenel | 13.26% | 3.62%(+9.64)#27 | 1.31%(+12.0)#101 |
| 28. | Madison Park | 12.81% | 3.62%(+9.19)#28 | 1.31%(+11.5)#111 |
| 29. | Pomona | 12.68% | 3.62%(+9.06)#29 | 1.31%(+11.4)#113 |
| 30. | Franklin Center | 12.61% | 3.62%(+8.99)#30 | 1.31%(+11.3)#115 |
| 31. | Echelon | 12.16% | 3.62%(+8.54)#31 | 1.31%(+10.9)#125 |
| 32. | Voorhees | 11.68% | 3.62%(+8.06)#32 | 1.31%(+10.4)#136 |
| 33. | Woodbridge | 11.48% | 3.62%(+7.86)#33 | 1.31%(+10.2)#142 |
| 34. | Blackwells Mills | 11.14% | 3.62%(+7.52)#34 | 1.31%(+9.83)#151 |
| 35. | Jersey City | 10.89% | 3.62%(+7.27)#35 | 1.31%(+9.58)#156 |
| 36. | The Hills | 10.67% | 3.62%(+7.05)#36 | 1.31%(+9.36)#161 |
| 37. | Pine Brook | 10.49% | 3.62%(+6.87)#37 | 1.31%(+9.18)#165 |
| 38. | Harrison | 10.34% | 3.62%(+6.72)#38 | 1.31%(+9.03)#171 |
| 39. | Short Hills | 10.17% | 3.62%(+6.55)#39 | 1.31%(+8.87)#175 |
| 40. | Sayreville Borough | 9.94% | 3.62%(+6.32)#40 | 1.31%(+8.63)#180 |
| 41. | Hopelawn | 9.45% | 3.62%(+5.83)#41 | 1.31%(+8.14)#190 |
| 42. | Griggstown | 9.35% | 3.62%(+5.73)#42 | 1.31%(+8.04)#194 |
| 43. | Pleasant Plains | 9.33% | 3.62%(+5.71)#43 | 1.31%(+8.03)#195 |
| 44. | Colonia | 8.85% | 3.62%(+5.23)#44 | 1.31%(+7.54)#211 |
| 45. | West Berlin | 8.84% | 3.62%(+5.22)#45 | 1.31%(+7.53)#213 |
| 46. | South Plainfield Borough | 8.68% | 3.62%(+5.06)#46 | 1.31%(+7.37)#220 |
| 47. | Hillsborough | 8.64% | 3.62%(+5.02)#47 | 1.31%(+7.34)#222 |
| 48. | Morganville | 8.52% | 3.62%(+4.90)#48 | 1.31%(+7.21)#226 |
| 49. | New Vernon | 8.52% | 3.62%(+4.89)#49 | 1.31%(+7.21)#227 |
| 50. | Somerset | 8.50% | 3.62%(+4.88)#50 | 1.31%(+7.19)#229 |
| 51. | Fords | 8.48% | 3.62%(+4.86)#51 | 1.31%(+7.17)#232 |
| 52. | Paramus Borough | 8.42% | 3.62%(+4.80)#52 | 1.31%(+7.11)#235 |
| 53. | East Rutherford Borough | 8.29% | 3.62%(+4.67)#53 | 1.31%(+6.99)#241 |
| 54. | Roebling | 7.60% | 3.62%(+3.98)#54 | 1.31%(+6.29)#269 |
| 55. | Green Knoll | 7.29% | 3.62%(+3.67)#55 | 1.31%(+5.99)#283 |
| 56. | Middlesex Borough | 7.09% | 3.62%(+3.47)#56 | 1.31%(+5.78)#295 |
| 57. | Kingston | 6.98% | 3.62%(+3.36)#57 | 1.31%(+5.67)#308 |
| 58. | Buena Borough | 6.71% | 3.62%(+3.08)#58 | 1.31%(+5.40)#323 |
| 59. | Finderne | 6.70% | 3.62%(+3.08)#59 | 1.31%(+5.39)#326 |
| 60. | Highland Park Borough | 6.57% | 3.62%(+2.95)#60 | 1.31%(+5.26)#339 |
| 61. | Sewaren | 6.49% | 3.62%(+2.87)#61 | 1.31%(+5.19)#343 |
| 62. | Florence | 6.48% | 3.62%(+2.86)#62 | 1.31%(+5.17)#345 |
| 63. | Greenwich | 6.45% | 3.62%(+2.83)#63 | 1.31%(+5.15)#347 |
| 64. | Green | 6.44% | 3.62%(+2.82)#64 | 1.31%(+5.13)#349 |
| 65. | Metuchen Borough | 6.06% | 3.62%(+2.44)#65 | 1.31%(+4.75)#379 |
| 66. | Old Bridge | 6.03% | 3.62%(+2.41)#66 | 1.31%(+4.72)#382 |
| 67. | Roselle Park Borough | 5.92% | 3.62%(+2.29)#67 | 1.31%(+4.61)#396 |
| 68. | Martinsville | 5.91% | 3.62%(+2.29)#68 | 1.31%(+4.60)#399 |
| 69. | Atlantic City | 5.89% | 3.62%(+2.27)#69 | 1.31%(+4.58)#400 |
| 70. | High Bridge Borough | 5.86% | 3.62%(+2.24)#70 | 1.31%(+4.56)#404 |
| 71. | Rutherford Borough | 5.82% | 3.62%(+2.20)#71 | 1.31%(+4.51)#413 |
| 72. | Liberty Corner | 5.80% | 3.62%(+2.18)#72 | 1.31%(+4.49)#416 |
| 73. | Edgewater Borough | 5.75% | 3.62%(+2.13)#73 | 1.31%(+4.44)#421 |
| 74. | Cream Ridge | 5.74% | 3.62%(+2.12)#74 | 1.31%(+4.44)#423 |
| 75. | Somerville Borough | 5.72% | 3.62%(+2.10)#75 | 1.31%(+4.41)#427 |
| 76. | Neshanic | 5.66% | 3.62%(+2.04)#76 | 1.31%(+4.35)#435 |
| 77. | Cedar Knolls | 5.55% | 3.62%(+1.93)#77 | 1.31%(+4.24)#449 |
| 78. | Bellmawr Borough | 5.53% | 3.62%(+1.91)#78 | 1.31%(+4.22)#451 |
| 79. | New Milford Borough | 5.50% | 3.62%(+1.87)#79 | 1.31%(+4.19)#455 |
| 80. | Hackensack | 5.39% | 3.62%(+1.77)#80 | 1.31%(+4.08)#469 |
| 81. | New Providence Borough | 5.38% | 3.62%(+1.76)#81 | 1.31%(+4.07)#471 |
| 82. | Clinton | 5.26% | 3.62%(+1.64)#82 | 1.31%(+3.95)#486 |
| 83. | Saddle River Borough | 5.14% | 3.62%(+1.52)#83 | 1.31%(+3.84)#505 |
| 84. | Englewood Cliffs Borough | 5.12% | 3.62%(+1.50)#84 | 1.31%(+3.82)#508 |
| 85. | Neshanic Station | 5.08% | 3.62%(+1.46)#85 | 1.31%(+3.77)#520 |
| 86. | Raritan Borough | 5.04% | 3.62%(+1.41)#86 | 1.31%(+3.73)#524 |
| 87. | Middlebush | 5.00% | 3.62%(+1.37)#87 | 1.31%(+3.69)#530 |
| 88. | Robertsville | 4.85% | 3.62%(+1.23)#88 | 1.31%(+3.54)#555 |
| 89. | Moonachie Borough | 4.75% | 3.62%(+1.13)#89 | 1.31%(+3.44)#565 |
| 90. | Fair Lawn Borough | 4.68% | 3.62%(+1.06)#90 | 1.31%(+3.37)#581 |
| 91. | Caldwell Borough | 4.63% | 3.62%(+1.01)#91 | 1.31%(+3.32)#588 |
| 92. | Ampere North | 4.63% | 3.62%(+1.01)#92 | 1.31%(+3.32)#589 |
| 93. | Bridgewater Center | 4.57% | 3.62%(+0.949)#93 | 1.31%(+3.26)#597 |
| 94. | Alpine Borough | 4.55% | 3.62%(+0.934)#94 | 1.31%(+3.25)#602 |
| 95. | Northvale Borough | 4.53% | 3.62%(+0.909)#95 | 1.31%(+3.22)#603 |
| 96. | Elmwood Park Borough | 4.48% | 3.62%(+0.862)#96 | 1.31%(+3.17)#619 |
| 97. | Wallington Borough | 4.43% | 3.62%(+0.806)#97 | 1.31%(+3.12)#629 |
| 98. | Whippany | 4.42% | 3.62%(+0.801)#98 | 1.31%(+3.11)#630 |
| 99. | Ramapo College Of New Jersey | 4.37% | 3.62%(+0.748)#99 | 1.31%(+3.06)#641 |
| 100. | White House Station | 4.33% | 3.62%(+0.709)#100 | 1.31%(+3.02)#654 |
Common Questions
What are the Top 10 Cities with the Highest Percentage of Immigrants from South Central Asia in New Jersey?
Top 10 Cities with the Highest Percentage of Immigrants from South Central Asia in New Jersey are:
#1
38.78%
#2
37.30%
#3
35.86%
#4
33.47%
#5
33.22%
#6
31.85%
#7
29.66%
#8
24.48%
#9
21.92%
#10
20.15%
What city has the Highest Percentage of Immigrants from South Central Asia in New Jersey?
Iselin has the Highest Percentage of Immigrants from South Central Asia in New Jersey with 38.78%.
What is the Percentage of Immigrants from South Central Asia in the State of New Jersey?
Percentage of Immigrants from South Central Asia in New Jersey is 3.62%.
What is the Percentage of Immigrants from South Central Asia in the United States?
Percentage of Immigrants from South Central Asia in the United States is 1.31%.