Cities with the Most Immigrants from Guatemala in New Jersey
RELATED REPORTS & OPTIONS
Guatemala
New Jersey
Compare Cities
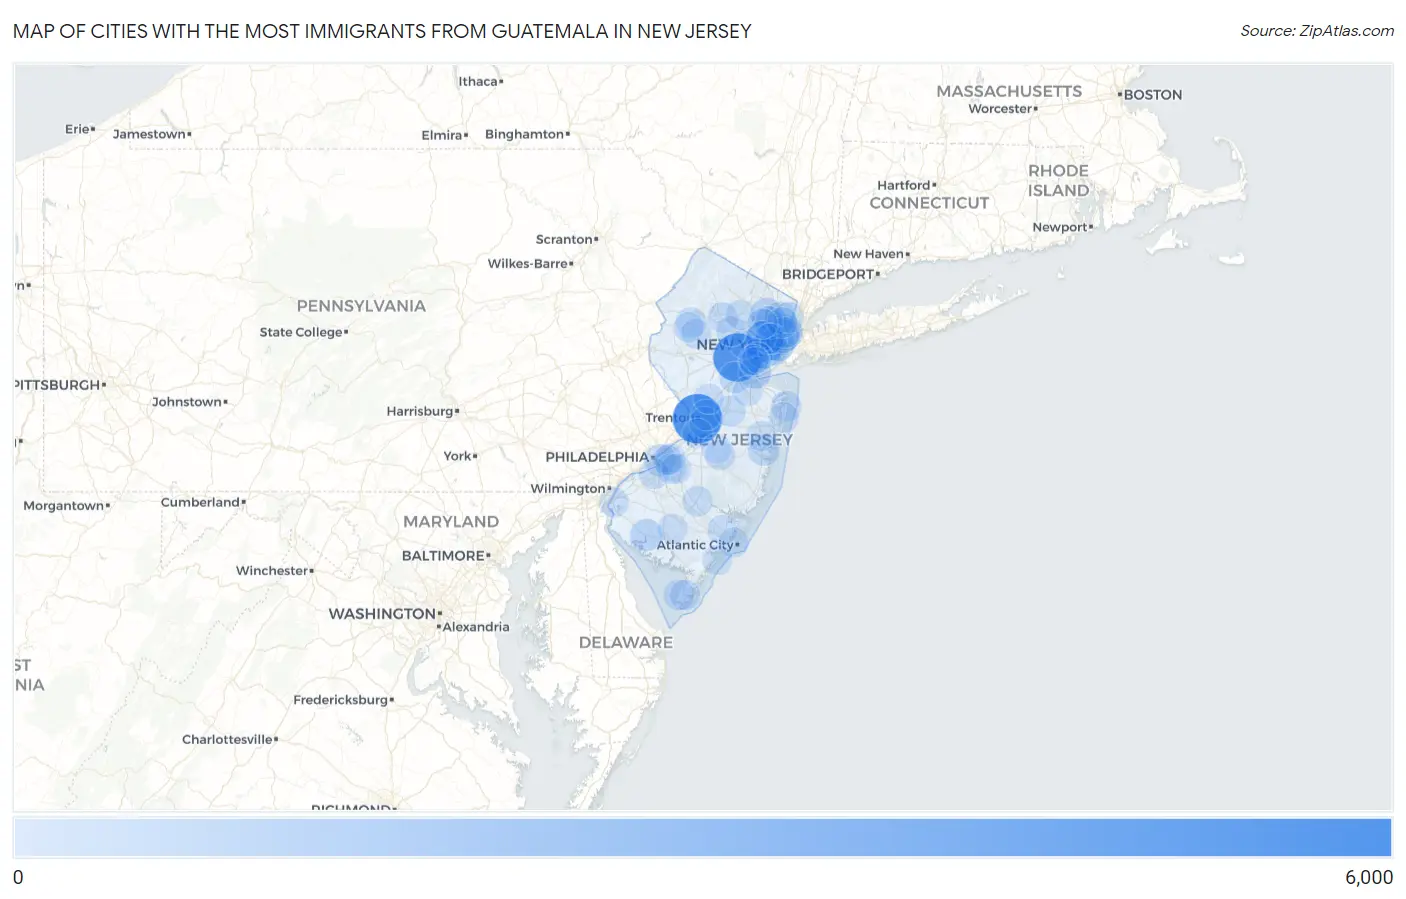
Map of Cities with the Most Immigrants from Guatemala in New Jersey
0
6,000
Cities with the Most Immigrants from Guatemala in New Jersey
| City | Guatemala | vs State | vs National | |
| 1. | Trenton | 5,572 | 46,813(11.90%)#1 | 1,051,999(0.53%)#13 |
| 2. | Plainfield | 5,227 | 46,813(11.17%)#2 | 1,051,999(0.50%)#15 |
| 3. | Newark | 3,033 | 46,813(6.48%)#3 | 1,051,999(0.29%)#32 |
| 4. | West New York | 1,524 | 46,813(3.26%)#4 | 1,051,999(0.14%)#94 |
| 5. | Elizabeth | 1,364 | 46,813(2.91%)#5 | 1,051,999(0.13%)#111 |
| 6. | Jersey City | 1,350 | 46,813(2.88%)#6 | 1,051,999(0.13%)#113 |
| 7. | North Plainfield Borough | 1,321 | 46,813(2.82%)#7 | 1,051,999(0.13%)#114 |
| 8. | Cliffside Park Borough | 1,300 | 46,813(2.78%)#8 | 1,051,999(0.12%)#119 |
| 9. | Fairview Borough | 1,103 | 46,813(2.36%)#9 | 1,051,999(0.10%)#148 |
| 10. | Union City | 1,069 | 46,813(2.28%)#10 | 1,051,999(0.10%)#152 |
| 11. | Palisades Park Borough | 806 | 46,813(1.72%)#11 | 1,051,999(0.08%)#207 |
| 12. | Passaic | 634 | 46,813(1.35%)#12 | 1,051,999(0.06%)#273 |
| 13. | Perth Amboy | 611 | 46,813(1.31%)#13 | 1,051,999(0.06%)#287 |
| 14. | Bridgeton | 607 | 46,813(1.30%)#14 | 1,051,999(0.06%)#290 |
| 15. | Bound Brook Borough | 595 | 46,813(1.27%)#15 | 1,051,999(0.06%)#294 |
| 16. | Paterson | 532 | 46,813(1.14%)#16 | 1,051,999(0.05%)#328 |
| 17. | Camden | 453 | 46,813(0.97%)#17 | 1,051,999(0.04%)#369 |
| 18. | Toms River | 443 | 46,813(0.95%)#18 | 1,051,999(0.04%)#374 |
| 19. | Hackensack | 418 | 46,813(0.89%)#19 | 1,051,999(0.04%)#386 |
| 20. | New Brunswick | 412 | 46,813(0.88%)#20 | 1,051,999(0.04%)#392 |
| 21. | White Horse | 380 | 46,813(0.81%)#21 | 1,051,999(0.04%)#418 |
| 22. | South River Borough | 353 | 46,813(0.75%)#22 | 1,051,999(0.03%)#447 |
| 23. | Twin Rivers | 312 | 46,813(0.67%)#23 | 1,051,999(0.03%)#503 |
| 24. | Englewood | 276 | 46,813(0.59%)#24 | 1,051,999(0.03%)#544 |
| 25. | Bayonne | 271 | 46,813(0.58%)#25 | 1,051,999(0.03%)#551 |
| 26. | Guttenberg | 252 | 46,813(0.54%)#26 | 1,051,999(0.02%)#588 |
| 27. | Flemington Borough | 220 | 46,813(0.47%)#27 | 1,051,999(0.02%)#672 |
| 28. | Bernardsville Borough | 202 | 46,813(0.43%)#28 | 1,051,999(0.02%)#708 |
| 29. | Clifton | 201 | 46,813(0.43%)#29 | 1,051,999(0.02%)#709 |
| 30. | Mercerville | 198 | 46,813(0.42%)#30 | 1,051,999(0.02%)#720 |
| 31. | Kearny | 196 | 46,813(0.42%)#31 | 1,051,999(0.02%)#726 |
| 32. | Fort Lee Borough | 185 | 46,813(0.40%)#32 | 1,051,999(0.02%)#775 |
| 33. | Swedesboro Borough | 184 | 46,813(0.39%)#33 | 1,051,999(0.02%)#780 |
| 34. | Cherry Hill Mall | 180 | 46,813(0.38%)#34 | 1,051,999(0.02%)#787 |
| 35. | Ridgefield Park | 178 | 46,813(0.38%)#35 | 1,051,999(0.02%)#794 |
| 36. | Long Branch | 175 | 46,813(0.37%)#36 | 1,051,999(0.02%)#803 |
| 37. | Woodbury | 172 | 46,813(0.37%)#37 | 1,051,999(0.02%)#817 |
| 38. | Watsessing | 167 | 46,813(0.36%)#38 | 1,051,999(0.02%)#834 |
| 39. | Villas | 165 | 46,813(0.35%)#39 | 1,051,999(0.02%)#845 |
| 40. | Bergenfield Borough | 155 | 46,813(0.33%)#40 | 1,051,999(0.01%)#891 |
| 41. | Asbury Park | 152 | 46,813(0.32%)#41 | 1,051,999(0.01%)#900 |
| 42. | Netcong Borough | 152 | 46,813(0.32%)#42 | 1,051,999(0.01%)#903 |
| 43. | South Plainfield Borough | 147 | 46,813(0.31%)#43 | 1,051,999(0.01%)#923 |
| 44. | Freehold Borough | 145 | 46,813(0.31%)#44 | 1,051,999(0.01%)#942 |
| 45. | East Orange | 139 | 46,813(0.30%)#45 | 1,051,999(0.01%)#977 |
| 46. | Ridgefield Borough | 117 | 46,813(0.25%)#46 | 1,051,999(0.01%)#1,102 |
| 47. | Wanaque Borough | 116 | 46,813(0.25%)#47 | 1,051,999(0.01%)#1,111 |
| 48. | Hammonton | 115 | 46,813(0.25%)#48 | 1,051,999(0.01%)#1,116 |
| 49. | Hawthorne Borough | 111 | 46,813(0.24%)#49 | 1,051,999(0.01%)#1,135 |
| 50. | Vineland | 105 | 46,813(0.22%)#50 | 1,051,999(0.01%)#1,167 |
| 51. | Princeton | 103 | 46,813(0.22%)#51 | 1,051,999(0.01%)#1,184 |
| 52. | North Arlington Borough | 100 | 46,813(0.21%)#52 | 1,051,999(0.01%)#1,201 |
| 53. | Dover | 99 | 46,813(0.21%)#53 | 1,051,999(0.01%)#1,211 |
| 54. | Carteret Borough | 95 | 46,813(0.20%)#54 | 1,051,999(0.01%)#1,250 |
| 55. | Lakewood | 91 | 46,813(0.19%)#55 | 1,051,999(0.01%)#1,291 |
| 56. | Parsippany | 91 | 46,813(0.19%)#56 | 1,051,999(0.01%)#1,296 |
| 57. | Hackettstown | 91 | 46,813(0.19%)#57 | 1,051,999(0.01%)#1,299 |
| 58. | Summit | 90 | 46,813(0.19%)#58 | 1,051,999(0.01%)#1,308 |
| 59. | Butler Borough | 89 | 46,813(0.19%)#59 | 1,051,999(0.01%)#1,320 |
| 60. | Harrison | 83 | 46,813(0.18%)#60 | 1,051,999(0.01%)#1,369 |
| 61. | Rio Grande | 73 | 46,813(0.16%)#61 | 1,051,999(0.01%)#1,469 |
| 62. | Linden | 68 | 46,813(0.15%)#62 | 1,051,999(0.01%)#1,521 |
| 63. | Long Valley | 67 | 46,813(0.14%)#63 | 1,051,999(0.01%)#1,544 |
| 64. | Stratford Borough | 66 | 46,813(0.14%)#64 | 1,051,999(0.01%)#1,555 |
| 65. | Upper Montclair | 62 | 46,813(0.13%)#65 | 1,051,999(0.01%)#1,617 |
| 66. | Hightstown Borough | 60 | 46,813(0.13%)#66 | 1,051,999(0.01%)#1,657 |
| 67. | Avenel | 59 | 46,813(0.13%)#67 | 1,051,999(0.01%)#1,666 |
| 68. | Pennsville | 57 | 46,813(0.12%)#68 | 1,051,999(0.01%)#1,697 |
| 69. | Gillette | 57 | 46,813(0.12%)#69 | 1,051,999(0.01%)#1,698 |
| 70. | Beattystown | 56 | 46,813(0.12%)#70 | 1,051,999(0.01%)#1,712 |
| 71. | Closter Borough | 55 | 46,813(0.12%)#71 | 1,051,999(0.01%)#1,732 |
| 72. | Morristown | 54 | 46,813(0.12%)#72 | 1,051,999(0.01%)#1,745 |
| 73. | Browns Mills | 54 | 46,813(0.12%)#73 | 1,051,999(0.01%)#1,747 |
| 74. | Ashland | 54 | 46,813(0.12%)#74 | 1,051,999(0.01%)#1,749 |
| 75. | Point Pleasant Borough | 52 | 46,813(0.11%)#75 | 1,051,999(0.00%)#1,782 |
| 76. | Prospect Park Borough | 51 | 46,813(0.11%)#76 | 1,051,999(0.00%)#1,804 |
| 77. | Pomona | 50 | 46,813(0.11%)#77 | 1,051,999(0.00%)#1,816 |
| 78. | Golden Triangle | 50 | 46,813(0.11%)#78 | 1,051,999(0.00%)#1,819 |
| 79. | Manville Borough | 49 | 46,813(0.10%)#79 | 1,051,999(0.00%)#1,836 |
| 80. | Raritan Borough | 49 | 46,813(0.10%)#80 | 1,051,999(0.00%)#1,838 |
| 81. | Roosevelt Borough | 47 | 46,813(0.10%)#81 | 1,051,999(0.00%)#1,877 |
| 82. | Runnemede Borough | 46 | 46,813(0.10%)#82 | 1,051,999(0.00%)#1,891 |
| 83. | Somerville Borough | 45 | 46,813(0.10%)#83 | 1,051,999(0.00%)#1,915 |
| 84. | Caldwell Borough | 43 | 46,813(0.09%)#84 | 1,051,999(0.00%)#1,954 |
| 85. | Bellmawr Borough | 40 | 46,813(0.09%)#85 | 1,051,999(0.00%)#2,017 |
| 86. | Pompton Lakes Borough | 40 | 46,813(0.09%)#86 | 1,051,999(0.00%)#2,020 |
| 87. | Glen Rock Borough | 39 | 46,813(0.08%)#87 | 1,051,999(0.00%)#2,054 |
| 88. | Northvale Borough | 39 | 46,813(0.08%)#88 | 1,051,999(0.00%)#2,060 |
| 89. | Old Bridge | 38 | 46,813(0.08%)#89 | 1,051,999(0.00%)#2,070 |
| 90. | Boonton | 38 | 46,813(0.08%)#90 | 1,051,999(0.00%)#2,083 |
| 91. | Riverdale Borough | 37 | 46,813(0.08%)#91 | 1,051,999(0.00%)#2,120 |
| 92. | Beachwood Borough | 35 | 46,813(0.07%)#92 | 1,051,999(0.00%)#2,181 |
| 93. | Springdale | 34 | 46,813(0.07%)#93 | 1,051,999(0.00%)#2,208 |
| 94. | Merchantville Borough | 34 | 46,813(0.07%)#94 | 1,051,999(0.00%)#2,217 |
| 95. | Atlantic City | 33 | 46,813(0.07%)#95 | 1,051,999(0.00%)#2,230 |
| 96. | Rahway | 32 | 46,813(0.07%)#96 | 1,051,999(0.00%)#2,260 |
| 97. | Point Pleasant Beach Borough | 32 | 46,813(0.07%)#97 | 1,051,999(0.00%)#2,280 |
| 98. | Roebling | 32 | 46,813(0.07%)#98 | 1,051,999(0.00%)#2,282 |
| 99. | Fort Dix | 31 | 46,813(0.07%)#99 | 1,051,999(0.00%)#2,306 |
| 100. | Ocean City | 28 | 46,813(0.06%)#100 | 1,051,999(0.00%)#2,398 |
Common Questions
What are the Top 10 Cities with the Most Immigrants from Guatemala in New Jersey?
Top 10 Cities with the Most Immigrants from Guatemala in New Jersey are:
#1
5,572
#2
5,227
#3
3,033
#4
1,524
#5
1,364
#6
1,350
#7
1,069
#8
634
#9
611
#10
607
What city has the Most Immigrants from Guatemala in New Jersey?
Trenton has the Most Immigrants from Guatemala in New Jersey with 5,572.
What is the Total Immigrants from Guatemala in the State of New Jersey?
Total Immigrants from Guatemala in New Jersey is 46,813.
What is the Total Immigrants from Guatemala in the United States?
Total Immigrants from Guatemala in the United States is 1,051,999.