Cities with the Most Immigrants from Vietnam in New Jersey
RELATED REPORTS & OPTIONS
Vietnam
New Jersey
Compare Cities
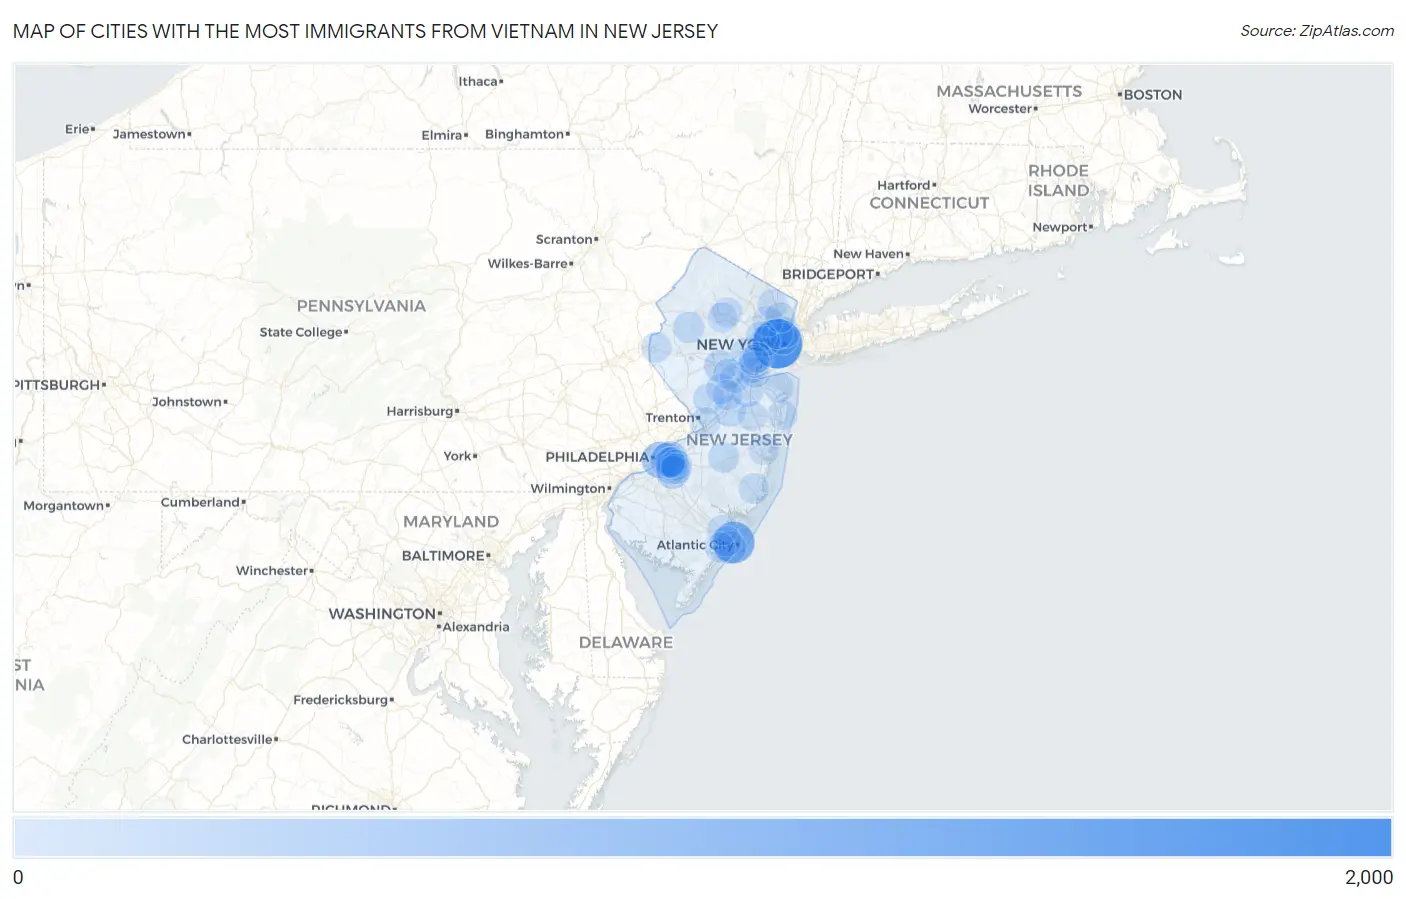
Map of Cities with the Most Immigrants from Vietnam in New Jersey
0
2,000
Cities with the Most Immigrants from Vietnam in New Jersey
| City | Vietnam | vs State | vs National | |
| 1. | Jersey City | 1,575 | 15,644(10.07%)#1 | 1,349,684(0.12%)#110 |
| 2. | Atlantic City | 923 | 15,644(5.90%)#2 | 1,349,684(0.07%)#197 |
| 3. | Camden | 512 | 15,644(3.27%)#3 | 1,349,684(0.04%)#354 |
| 4. | Cherry Hill Mall | 388 | 15,644(2.48%)#4 | 1,349,684(0.03%)#448 |
| 5. | Eatontown Borough | 384 | 15,644(2.45%)#5 | 1,349,684(0.03%)#456 |
| 6. | Golden Triangle | 342 | 15,644(2.19%)#6 | 1,349,684(0.03%)#513 |
| 7. | Echelon | 235 | 15,644(1.50%)#7 | 1,349,684(0.02%)#693 |
| 8. | Ventnor City | 198 | 15,644(1.27%)#8 | 1,349,684(0.01%)#794 |
| 9. | Finderne | 174 | 15,644(1.11%)#9 | 1,349,684(0.01%)#880 |
| 10. | Old Bridge | 140 | 15,644(0.89%)#10 | 1,349,684(0.01%)#1,033 |
| 11. | Lindenwold Borough | 132 | 15,644(0.84%)#11 | 1,349,684(0.01%)#1,084 |
| 12. | Hoboken | 128 | 15,644(0.82%)#12 | 1,349,684(0.01%)#1,102 |
| 13. | Ashland | 124 | 15,644(0.79%)#13 | 1,349,684(0.01%)#1,132 |
| 14. | Kingston Estates | 115 | 15,644(0.74%)#14 | 1,349,684(0.01%)#1,201 |
| 15. | South Plainfield Borough | 110 | 15,644(0.70%)#15 | 1,349,684(0.01%)#1,240 |
| 16. | Beattystown | 110 | 15,644(0.70%)#16 | 1,349,684(0.01%)#1,244 |
| 17. | Twin Rivers | 108 | 15,644(0.69%)#17 | 1,349,684(0.01%)#1,260 |
| 18. | Fair Lawn Borough | 105 | 15,644(0.67%)#18 | 1,349,684(0.01%)#1,280 |
| 19. | Lake Hiawatha | 102 | 15,644(0.65%)#19 | 1,349,684(0.01%)#1,309 |
| 20. | Neshanic Station | 101 | 15,644(0.65%)#20 | 1,349,684(0.01%)#1,319 |
| 21. | Dunellen Borough | 92 | 15,644(0.59%)#21 | 1,349,684(0.01%)#1,390 |
| 22. | Raritan Borough | 91 | 15,644(0.58%)#22 | 1,349,684(0.01%)#1,400 |
| 23. | Wharton Borough | 89 | 15,644(0.57%)#23 | 1,349,684(0.01%)#1,415 |
| 24. | Fort Lee Borough | 87 | 15,644(0.56%)#24 | 1,349,684(0.01%)#1,423 |
| 25. | Middlesex Borough | 87 | 15,644(0.56%)#25 | 1,349,684(0.01%)#1,433 |
| 26. | Woodbridge | 85 | 15,644(0.54%)#26 | 1,349,684(0.01%)#1,455 |
| 27. | Magnolia Borough | 84 | 15,644(0.54%)#27 | 1,349,684(0.01%)#1,473 |
| 28. | Union | 79 | 15,644(0.50%)#28 | 1,349,684(0.01%)#1,530 |
| 29. | Parsippany | 78 | 15,644(0.50%)#29 | 1,349,684(0.01%)#1,537 |
| 30. | Princeton | 75 | 15,644(0.48%)#30 | 1,349,684(0.01%)#1,564 |
| 31. | Greentree | 75 | 15,644(0.48%)#31 | 1,349,684(0.01%)#1,569 |
| 32. | Country Lake Estates | 75 | 15,644(0.48%)#32 | 1,349,684(0.01%)#1,572 |
| 33. | Woodlynne Borough | 71 | 15,644(0.45%)#33 | 1,349,684(0.01%)#1,620 |
| 34. | River Edge Borough | 70 | 15,644(0.45%)#34 | 1,349,684(0.01%)#1,631 |
| 35. | West New York | 68 | 15,644(0.43%)#35 | 1,349,684(0.01%)#1,650 |
| 36. | Morris Plains Borough | 67 | 15,644(0.43%)#36 | 1,349,684(0.00%)#1,678 |
| 37. | Somerset | 65 | 15,644(0.42%)#37 | 1,349,684(0.00%)#1,702 |
| 38. | Secaucus | 65 | 15,644(0.42%)#38 | 1,349,684(0.00%)#1,704 |
| 39. | Hasbrouck Heights Borough | 60 | 15,644(0.38%)#39 | 1,349,684(0.00%)#1,774 |
| 40. | Ocean Acres | 59 | 15,644(0.38%)#40 | 1,349,684(0.00%)#1,793 |
| 41. | Leonia Borough | 59 | 15,644(0.38%)#41 | 1,349,684(0.00%)#1,796 |
| 42. | Kendall Park | 54 | 15,644(0.35%)#42 | 1,349,684(0.00%)#1,863 |
| 43. | Roseland Borough | 54 | 15,644(0.35%)#43 | 1,349,684(0.00%)#1,872 |
| 44. | Sayreville Borough | 53 | 15,644(0.34%)#44 | 1,349,684(0.00%)#1,876 |
| 45. | Manville Borough | 52 | 15,644(0.33%)#45 | 1,349,684(0.00%)#1,905 |
| 46. | Newark | 50 | 15,644(0.32%)#46 | 1,349,684(0.00%)#1,925 |
| 47. | Little Ferry Borough | 50 | 15,644(0.32%)#47 | 1,349,684(0.00%)#1,945 |
| 48. | Springdale | 48 | 15,644(0.31%)#48 | 1,349,684(0.00%)#1,980 |
| 49. | Clifton | 47 | 15,644(0.30%)#49 | 1,349,684(0.00%)#1,985 |
| 50. | Greenwich | 47 | 15,644(0.30%)#50 | 1,349,684(0.00%)#2,002 |
| 51. | White Horse | 46 | 15,644(0.29%)#51 | 1,349,684(0.00%)#2,018 |
| 52. | Sicklerville | 42 | 15,644(0.27%)#52 | 1,349,684(0.00%)#2,107 |
| 53. | Tenafly Borough | 42 | 15,644(0.27%)#53 | 1,349,684(0.00%)#2,116 |
| 54. | New Brunswick | 41 | 15,644(0.26%)#54 | 1,349,684(0.00%)#2,128 |
| 55. | Perth Amboy | 41 | 15,644(0.26%)#55 | 1,349,684(0.00%)#2,129 |
| 56. | Westfield | 41 | 15,644(0.26%)#56 | 1,349,684(0.00%)#2,132 |
| 57. | Pomona | 41 | 15,644(0.26%)#57 | 1,349,684(0.00%)#2,141 |
| 58. | Rutgers University-Busch Campus | 41 | 15,644(0.26%)#58 | 1,349,684(0.00%)#2,145 |
| 59. | East Orange | 40 | 15,644(0.26%)#59 | 1,349,684(0.00%)#2,153 |
| 60. | Avenel | 40 | 15,644(0.26%)#60 | 1,349,684(0.00%)#2,163 |
| 61. | Glassboro Borough | 38 | 15,644(0.24%)#61 | 1,349,684(0.00%)#2,206 |
| 62. | Ellisburg | 37 | 15,644(0.24%)#62 | 1,349,684(0.00%)#2,255 |
| 63. | Hopelawn | 37 | 15,644(0.24%)#63 | 1,349,684(0.00%)#2,260 |
| 64. | Paramus Borough | 36 | 15,644(0.23%)#64 | 1,349,684(0.00%)#2,269 |
| 65. | Ridgewood | 35 | 15,644(0.22%)#65 | 1,349,684(0.00%)#2,296 |
| 66. | Pleasantville | 35 | 15,644(0.22%)#66 | 1,349,684(0.00%)#2,299 |
| 67. | Hackensack | 34 | 15,644(0.22%)#67 | 1,349,684(0.00%)#2,325 |
| 68. | Bergenfield Borough | 33 | 15,644(0.21%)#68 | 1,349,684(0.00%)#2,364 |
| 69. | Toms River | 32 | 15,644(0.20%)#69 | 1,349,684(0.00%)#2,392 |
| 70. | Ringwood Borough | 32 | 15,644(0.20%)#70 | 1,349,684(0.00%)#2,412 |
| 71. | Highlands Borough | 32 | 15,644(0.20%)#71 | 1,349,684(0.00%)#2,423 |
| 72. | Rahway | 29 | 15,644(0.19%)#72 | 1,349,684(0.00%)#2,494 |
| 73. | Wanamassa | 29 | 15,644(0.19%)#73 | 1,349,684(0.00%)#2,518 |
| 74. | Somerville Borough | 28 | 15,644(0.18%)#74 | 1,349,684(0.00%)#2,544 |
| 75. | Moonachie Borough | 28 | 15,644(0.18%)#75 | 1,349,684(0.00%)#2,558 |
| 76. | Collingswood Borough | 27 | 15,644(0.17%)#76 | 1,349,684(0.00%)#2,575 |
| 77. | Wood Ridge Borough | 27 | 15,644(0.17%)#77 | 1,349,684(0.00%)#2,580 |
| 78. | Palmyra Borough | 27 | 15,644(0.17%)#78 | 1,349,684(0.00%)#2,583 |
| 79. | Hillsborough | 26 | 15,644(0.17%)#79 | 1,349,684(0.00%)#2,609 |
| 80. | White Meadow Lake | 24 | 15,644(0.15%)#80 | 1,349,684(0.00%)#2,715 |
| 81. | Red Bank Borough | 23 | 15,644(0.15%)#81 | 1,349,684(0.00%)#2,742 |
| 82. | Lincoln Park Borough | 23 | 15,644(0.15%)#82 | 1,349,684(0.00%)#2,745 |
| 83. | Ramapo College Of New Jersey | 23 | 15,644(0.15%)#83 | 1,349,684(0.00%)#2,762 |
| 84. | Mckee | 22 | 15,644(0.14%)#84 | 1,349,684(0.00%)#2,786 |
| 85. | Merchantville Borough | 22 | 15,644(0.14%)#85 | 1,349,684(0.00%)#2,800 |
| 86. | Park Ridge Borough | 21 | 15,644(0.13%)#86 | 1,349,684(0.00%)#2,850 |
| 87. | Dover | 20 | 15,644(0.13%)#87 | 1,349,684(0.00%)#2,885 |
| 88. | Matawan Borough | 20 | 15,644(0.13%)#88 | 1,349,684(0.00%)#2,901 |
| 89. | Englewood Cliffs Borough | 20 | 15,644(0.13%)#89 | 1,349,684(0.00%)#2,909 |
| 90. | Leonardo | 20 | 15,644(0.13%)#90 | 1,349,684(0.00%)#2,918 |
| 91. | Linden | 19 | 15,644(0.12%)#91 | 1,349,684(0.00%)#2,926 |
| 92. | North Plainfield Borough | 19 | 15,644(0.12%)#92 | 1,349,684(0.00%)#2,929 |
| 93. | Elmwood Park Borough | 19 | 15,644(0.12%)#93 | 1,349,684(0.00%)#2,930 |
| 94. | Tinton Falls Borough | 19 | 15,644(0.12%)#94 | 1,349,684(0.00%)#2,933 |
| 95. | Linwood | 19 | 15,644(0.12%)#95 | 1,349,684(0.00%)#2,952 |
| 96. | Robbinsville Center | 18 | 15,644(0.12%)#96 | 1,349,684(0.00%)#3,016 |
| 97. | West Freehold | 17 | 15,644(0.11%)#97 | 1,349,684(0.00%)#3,050 |
| 98. | Dayton | 17 | 15,644(0.11%)#98 | 1,349,684(0.00%)#3,063 |
| 99. | Midland Park Borough | 17 | 15,644(0.11%)#99 | 1,349,684(0.00%)#3,067 |
| 100. | Rockaway Borough | 17 | 15,644(0.11%)#100 | 1,349,684(0.00%)#3,069 |
Common Questions
What are the Top 10 Cities with the Most Immigrants from Vietnam in New Jersey?
Top 10 Cities with the Most Immigrants from Vietnam in New Jersey are:
#1
1,575
#2
923
#3
512
#4
388
#5
342
#6
235
#7
198
#8
174
#9
140
#10
128
What city has the Most Immigrants from Vietnam in New Jersey?
Jersey City has the Most Immigrants from Vietnam in New Jersey with 1,575.
What is the Total Immigrants from Vietnam in the State of New Jersey?
Total Immigrants from Vietnam in New Jersey is 15,644.
What is the Total Immigrants from Vietnam in the United States?
Total Immigrants from Vietnam in the United States is 1,349,684.