Cities with the Highest Percentage of Local Government Employees in New Jersey
RELATED REPORTS & OPTIONS
Local Government Employees
New Jersey
Compare Cities
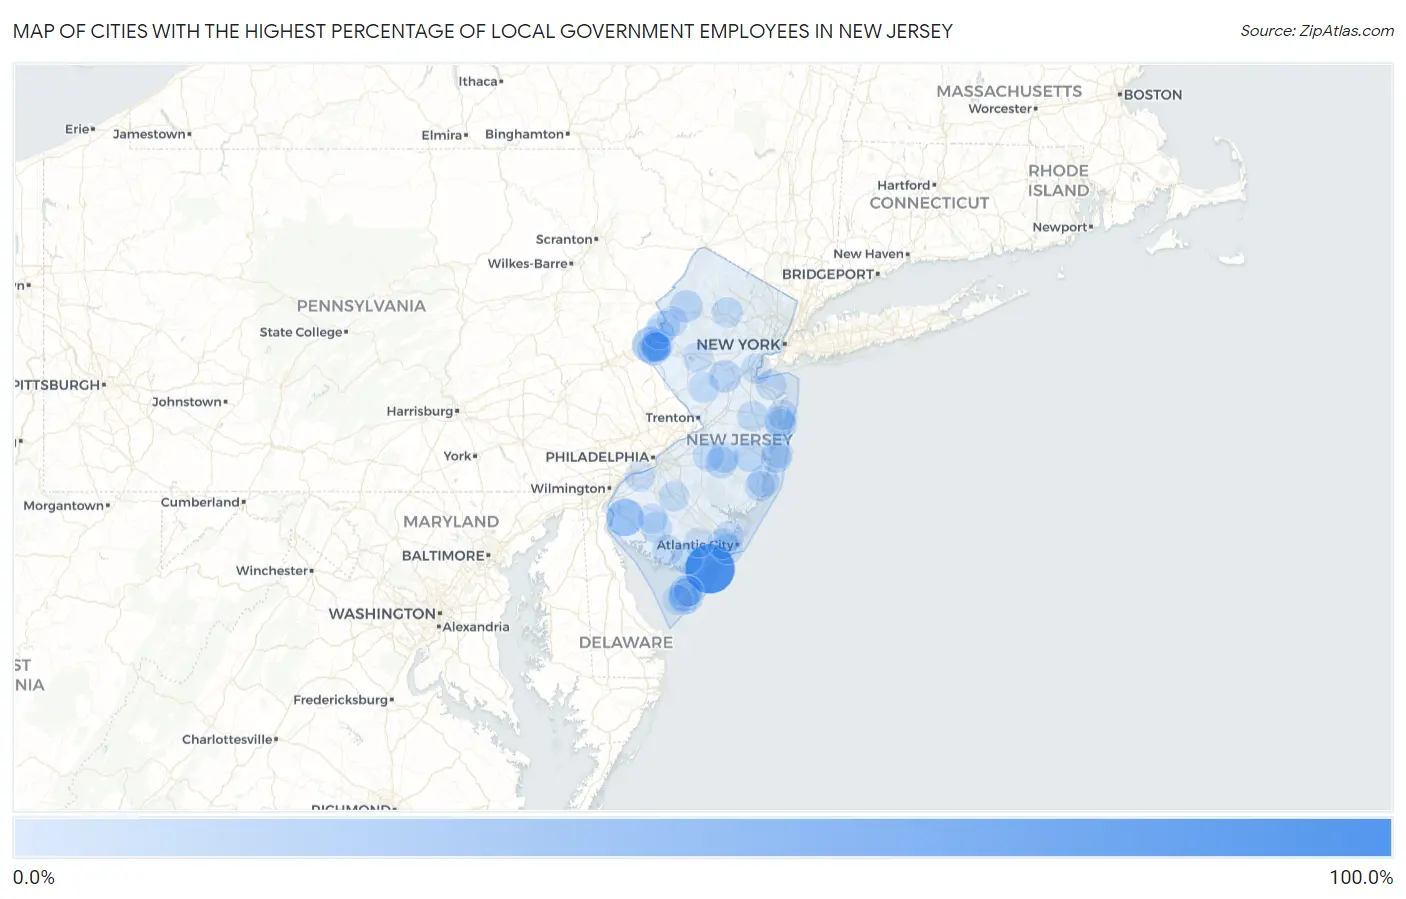
Map of Cities with the Highest Percentage of Local Government Employees in New Jersey
0.0%
100.0%
Cities with the Highest Percentage of Local Government Employees in New Jersey
| City | % Local Government Employees | vs State | vs National | |
| 1. | Strathmere | 82.2% | 8.2%(+74.1)#1 | 7.2%(+75.0)#79 |
| 2. | Hibernia | 80.0% | 8.2%(+71.8)#2 | 7.2%(+72.8)#84 |
| 3. | Renaissance At Monroe | 57.5% | 8.2%(+49.4)#3 | 7.2%(+50.3)#187 |
| 4. | Laurel Heights | 44.0% | 8.2%(+35.9)#4 | 7.2%(+36.8)#393 |
| 5. | Delmont | 40.1% | 8.2%(+31.9)#5 | 7.2%(+32.9)#471 |
| 6. | Quinton | 38.8% | 8.2%(+30.6)#6 | 7.2%(+31.6)#501 |
| 7. | Bridgeport | 36.8% | 8.2%(+28.7)#7 | 7.2%(+29.6)#569 |
| 8. | Pine Beach Borough | 36.8% | 8.2%(+28.6)#8 | 7.2%(+29.5)#575 |
| 9. | Roadstown | 36.6% | 8.2%(+28.5)#9 | 7.2%(+29.4)#584 |
| 10. | Marshallville | 33.8% | 8.2%(+25.7)#10 | 7.2%(+26.6)#695 |
| 11. | Delaware Park | 33.5% | 8.2%(+25.3)#11 | 7.2%(+26.2)#707 |
| 12. | Beesleys Point | 29.4% | 8.2%(+21.2)#12 | 7.2%(+22.1)#940 |
| 13. | Dividing Creek | 28.4% | 8.2%(+20.2)#13 | 7.2%(+21.2)#1,000 |
| 14. | Sweetwater | 24.9% | 8.2%(+16.8)#14 | 7.2%(+17.7)#1,316 |
| 15. | Upper Pohatcong | 24.3% | 8.2%(+16.1)#15 | 7.2%(+17.0)#1,382 |
| 16. | Dennisville | 24.0% | 8.2%(+15.8)#16 | 7.2%(+16.8)#1,403 |
| 17. | Rio Grande | 23.1% | 8.2%(+15.0)#17 | 7.2%(+15.9)#1,503 |
| 18. | West Wildwood Borough | 22.6% | 8.2%(+14.4)#18 | 7.2%(+15.4)#1,579 |
| 19. | Middlebush | 22.2% | 8.2%(+14.1)#19 | 7.2%(+15.0)#1,640 |
| 20. | Marmora | 22.2% | 8.2%(+14.0)#20 | 7.2%(+15.0)#1,666 |
| 21. | Pottersville | 22.1% | 8.2%(+14.0)#21 | 7.2%(+14.9)#1,668 |
| 22. | Whitesboro | 22.0% | 8.2%(+13.9)#22 | 7.2%(+14.8)#1,679 |
| 23. | Johnsonburg | 22.0% | 8.2%(+13.8)#23 | 7.2%(+14.8)#1,684 |
| 24. | Union | 21.9% | 8.2%(+13.7)#24 | 7.2%(+14.7)#1,705 |
| 25. | Mizpah | 20.6% | 8.2%(+12.4)#25 | 7.2%(+13.4)#1,933 |
| 26. | Upper Stewartsville | 20.3% | 8.2%(+12.1)#26 | 7.2%(+13.0)#2,002 |
| 27. | Emerson Borough | 20.2% | 8.2%(+12.1)#27 | 7.2%(+13.0)#2,008 |
| 28. | Pluckemin | 20.0% | 8.2%(+11.8)#28 | 7.2%(+12.8)#2,034 |
| 29. | Belvidere | 19.7% | 8.2%(+11.5)#29 | 7.2%(+12.5)#2,114 |
| 30. | Waretown | 19.6% | 8.2%(+11.5)#30 | 7.2%(+12.4)#2,131 |
| 31. | Presidential Lakes Estates | 19.6% | 8.2%(+11.4)#31 | 7.2%(+12.3)#2,145 |
| 32. | Auburn | 19.4% | 8.2%(+11.2)#32 | 7.2%(+12.2)#2,166 |
| 33. | Pine Ridge At Crestwood | 19.3% | 8.2%(+11.1)#33 | 7.2%(+12.0)#2,210 |
| 34. | West Belmar | 18.9% | 8.2%(+10.8)#34 | 7.2%(+11.7)#2,302 |
| 35. | Rainbow Lakes | 18.7% | 8.2%(+10.6)#35 | 7.2%(+11.5)#2,375 |
| 36. | South Dennis | 18.7% | 8.2%(+10.6)#36 | 7.2%(+11.5)#2,376 |
| 37. | Belleplain | 18.6% | 8.2%(+10.4)#37 | 7.2%(+11.4)#2,399 |
| 38. | Shark River Hills | 18.6% | 8.2%(+10.4)#38 | 7.2%(+11.4)#2,406 |
| 39. | Rosenhayn | 18.2% | 8.2%(+10.1)#39 | 7.2%(+11.0)#2,503 |
| 40. | Newfoundland | 18.0% | 8.2%(+9.81)#40 | 7.2%(+10.7)#2,576 |
| 41. | Lopatcong Overlook | 17.7% | 8.2%(+9.54)#41 | 7.2%(+10.5)#2,653 |
| 42. | Dover Beaches North | 17.5% | 8.2%(+9.36)#42 | 7.2%(+10.3)#2,713 |
| 43. | Sea Girt Borough | 17.4% | 8.2%(+9.27)#43 | 7.2%(+10.2)#2,751 |
| 44. | Hutchinson | 17.4% | 8.2%(+9.23)#44 | 7.2%(+10.2)#2,763 |
| 45. | Country Lake Estates | 17.3% | 8.2%(+9.17)#45 | 7.2%(+10.1)#2,784 |
| 46. | Margate City | 17.1% | 8.2%(+8.95)#46 | 7.2%(+9.88)#2,850 |
| 47. | White Meadow Lake | 17.0% | 8.2%(+8.79)#47 | 7.2%(+9.73)#2,893 |
| 48. | Erma | 16.9% | 8.2%(+8.77)#48 | 7.2%(+9.71)#2,901 |
| 49. | Dover Beaches South | 16.9% | 8.2%(+8.74)#49 | 7.2%(+9.68)#2,916 |
| 50. | West Freehold | 16.8% | 8.2%(+8.64)#50 | 7.2%(+9.57)#2,951 |
| 51. | Pemberton Heights | 16.8% | 8.2%(+8.59)#51 | 7.2%(+9.53)#2,971 |
| 52. | Northfield | 16.7% | 8.2%(+8.57)#52 | 7.2%(+9.50)#2,980 |
| 53. | Skillman | 16.6% | 8.2%(+8.41)#53 | 7.2%(+9.35)#3,078 |
| 54. | Laurel Lake | 16.6% | 8.2%(+8.40)#54 | 7.2%(+9.34)#3,084 |
| 55. | North Haledon Borough | 16.5% | 8.2%(+8.35)#55 | 7.2%(+9.29)#3,108 |
| 56. | Barnegat | 16.4% | 8.2%(+8.27)#56 | 7.2%(+9.21)#3,140 |
| 57. | Midland Park Borough | 16.4% | 8.2%(+8.20)#57 | 7.2%(+9.14)#3,169 |
| 58. | Brielle Borough | 16.3% | 8.2%(+8.15)#58 | 7.2%(+9.09)#3,190 |
| 59. | Williamstown | 16.3% | 8.2%(+8.14)#59 | 7.2%(+9.07)#3,199 |
| 60. | Gibbstown | 16.2% | 8.2%(+8.03)#60 | 7.2%(+8.96)#3,245 |
| 61. | Port Elizabeth | 16.2% | 8.2%(+8.01)#61 | 7.2%(+8.95)#3,249 |
| 62. | North Middletown | 16.2% | 8.2%(+8.01)#62 | 7.2%(+8.95)#3,257 |
| 63. | Sewaren | 16.1% | 8.2%(+7.99)#63 | 7.2%(+8.92)#3,266 |
| 64. | Mountain Lake | 16.0% | 8.2%(+7.87)#64 | 7.2%(+8.80)#3,324 |
| 65. | West Park | 15.8% | 8.2%(+7.69)#65 | 7.2%(+8.62)#3,406 |
| 66. | Wildwood Crest Borough | 15.7% | 8.2%(+7.54)#66 | 7.2%(+8.47)#3,493 |
| 67. | Point Pleasant Beach Borough | 15.6% | 8.2%(+7.43)#67 | 7.2%(+8.37)#3,558 |
| 68. | Cologne | 15.5% | 8.2%(+7.38)#68 | 7.2%(+8.31)#3,587 |
| 69. | Wanamassa | 15.5% | 8.2%(+7.37)#69 | 7.2%(+8.31)#3,588 |
| 70. | Olivet | 15.3% | 8.2%(+7.10)#70 | 7.2%(+8.04)#3,726 |
| 71. | Greenwich | 15.1% | 8.2%(+6.98)#71 | 7.2%(+7.91)#3,801 |
| 72. | Malaga | 15.1% | 8.2%(+6.90)#72 | 7.2%(+7.83)#3,848 |
| 73. | Absecon | 15.0% | 8.2%(+6.88)#73 | 7.2%(+7.82)#3,857 |
| 74. | Ship Bottom Borough | 14.8% | 8.2%(+6.64)#74 | 7.2%(+7.58)#4,002 |
| 75. | Neshanic | 14.8% | 8.2%(+6.62)#75 | 7.2%(+7.55)#4,016 |
| 76. | Whippany | 14.7% | 8.2%(+6.53)#76 | 7.2%(+7.47)#4,061 |
| 77. | Mount Tabor | 14.7% | 8.2%(+6.52)#77 | 7.2%(+7.45)#4,070 |
| 78. | Milmay | 14.6% | 8.2%(+6.43)#78 | 7.2%(+7.37)#4,138 |
| 79. | North Cape May | 14.5% | 8.2%(+6.37)#79 | 7.2%(+7.30)#4,179 |
| 80. | Oceanville | 14.5% | 8.2%(+6.36)#80 | 7.2%(+7.29)#4,186 |
| 81. | Garwood Borough | 14.5% | 8.2%(+6.34)#81 | 7.2%(+7.28)#4,196 |
| 82. | White House Station | 14.5% | 8.2%(+6.34)#82 | 7.2%(+7.27)#4,197 |
| 83. | Burleigh | 14.5% | 8.2%(+6.32)#83 | 7.2%(+7.26)#4,215 |
| 84. | Barnegat Light Borough | 14.4% | 8.2%(+6.25)#84 | 7.2%(+7.19)#4,255 |
| 85. | Carlstadt Borough | 14.4% | 8.2%(+6.19)#85 | 7.2%(+7.13)#4,288 |
| 86. | Morris Plains Borough | 14.4% | 8.2%(+6.19)#86 | 7.2%(+7.13)#4,291 |
| 87. | Ogdensburg Borough | 14.3% | 8.2%(+6.14)#87 | 7.2%(+7.07)#4,316 |
| 88. | Flemington Borough | 14.3% | 8.2%(+6.12)#88 | 7.2%(+7.05)#4,389 |
| 89. | Jamesburg Borough | 14.2% | 8.2%(+6.04)#89 | 7.2%(+6.97)#4,422 |
| 90. | Shiloh Borough | 14.2% | 8.2%(+6.02)#90 | 7.2%(+6.96)#4,437 |
| 91. | Haddon Heights Borough | 14.1% | 8.2%(+5.95)#91 | 7.2%(+6.89)#4,510 |
| 92. | Shrewsbury Borough | 14.1% | 8.2%(+5.94)#92 | 7.2%(+6.88)#4,515 |
| 93. | Estell Manor | 14.0% | 8.2%(+5.85)#93 | 7.2%(+6.79)#4,576 |
| 94. | Waldwick Borough | 14.0% | 8.2%(+5.82)#94 | 7.2%(+6.76)#4,588 |
| 95. | Island Heights Borough | 14.0% | 8.2%(+5.79)#95 | 7.2%(+6.72)#4,619 |
| 96. | Lawnside Borough | 13.9% | 8.2%(+5.74)#96 | 7.2%(+6.68)#4,653 |
| 97. | Dumont Borough | 13.9% | 8.2%(+5.72)#97 | 7.2%(+6.65)#4,671 |
| 98. | North Caldwell Borough | 13.9% | 8.2%(+5.70)#98 | 7.2%(+6.63)#4,685 |
| 99. | Stanhope Borough | 13.8% | 8.2%(+5.66)#99 | 7.2%(+6.60)#4,702 |
| 100. | Frenchtown Borough | 13.7% | 8.2%(+5.54)#100 | 7.2%(+6.47)#4,792 |
Common Questions
What are the Top 10 Cities with the Highest Percentage of Local Government Employees in New Jersey?
Top 10 Cities with the Highest Percentage of Local Government Employees in New Jersey are:
#1
82.2%
#2
38.8%
#3
33.5%
#4
24.3%
#5
23.1%
#6
22.2%
#7
22.0%
#8
22.0%
#9
20.3%
#10
19.7%
What city has the Highest Percentage of Local Government Employees in New Jersey?
Strathmere has the Highest Percentage of Local Government Employees in New Jersey with 82.2%.
What is the Percentage of Local Government Employees in the State of New Jersey?
Percentage of Local Government Employees in New Jersey is 8.2%.
What is the Percentage of Local Government Employees in the United States?
Percentage of Local Government Employees in the United States is 7.2%.