Spring Lake borough, NJ Map & Demographics
Spring Lake borough Overview
$112,232
PER CAPITA INCOME
$219,286
AVG FAMILY INCOME
$157,250
AVG HOUSEHOLD INCOME
36.6%
WAGE / INCOME GAP [ % ]
63.4¢/ $1
WAGE / INCOME GAP [ $ ]
$9,573
FAMILY INCOME DEFICIT
0.50
INEQUALITY / GINI INDEX
2,788
TOTAL POPULATION
1,355
MALE POPULATION
1,433
FEMALE POPULATION
94.56
MALES / 100 FEMALES
105.76
FEMALES / 100 MALES
58.6
MEDIAN AGE
2.6
AVG FAMILY SIZE
2.2
AVG HOUSEHOLD SIZE
1,083
LABOR FORCE [ PEOPLE ]
43.0%
PERCENT IN LABOR FORCE
2.6%
UNEMPLOYMENT RATE
Income in Spring Lake borough
Income Overview in Spring Lake borough
Per Capita Income in Spring Lake borough is $112,232, while median incomes of families and households are $219,286 and $157,250 respectively.
| Characteristic | Number | Measure |
| Per Capita Income | 2,788 | $112,232 |
| Median Family Income | 916 | $219,286 |
| Mean Family Income | 916 | $282,969 |
| Median Household Income | 1,268 | $157,250 |
| Mean Household Income | 1,268 | $246,096 |
| Income Deficit | 916 | $9,573 |
| Wage / Income Gap (%) | 2,788 | 36.58% |
| Wage / Income Gap ($) | 2,788 | 63.42¢ per $1 |
| Gini / Inequality Index | 2,788 | 0.50 |
Earnings by Sex in Spring Lake borough
Average Earnings in Spring Lake borough are $91,771, $112,863 for men and $71,583 for women, a difference of 36.6%.
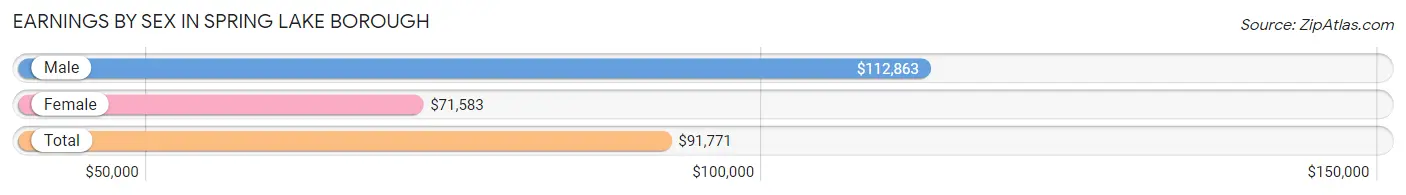
| Sex | Number | Average Earnings |
| Male | 699 (55.3%) | $112,863 |
| Female | 564 (44.7%) | $71,583 |
| Total | 1,263 (100.0%) | $91,771 |
Earnings by Sex by Income Bracket in Spring Lake borough
The most common earnings brackets in Spring Lake borough are $100,000+ for men (396 | 56.7%) and $100,000+ for women (186 | 33.0%).
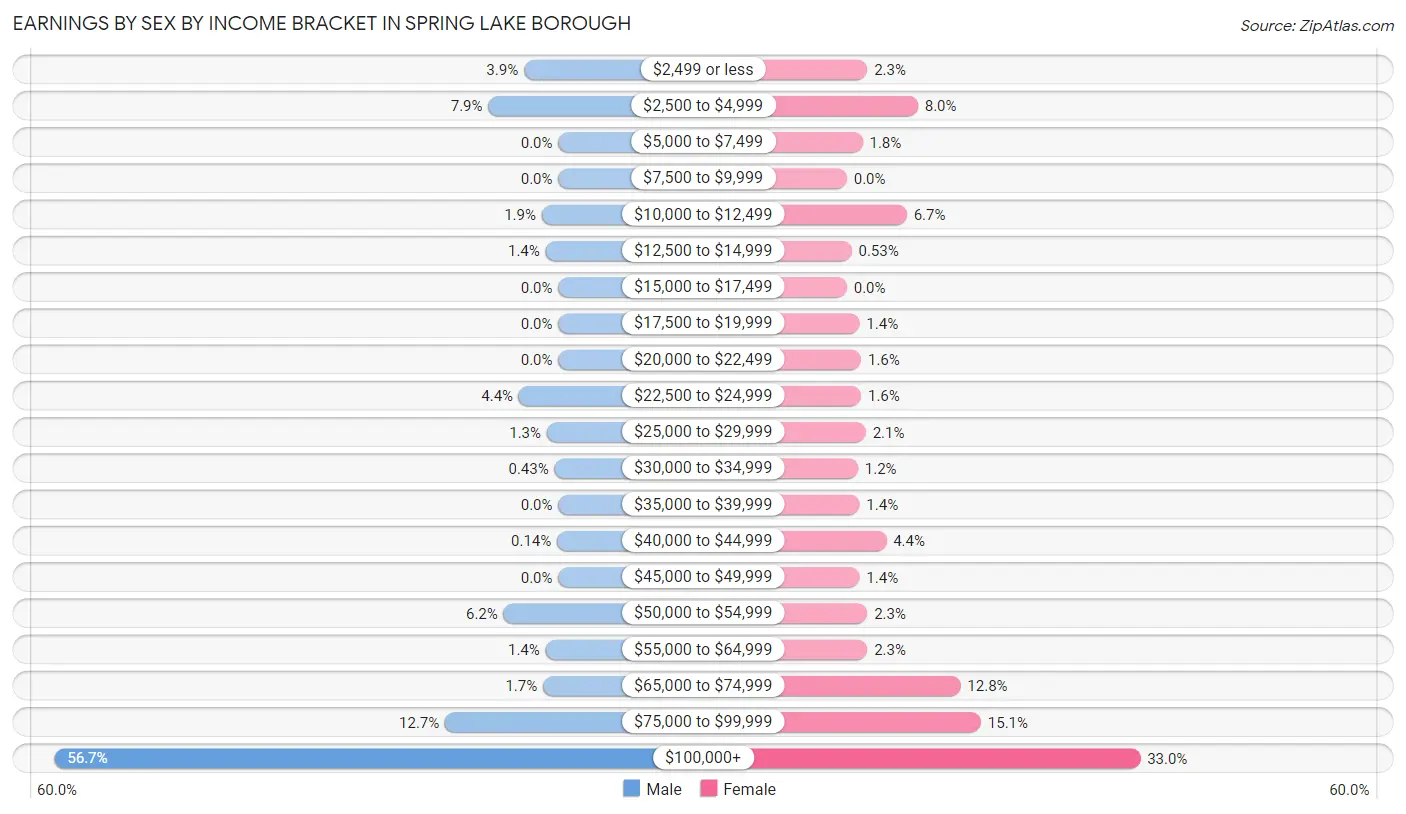
| Income | Male | Female |
| $2,499 or less | 27 (3.9%) | 13 (2.3%) |
| $2,500 to $4,999 | 55 (7.9%) | 45 (8.0%) |
| $5,000 to $7,499 | 0 (0.0%) | 10 (1.8%) |
| $7,500 to $9,999 | 0 (0.0%) | 0 (0.0%) |
| $10,000 to $12,499 | 13 (1.9%) | 38 (6.7%) |
| $12,500 to $14,999 | 10 (1.4%) | 3 (0.5%) |
| $15,000 to $17,499 | 0 (0.0%) | 0 (0.0%) |
| $17,500 to $19,999 | 0 (0.0%) | 8 (1.4%) |
| $20,000 to $22,499 | 0 (0.0%) | 9 (1.6%) |
| $22,500 to $24,999 | 31 (4.4%) | 9 (1.6%) |
| $25,000 to $29,999 | 9 (1.3%) | 12 (2.1%) |
| $30,000 to $34,999 | 3 (0.4%) | 7 (1.2%) |
| $35,000 to $39,999 | 0 (0.0%) | 8 (1.4%) |
| $40,000 to $44,999 | 1 (0.1%) | 25 (4.4%) |
| $45,000 to $49,999 | 0 (0.0%) | 8 (1.4%) |
| $50,000 to $54,999 | 43 (6.1%) | 13 (2.3%) |
| $55,000 to $64,999 | 10 (1.4%) | 13 (2.3%) |
| $65,000 to $74,999 | 12 (1.7%) | 72 (12.8%) |
| $75,000 to $99,999 | 89 (12.7%) | 85 (15.1%) |
| $100,000+ | 396 (56.7%) | 186 (33.0%) |
| Total | 699 (100.0%) | 564 (100.0%) |
Earnings by Sex by Educational Attainment in Spring Lake borough
Average earnings in Spring Lake borough are $114,244 for men and $79,688 for women, a difference of 30.2%. Men with an educational attainment of college or associate's degree enjoy the highest average annual earnings of $250,001, while those with bachelor's degree education earn the least with $113,164. Women with an educational attainment of graduate degree earn the most with the average annual earnings of $91,250, while those with bachelor's degree education have the smallest earnings of $79,063.
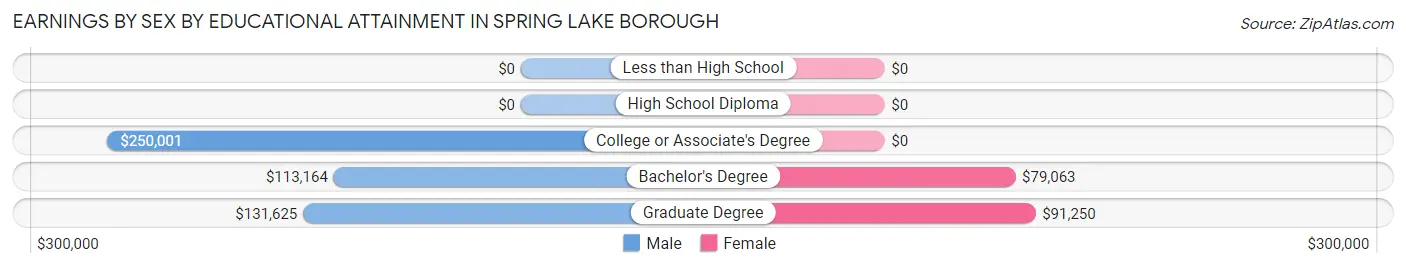
| Educational Attainment | Male Income | Female Income |
| Less than High School | - | - |
| High School Diploma | - | - |
| College or Associate's Degree | $250,001 | $0 |
| Bachelor's Degree | $113,164 | $79,063 |
| Graduate Degree | $131,625 | $91,250 |
| Total | $114,244 | $79,688 |
Family Income in Spring Lake borough
Family Income Brackets in Spring Lake borough
According to the Spring Lake borough family income data, there are 472 families falling into the $200,000+ income range, which is the most common income bracket and makes up 51.5% of all families.
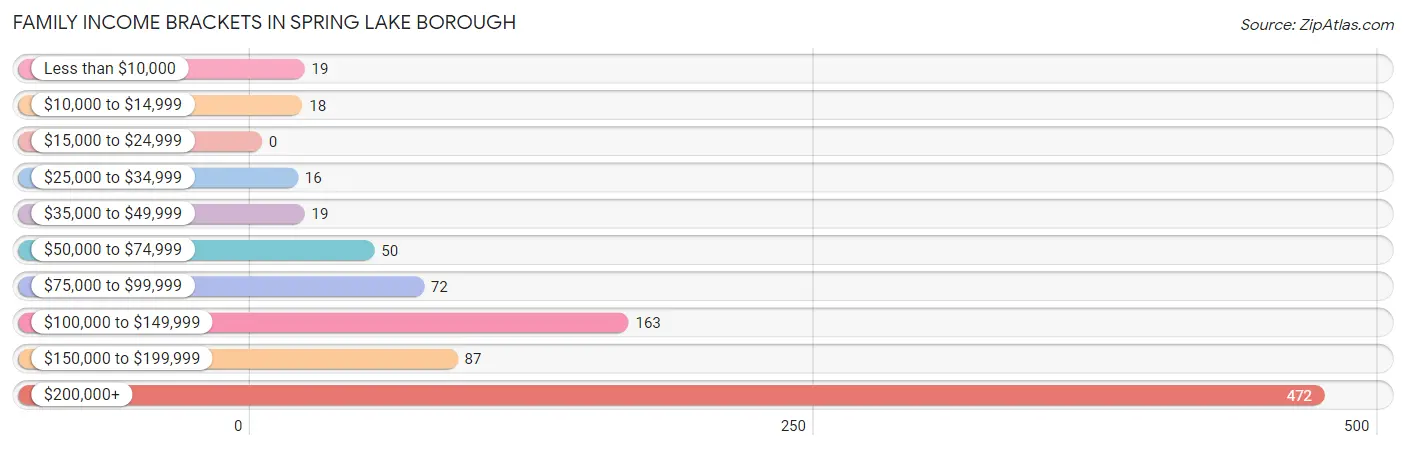
| Income Bracket | # Families | % Families |
| Less than $10,000 | 19 | 2.1% |
| $10,000 to $14,999 | 18 | 2.0% |
| $15,000 to $24,999 | 0 | 0.0% |
| $25,000 to $34,999 | 16 | 1.7% |
| $35,000 to $49,999 | 19 | 2.1% |
| $50,000 to $74,999 | 50 | 5.5% |
| $75,000 to $99,999 | 72 | 7.9% |
| $100,000 to $149,999 | 163 | 17.8% |
| $150,000 to $199,999 | 87 | 9.5% |
| $200,000+ | 472 | 51.5% |
Family Income by Famaliy Size in Spring Lake borough
3-person families (169 | 18.4%) account for the highest median family income in Spring Lake borough with $250,001 per family, while 3-person families (169 | 18.4%) have the highest median income of $83,334 per family member.
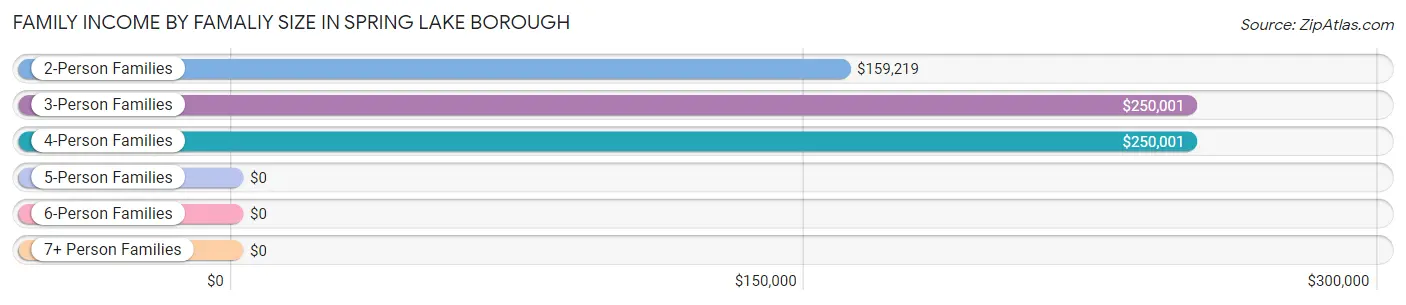
| Income Bracket | # Families | Median Income |
| 2-Person Families | 615 (67.1%) | $159,219 |
| 3-Person Families | 169 (18.4%) | $250,001 |
| 4-Person Families | 79 (8.6%) | $250,001 |
| 5-Person Families | 24 (2.6%) | $0 |
| 6-Person Families | 29 (3.2%) | $0 |
| 7+ Person Families | 0 (0.0%) | $0 |
| Total | 916 (100.0%) | $219,286 |
Family Income by Number of Earners in Spring Lake borough
The median family income in Spring Lake borough is $219,286, with families comprising 2 earners (258) having the highest median family income of $250,001, while families with no earners (321) have the lowest median family income of $111,705, accounting for 28.2% and 35.0% of families, respectively.
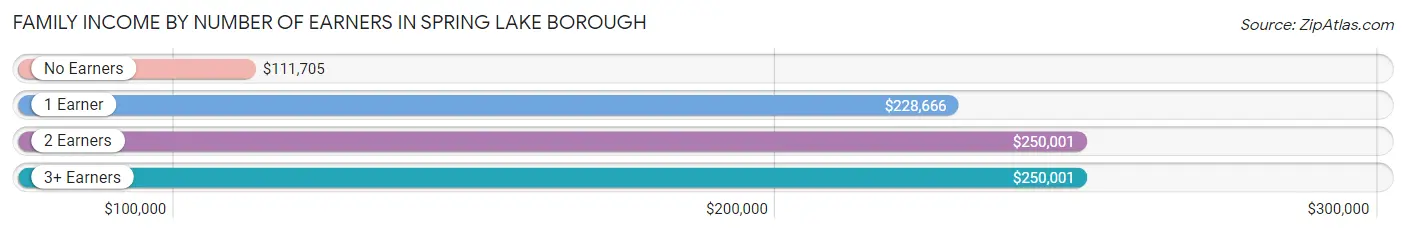
| Number of Earners | # Families | Median Income |
| No Earners | 321 (35.0%) | $111,705 |
| 1 Earner | 255 (27.8%) | $228,666 |
| 2 Earners | 258 (28.2%) | $250,001 |
| 3+ Earners | 82 (8.9%) | $250,001 |
| Total | 916 (100.0%) | $219,286 |
Household Income in Spring Lake borough
Household Income Brackets in Spring Lake borough
With 547 households falling in the category, the $200,000+ income range is the most frequent in Spring Lake borough, accounting for 43.1% of all households. In contrast, only 10 households (0.8%) fall into the $15,000 to $24,999 income bracket, making it the least populous group.
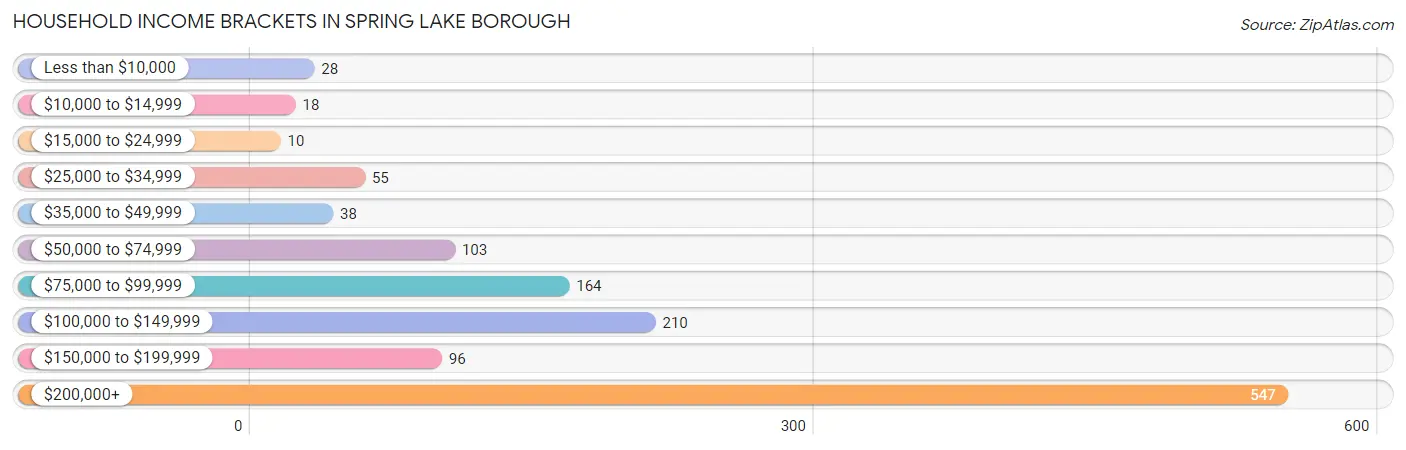
| Income Bracket | # Households | % Households |
| Less than $10,000 | 28 | 2.2% |
| $10,000 to $14,999 | 18 | 1.4% |
| $15,000 to $24,999 | 10 | 0.8% |
| $25,000 to $34,999 | 55 | 4.3% |
| $35,000 to $49,999 | 38 | 3.0% |
| $50,000 to $74,999 | 103 | 8.1% |
| $75,000 to $99,999 | 164 | 12.9% |
| $100,000 to $149,999 | 210 | 16.6% |
| $150,000 to $199,999 | 96 | 7.6% |
| $200,000+ | 547 | 43.1% |
Household Income by Householder Age in Spring Lake borough
The median household income in Spring Lake borough is $157,250, with the highest median household income of $246,125 found in the 45 to 64 years age bracket for the primary householder. A total of 579 households (45.7%) fall into this category.
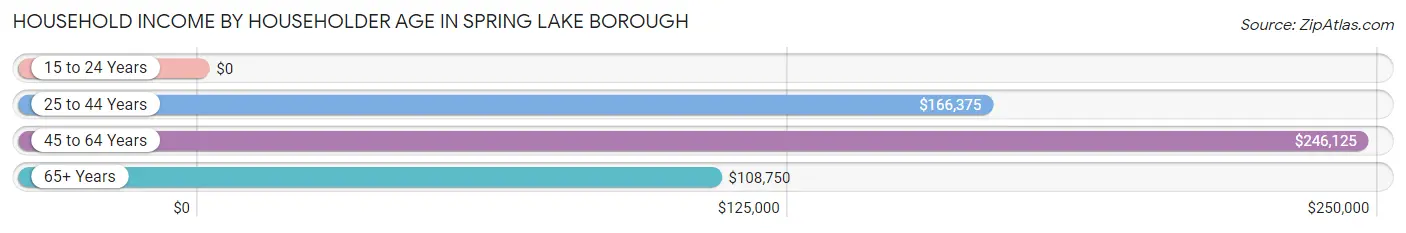
| Income Bracket | # Households | Median Income |
| 15 to 24 Years | 0 (0.0%) | $0 |
| 25 to 44 Years | 59 (4.6%) | $166,375 |
| 45 to 64 Years | 579 (45.7%) | $246,125 |
| 65+ Years | 630 (49.7%) | $108,750 |
| Total | 1,268 (100.0%) | $157,250 |
Poverty in Spring Lake borough
Income Below Poverty by Sex and Age in Spring Lake borough
With 2.9% poverty level for males and 4.1% for females among the residents of Spring Lake borough, 55 to 64 year old males and 75 year old and over females are the most vulnerable to poverty, with 21 males (7.1%) and 13 females (5.9%) in their respective age groups living below the poverty level.
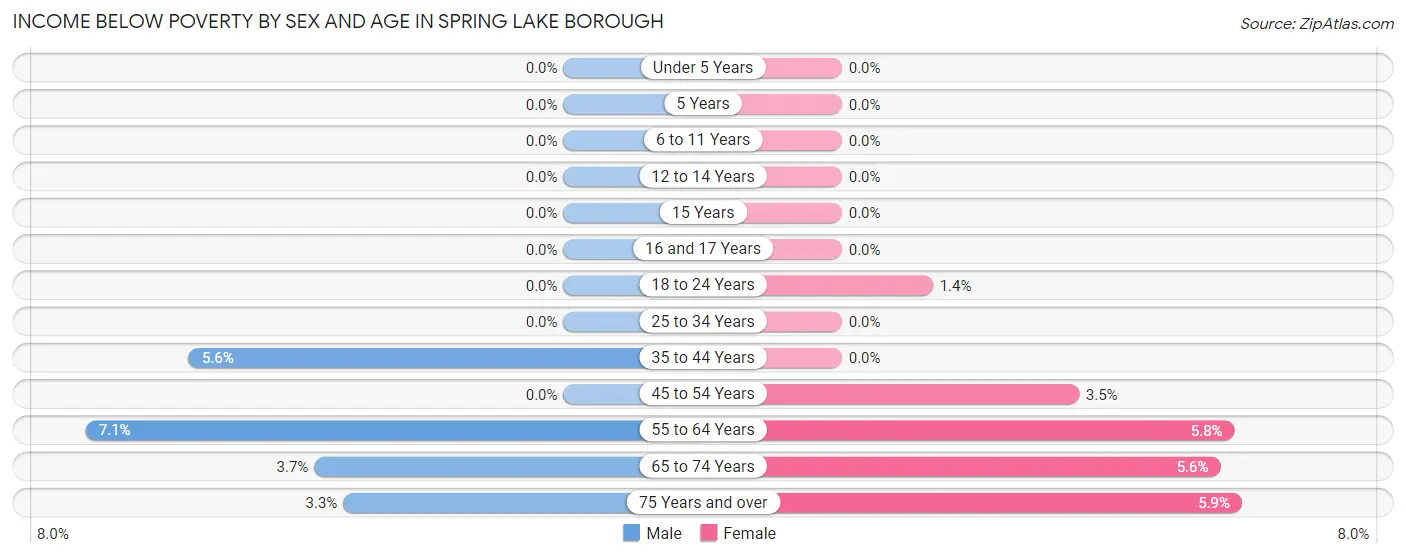
| Age Bracket | Male | Female |
| Under 5 Years | 0 (0.0%) | 0 (0.0%) |
| 5 Years | 0 (0.0%) | 0 (0.0%) |
| 6 to 11 Years | 0 (0.0%) | 0 (0.0%) |
| 12 to 14 Years | 0 (0.0%) | 0 (0.0%) |
| 15 Years | 0 (0.0%) | 0 (0.0%) |
| 16 and 17 Years | 0 (0.0%) | 0 (0.0%) |
| 18 to 24 Years | 0 (0.0%) | 1 (1.3%) |
| 25 to 34 Years | 0 (0.0%) | 0 (0.0%) |
| 35 to 44 Years | 1 (5.6%) | 0 (0.0%) |
| 45 to 54 Years | 0 (0.0%) | 8 (3.5%) |
| 55 to 64 Years | 21 (7.1%) | 19 (5.8%) |
| 65 to 74 Years | 10 (3.7%) | 18 (5.6%) |
| 75 Years and over | 8 (3.3%) | 13 (5.9%) |
| Total | 40 (2.9%) | 59 (4.1%) |
Income Above Poverty by Sex and Age in Spring Lake borough
According to the poverty statistics in Spring Lake borough, males aged under 5 years and females aged under 5 years are the age groups that are most secure financially, with 100.0% of males and 100.0% of females in these age groups living above the poverty line.
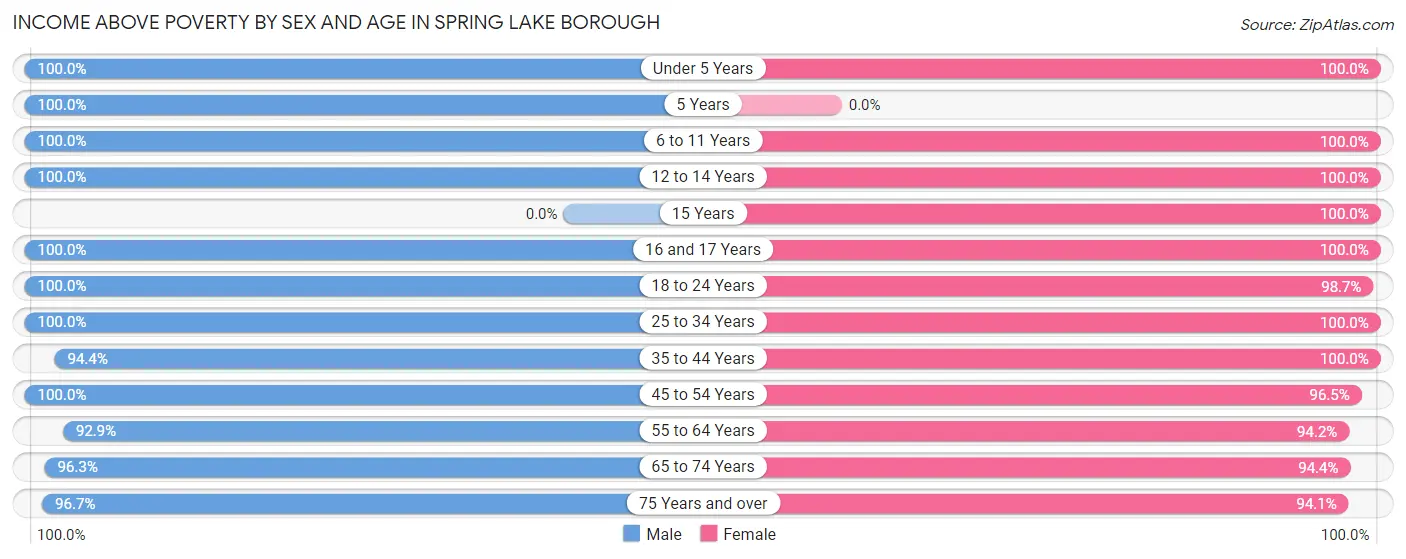
| Age Bracket | Male | Female |
| Under 5 Years | 19 (100.0%) | 36 (100.0%) |
| 5 Years | 32 (100.0%) | 0 (0.0%) |
| 6 to 11 Years | 58 (100.0%) | 58 (100.0%) |
| 12 to 14 Years | 26 (100.0%) | 23 (100.0%) |
| 15 Years | 0 (0.0%) | 18 (100.0%) |
| 16 and 17 Years | 41 (100.0%) | 35 (100.0%) |
| 18 to 24 Years | 65 (100.0%) | 73 (98.7%) |
| 25 to 34 Years | 53 (100.0%) | 70 (100.0%) |
| 35 to 44 Years | 17 (94.4%) | 27 (100.0%) |
| 45 to 54 Years | 232 (100.0%) | 219 (96.5%) |
| 55 to 64 Years | 275 (92.9%) | 307 (94.2%) |
| 65 to 74 Years | 260 (96.3%) | 302 (94.4%) |
| 75 Years and over | 237 (96.7%) | 206 (94.1%) |
| Total | 1,315 (97.1%) | 1,374 (95.9%) |
Income Below Poverty Among Married-Couple Families in Spring Lake borough
The poverty statistics for married-couple families in Spring Lake borough show that 4.3% or 37 of the total 853 families live below the poverty line. Families with no children have the highest poverty rate of 5.5%, comprising of 37 families. On the other hand, families with 1 or 2 children have the lowest poverty rate of 0.0%, which includes 0 families.
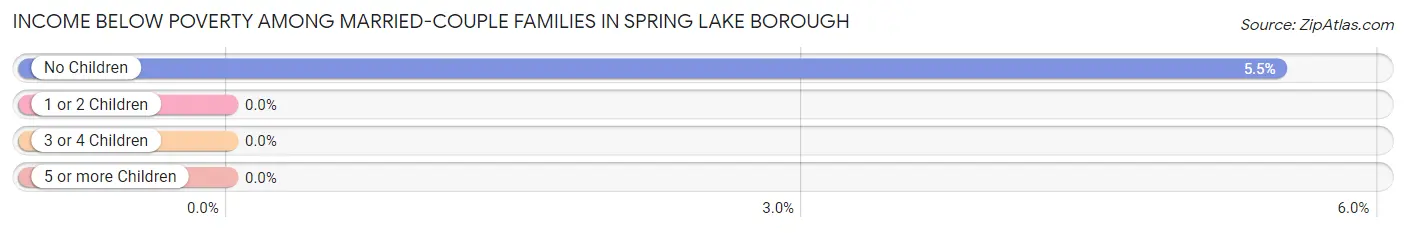
| Children | Above Poverty | Below Poverty |
| No Children | 638 (94.5%) | 37 (5.5%) |
| 1 or 2 Children | 149 (100.0%) | 0 (0.0%) |
| 3 or 4 Children | 29 (100.0%) | 0 (0.0%) |
| 5 or more Children | 0 (0.0%) | 0 (0.0%) |
| Total | 816 (95.7%) | 37 (4.3%) |
Income Below Poverty Among Single-Parent Households in Spring Lake borough
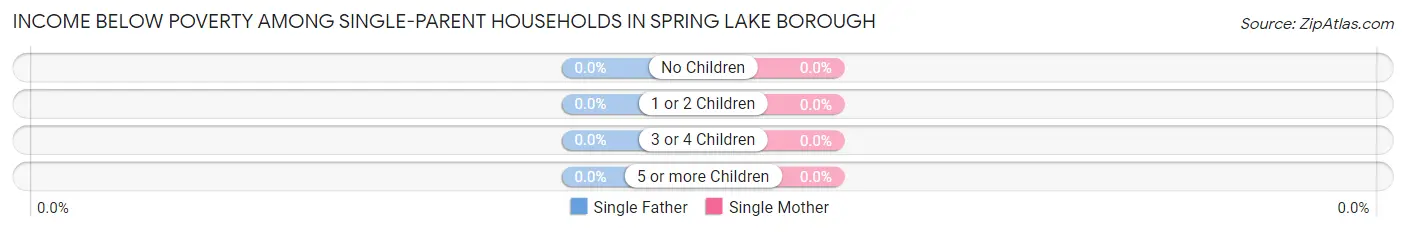
| Children | Single Father | Single Mother |
| No Children | 0 (0.0%) | 0 (0.0%) |
| 1 or 2 Children | 0 (0.0%) | 0 (0.0%) |
| 3 or 4 Children | 0 (0.0%) | 0 (0.0%) |
| 5 or more Children | 0 (0.0%) | 0 (0.0%) |
| Total | 0 (0.0%) | 0 (0.0%) |
Income Below Poverty Among Married-Couple vs Single-Parent Households in Spring Lake borough
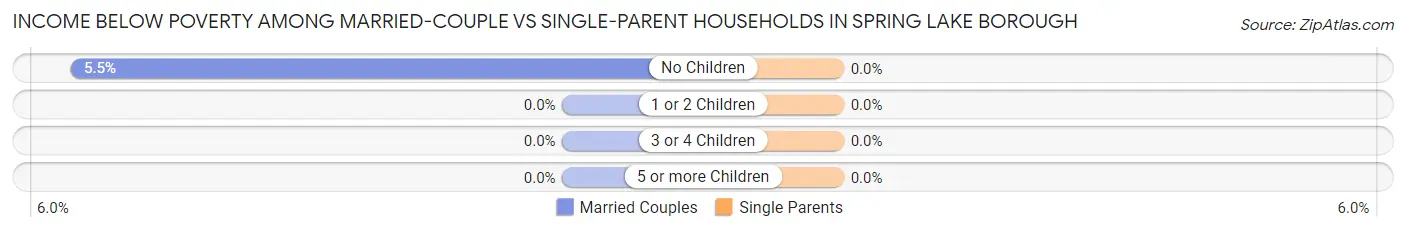
| Children | Married-Couple Families | Single-Parent Households |
| No Children | 37 (5.5%) | 0 (0.0%) |
| 1 or 2 Children | 0 (0.0%) | 0 (0.0%) |
| 3 or 4 Children | 0 (0.0%) | 0 (0.0%) |
| 5 or more Children | 0 (0.0%) | 0 (0.0%) |
| Total | 37 (4.3%) | 0 (0.0%) |
Race in Spring Lake borough
The most populous races in Spring Lake borough are White / Caucasian (2,565 | 92.0%), Asian (112 | 4.0%), and Two or more Races (106 | 3.8%).
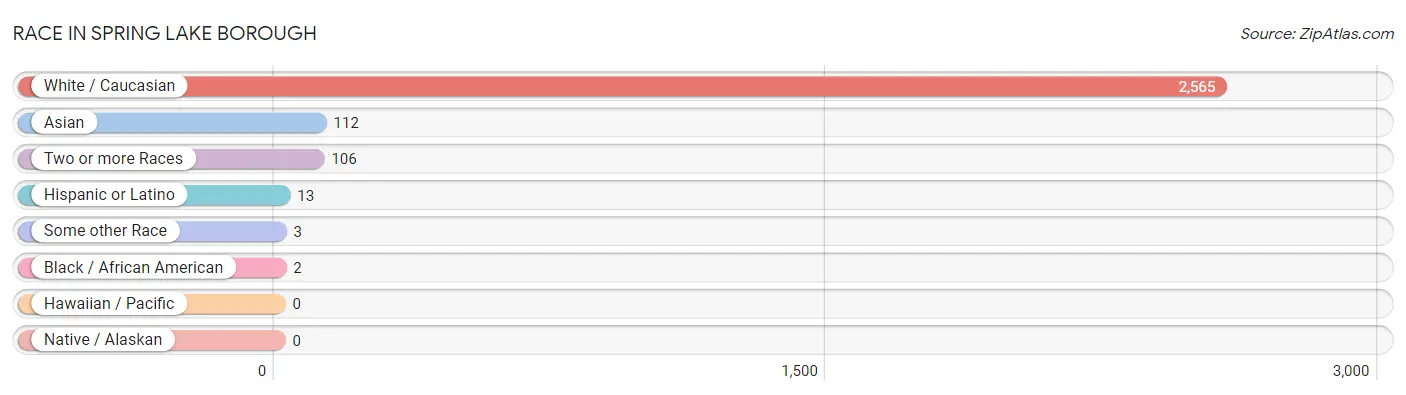
| Race | # Population | % Population |
| Asian | 112 | 4.0% |
| Black / African American | 2 | 0.1% |
| Hawaiian / Pacific | 0 | 0.0% |
| Hispanic or Latino | 13 | 0.5% |
| Native / Alaskan | 0 | 0.0% |
| White / Caucasian | 2,565 | 92.0% |
| Two or more Races | 106 | 3.8% |
| Some other Race | 3 | 0.1% |
| Total | 2,788 | 100.0% |
Ancestry in Spring Lake borough
The most populous ancestries reported in Spring Lake borough are Irish (977 | 35.0%), Italian (652 | 23.4%), German (331 | 11.9%), English (204 | 7.3%), and Polish (142 | 5.1%), together accounting for 82.7% of all Spring Lake borough residents.
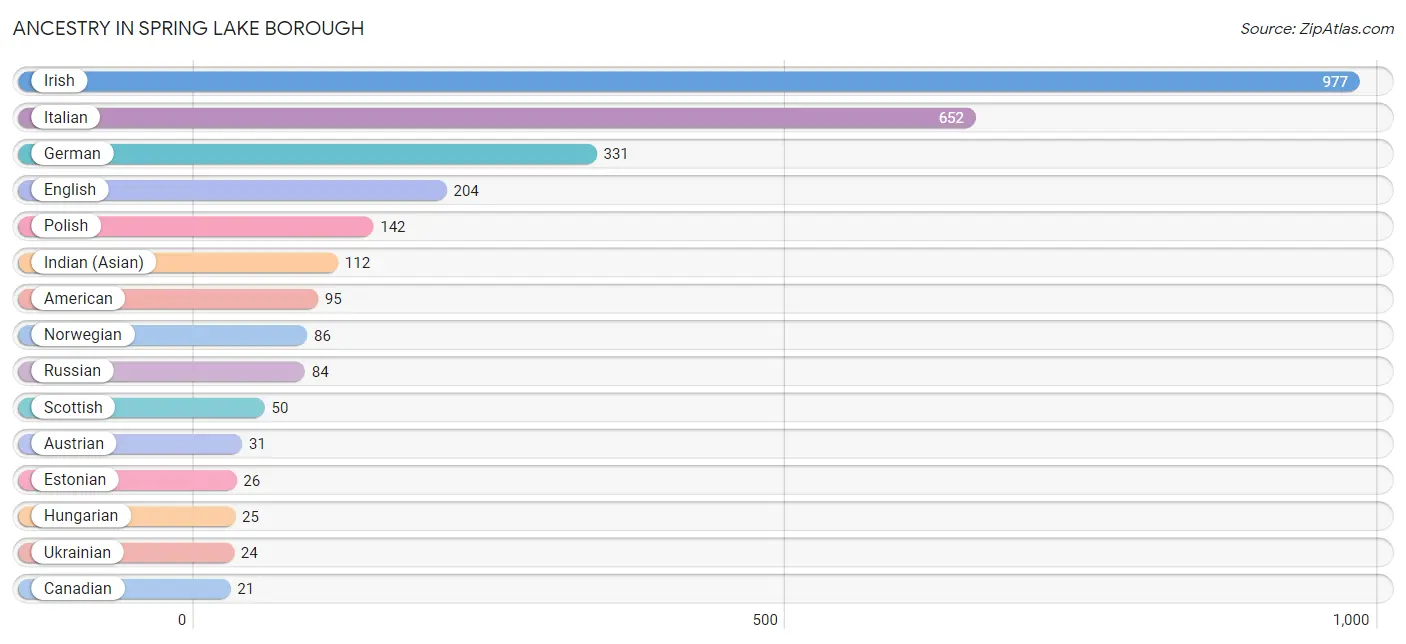
| Ancestry | # Population | % Population |
| American | 95 | 3.4% |
| Australian | 20 | 0.7% |
| Austrian | 31 | 1.1% |
| Brazilian | 10 | 0.4% |
| British | 17 | 0.6% |
| Canadian | 21 | 0.7% |
| Colombian | 3 | 0.1% |
| Croatian | 13 | 0.5% |
| Eastern European | 16 | 0.6% |
| English | 204 | 7.3% |
| Estonian | 26 | 0.9% |
| European | 19 | 0.7% |
| French | 11 | 0.4% |
| German | 331 | 11.9% |
| Greek | 9 | 0.3% |
| Guyanese | 19 | 0.7% |
| Hungarian | 25 | 0.9% |
| Indian (Asian) | 112 | 4.0% |
| Irish | 977 | 35.0% |
| Italian | 652 | 23.4% |
| Lithuanian | 19 | 0.7% |
| Maltese | 14 | 0.5% |
| Norwegian | 86 | 3.1% |
| Polish | 142 | 5.1% |
| Puerto Rican | 9 | 0.3% |
| Russian | 84 | 3.0% |
| Scotch-Irish | 14 | 0.5% |
| Scottish | 50 | 1.8% |
| South American | 3 | 0.1% |
| Swedish | 6 | 0.2% |
| Swiss | 19 | 0.7% |
| Ukrainian | 24 | 0.9% |
| Welsh | 11 | 0.4% | View All 33 Rows |
Immigrants in Spring Lake borough
The most numerous immigrant groups reported in Spring Lake borough came from Europe (30 | 1.1%), Latin America (30 | 1.1%), South America (30 | 1.1%), Australia (20 | 0.7%), and Oceania (20 | 0.7%), together accounting for 4.7% of all Spring Lake borough residents.
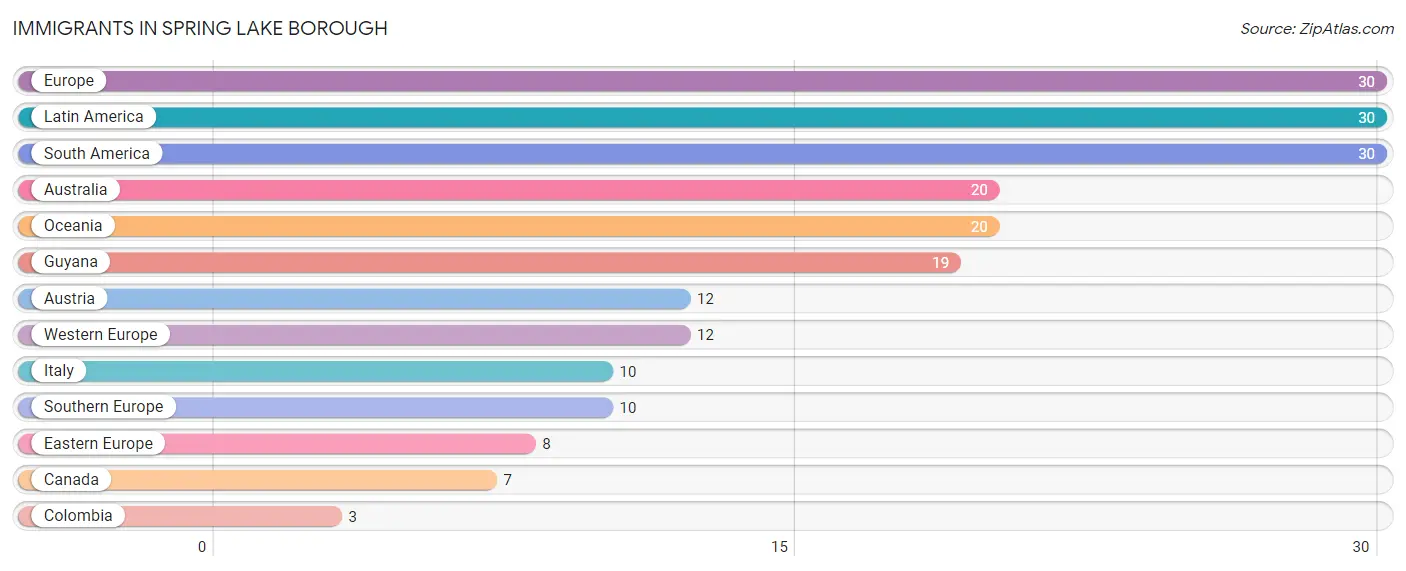
| Immigration Origin | # Population | % Population |
| Australia | 20 | 0.7% |
| Austria | 12 | 0.4% |
| Canada | 7 | 0.3% |
| Colombia | 3 | 0.1% |
| Eastern Europe | 8 | 0.3% |
| Europe | 30 | 1.1% |
| Guyana | 19 | 0.7% |
| Italy | 10 | 0.4% |
| Latin America | 30 | 1.1% |
| Oceania | 20 | 0.7% |
| South America | 30 | 1.1% |
| Southern Europe | 10 | 0.4% |
| Western Europe | 12 | 0.4% | View All 13 Rows |
Sex and Age in Spring Lake borough
Sex and Age in Spring Lake borough
The most populous age groups in Spring Lake borough are 50 to 54 Years (177 | 13.1%) for men and 55 to 59 Years (202 | 14.1%) for women.
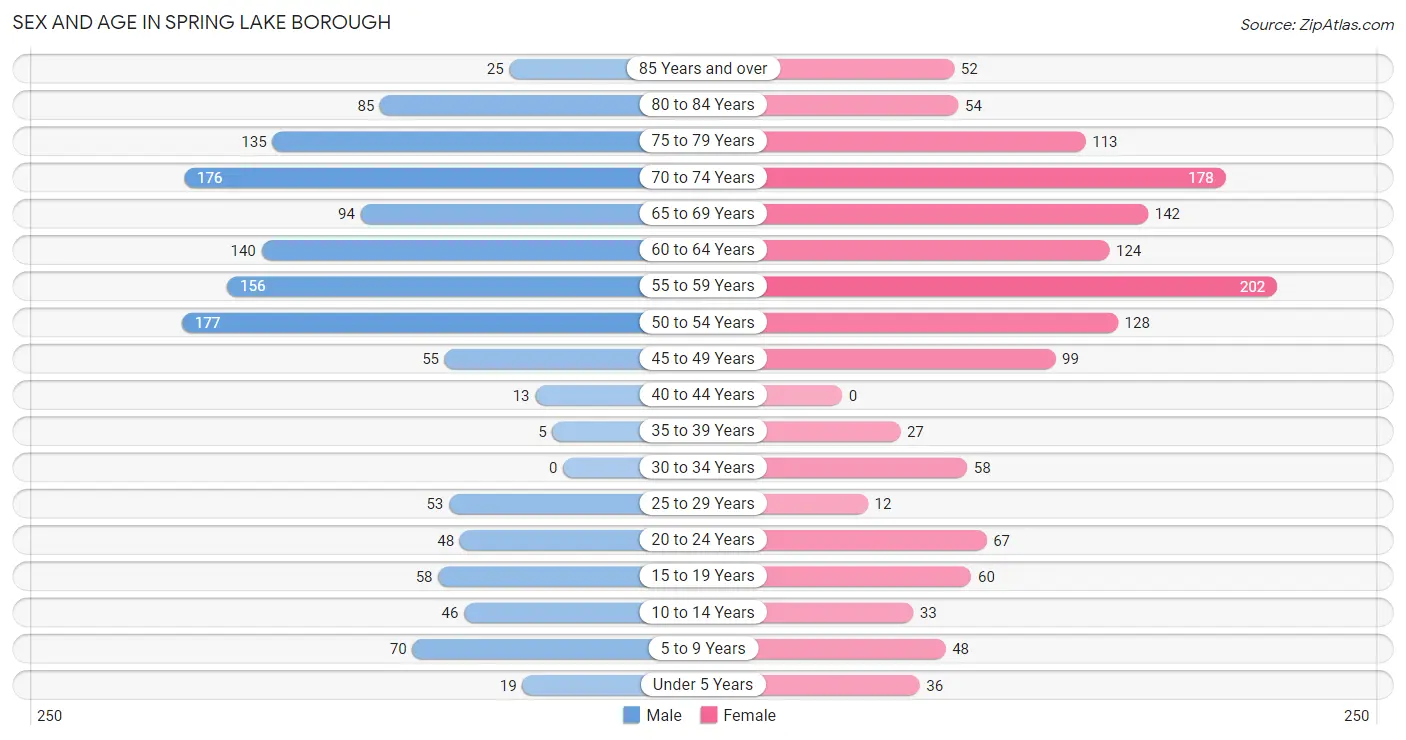
| Age Bracket | Male | Female |
| Under 5 Years | 19 (1.4%) | 36 (2.5%) |
| 5 to 9 Years | 70 (5.2%) | 48 (3.4%) |
| 10 to 14 Years | 46 (3.4%) | 33 (2.3%) |
| 15 to 19 Years | 58 (4.3%) | 60 (4.2%) |
| 20 to 24 Years | 48 (3.5%) | 67 (4.7%) |
| 25 to 29 Years | 53 (3.9%) | 12 (0.8%) |
| 30 to 34 Years | 0 (0.0%) | 58 (4.1%) |
| 35 to 39 Years | 5 (0.4%) | 27 (1.9%) |
| 40 to 44 Years | 13 (1.0%) | 0 (0.0%) |
| 45 to 49 Years | 55 (4.1%) | 99 (6.9%) |
| 50 to 54 Years | 177 (13.1%) | 128 (8.9%) |
| 55 to 59 Years | 156 (11.5%) | 202 (14.1%) |
| 60 to 64 Years | 140 (10.3%) | 124 (8.6%) |
| 65 to 69 Years | 94 (6.9%) | 142 (9.9%) |
| 70 to 74 Years | 176 (13.0%) | 178 (12.4%) |
| 75 to 79 Years | 135 (10.0%) | 113 (7.9%) |
| 80 to 84 Years | 85 (6.3%) | 54 (3.8%) |
| 85 Years and over | 25 (1.8%) | 52 (3.6%) |
| Total | 1,355 (100.0%) | 1,433 (100.0%) |
Families and Households in Spring Lake borough
Median Family Size in Spring Lake borough
The median family size in Spring Lake borough is 2.61 persons per family, with married-couple families (853 | 93.1%) accounting for the largest median family size of 2.64 persons per family. On the other hand, single female/mother families (48 | 5.2%) represent the smallest median family size with 2.15 persons per family.
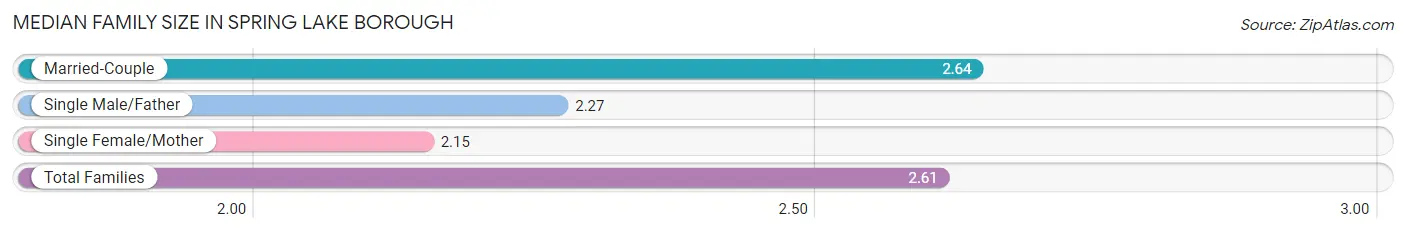
| Family Type | # Families | Family Size |
| Married-Couple | 853 (93.1%) | 2.64 |
| Single Male/Father | 15 (1.6%) | 2.27 |
| Single Female/Mother | 48 (5.2%) | 2.15 |
| Total Families | 916 (100.0%) | 2.61 |
Median Household Size in Spring Lake borough
The median household size in Spring Lake borough is 2.19 persons per household, with single male/father households (15 | 1.2%) accounting for the largest median household size of 2.8 persons per household. non-family households (352 | 27.8%) represent the smallest median household size with 1.05 persons per household.
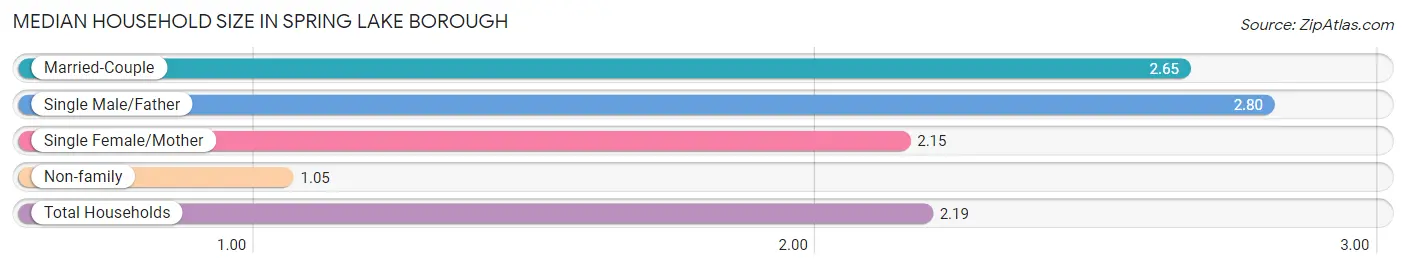
| Household Type | # Households | Household Size |
| Married-Couple | 853 (67.3%) | 2.65 |
| Single Male/Father | 15 (1.2%) | 2.80 |
| Single Female/Mother | 48 (3.8%) | 2.15 |
| Non-family | 352 (27.8%) | 1.05 |
| Total Households | 1,268 (100.0%) | 2.19 |
Household Size by Marriage Status in Spring Lake borough
Out of a total of 1,268 households in Spring Lake borough, 916 (72.2%) are family households, while 352 (27.8%) are nonfamily households. The most numerous type of family households are 2-person households, comprising 606, and the most common type of nonfamily households are 1-person households, comprising 341.
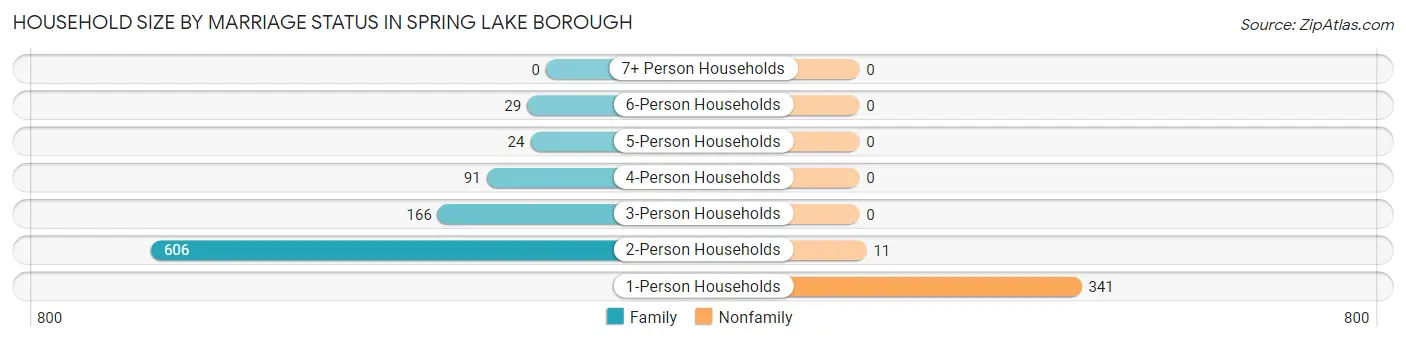
| Household Size | Family Households | Nonfamily Households |
| 1-Person Households | - | 341 (26.9%) |
| 2-Person Households | 606 (47.8%) | 11 (0.9%) |
| 3-Person Households | 166 (13.1%) | 0 (0.0%) |
| 4-Person Households | 91 (7.2%) | 0 (0.0%) |
| 5-Person Households | 24 (1.9%) | 0 (0.0%) |
| 6-Person Households | 29 (2.3%) | 0 (0.0%) |
| 7+ Person Households | 0 (0.0%) | 0 (0.0%) |
| Total | 916 (72.2%) | 352 (27.8%) |
Female Fertility in Spring Lake borough
Fertility by Age in Spring Lake borough
Average fertility rate in Spring Lake borough is 31.0 births per 1,000 women. Women in the age bracket of 35 to 50 years have the highest fertility rate with 77.0 births per 1,000 women. Women in the age bracket of 35 to 50 years acount for 100.0% of all women with births.
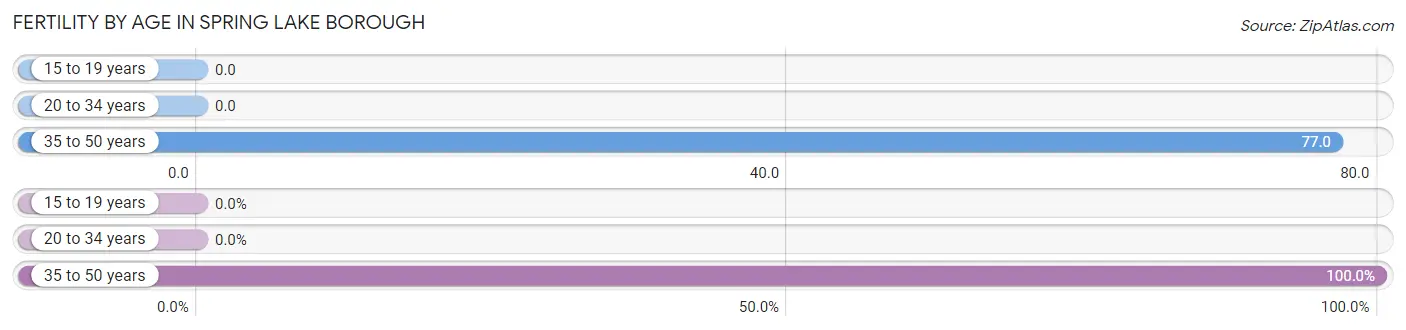
| Age Bracket | Women with Births | Births / 1,000 Women |
| 15 to 19 years | 0 (0.0%) | 0.0 |
| 20 to 34 years | 0 (0.0%) | 0.0 |
| 35 to 50 years | 10 (100.0%) | 77.0 |
| Total | 10 (100.0%) | 31.0 |
Fertility by Age by Marriage Status in Spring Lake borough
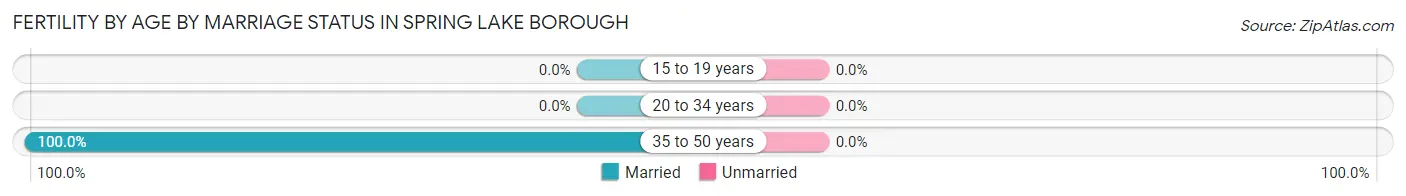
| Age Bracket | Married | Unmarried |
| 15 to 19 years | 0 (0.0%) | 0 (0.0%) |
| 20 to 34 years | 0 (0.0%) | 0 (0.0%) |
| 35 to 50 years | 10 (100.0%) | 0 (0.0%) |
| Total | 10 (100.0%) | 0 (0.0%) |
Fertility by Education in Spring Lake borough
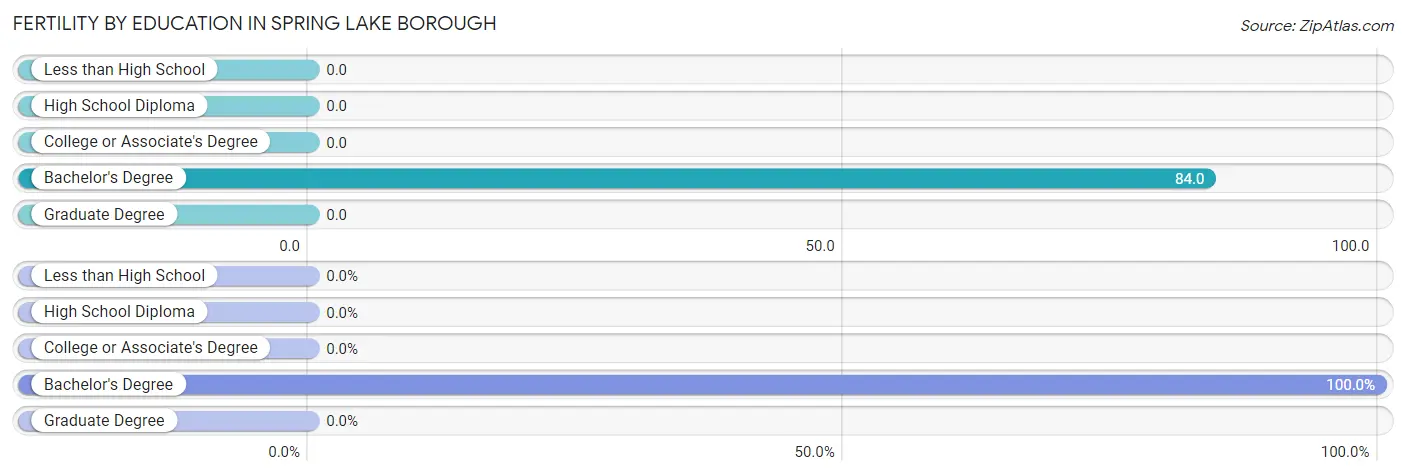
| Educational Attainment | Women with Births | Births / 1,000 Women |
| Less than High School | 0 (0.0%) | 0.0 |
| High School Diploma | 0 (0.0%) | 0.0 |
| College or Associate's Degree | 0 (0.0%) | 0.0 |
| Bachelor's Degree | 10 (100.0%) | 84.0 |
| Graduate Degree | 0 (0.0%) | 0.0 |
| Total | 10 (100.0%) | 31.0 |
Fertility by Education by Marriage Status in Spring Lake borough
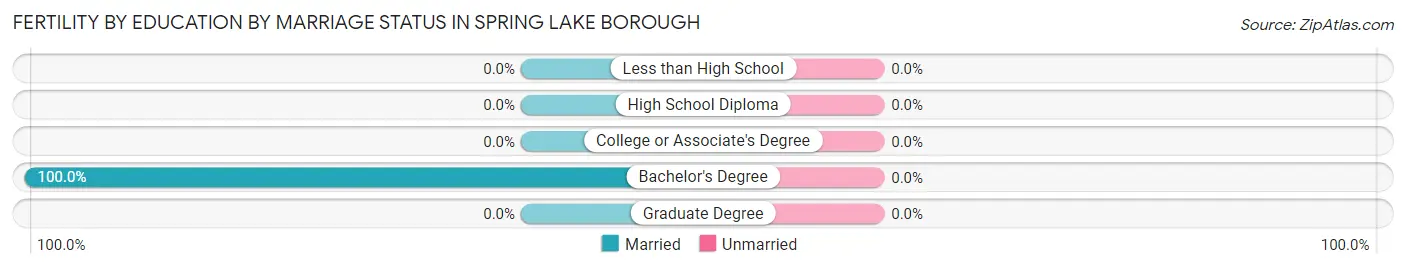
| Educational Attainment | Married | Unmarried |
| Less than High School | 0 (0.0%) | 0 (0.0%) |
| High School Diploma | 0 (0.0%) | 0 (0.0%) |
| College or Associate's Degree | 0 (0.0%) | 0 (0.0%) |
| Bachelor's Degree | 10 (100.0%) | 0 (0.0%) |
| Graduate Degree | 0 (0.0%) | 0 (0.0%) |
| Total | 10 (100.0%) | 0 (0.0%) |
Employment Characteristics in Spring Lake borough
Employment by Class of Employer in Spring Lake borough
Among the 1,054 employed individuals in Spring Lake borough, private company employees (659 | 62.5%), self-employed (not incorporated) (160 | 15.2%), and self-employed (incorporated) (116 | 11.0%) make up the most common classes of employment.
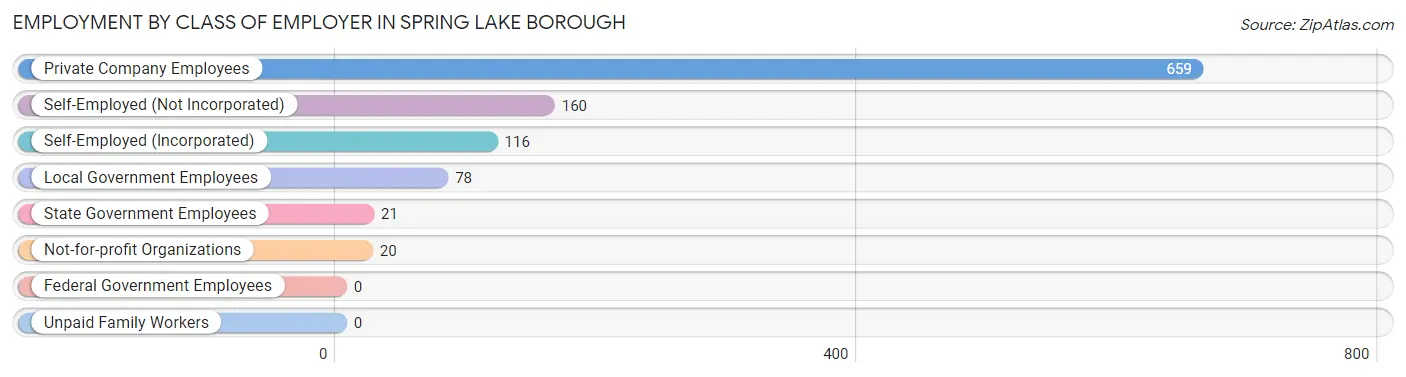
| Employer Class | # Employees | % Employees |
| Private Company Employees | 659 | 62.5% |
| Self-Employed (Incorporated) | 116 | 11.0% |
| Self-Employed (Not Incorporated) | 160 | 15.2% |
| Not-for-profit Organizations | 20 | 1.9% |
| Local Government Employees | 78 | 7.4% |
| State Government Employees | 21 | 2.0% |
| Federal Government Employees | 0 | 0.0% |
| Unpaid Family Workers | 0 | 0.0% |
| Total | 1,054 | 100.0% |
Employment Status by Age in Spring Lake borough
According to the labor force statistics for Spring Lake borough, out of the total population over 16 years of age (2,518), 43.0% or 1,083 individuals are in the labor force, with 2.6% or 28 of them unemployed. The age group with the highest labor force participation rate is 25 to 29 years, with 100.0% or 65 individuals in the labor force. Within the labor force, the 25 to 29 years age range has the highest percentage of unemployed individuals, with 18.5% or 12 of them being unemployed.
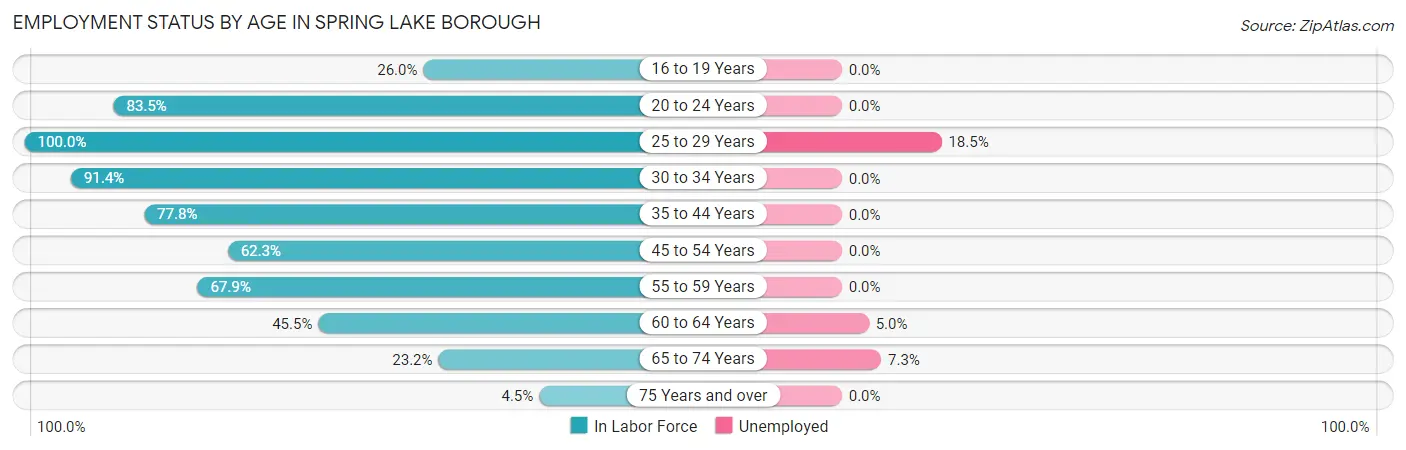
| Age Bracket | In Labor Force | Unemployed |
| 16 to 19 Years | 26 (26.0%) | 0 (0.0%) |
| 20 to 24 Years | 96 (83.5%) | 0 (0.0%) |
| 25 to 29 Years | 65 (100.0%) | 12 (18.5%) |
| 30 to 34 Years | 53 (91.4%) | 0 (0.0%) |
| 35 to 44 Years | 35 (77.8%) | 0 (0.0%) |
| 45 to 54 Years | 286 (62.3%) | 0 (0.0%) |
| 55 to 59 Years | 243 (67.9%) | 0 (0.0%) |
| 60 to 64 Years | 120 (45.5%) | 6 (5.0%) |
| 65 to 74 Years | 137 (23.2%) | 10 (7.3%) |
| 75 Years and over | 21 (4.5%) | 0 (0.0%) |
| Total | 1,083 (43.0%) | 28 (2.6%) |
Employment Status by Educational Attainment in Spring Lake borough
According to labor force statistics for Spring Lake borough, 64.2% of individuals (802) out of the total population between 25 and 64 years of age (1,249) are in the labor force, with 2.2% or 18 of them being unemployed. The group with the highest labor force participation rate are those with the educational attainment of less than high school, with 100.0% or 12 individuals in the labor force. Within the labor force, individuals with bachelor's degree or higher education have the highest percentage of unemployment, with 2.4% or 18 of them being unemployed.
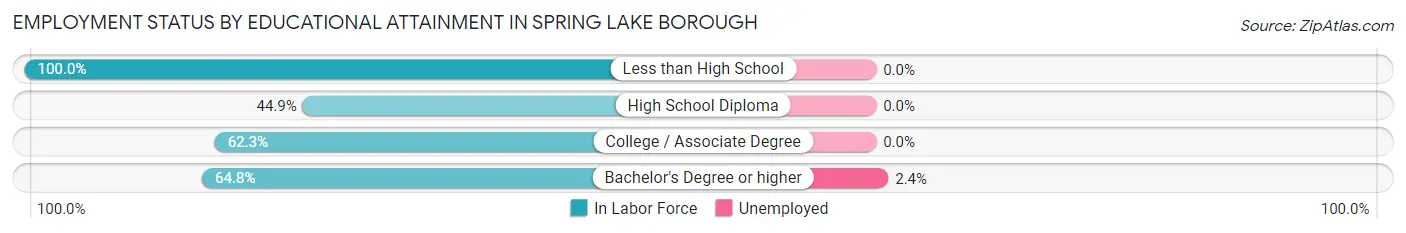
| Educational Attainment | In Labor Force | Unemployed |
| Less than High School | 12 (100.0%) | 0 (0.0%) |
| High School Diploma | 22 (44.9%) | 0 (0.0%) |
| College / Associate Degree | 33 (62.3%) | 0 (0.0%) |
| Bachelor's Degree or higher | 735 (64.8%) | 27 (2.4%) |
| Total | 802 (64.2%) | 27 (2.2%) |
Employment Occupations by Sex in Spring Lake borough
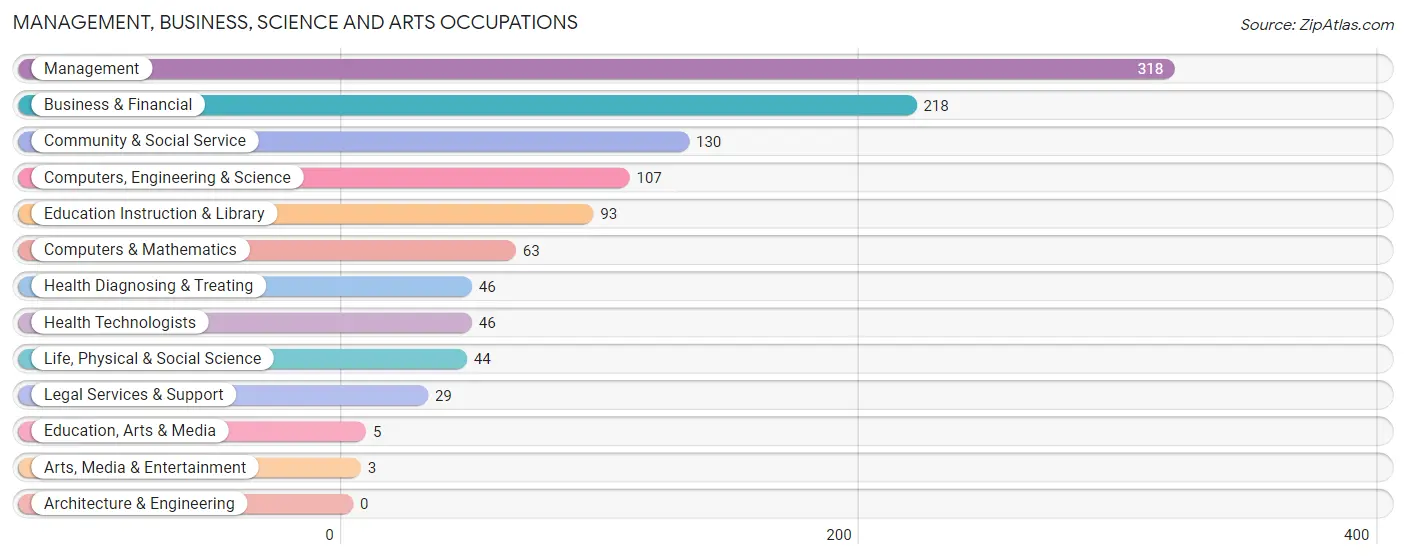
Management, Business, Science and Arts Occupations
The most common Management, Business, Science and Arts occupations in Spring Lake borough are Management (318 | 30.2%), Business & Financial (218 | 20.7%), Community & Social Service (130 | 12.3%), Computers, Engineering & Science (107 | 10.2%), and Education Instruction & Library (93 | 8.8%).
Management, Business, Science and Arts Occupations by Sex
Within the Management, Business, Science and Arts occupations in Spring Lake borough, the most male-oriented occupations are Computers & Mathematics (100.0%), Arts, Media & Entertainment (100.0%), and Legal Services & Support (69.0%), while the most female-oriented occupations are Education, Arts & Media (80.0%), Life, Physical & Social Science (79.5%), and Health Diagnosing & Treating (58.7%).
| Occupation | Male | Female |
| Management | 199 (62.6%) | 119 (37.4%) |
| Business & Financial | 132 (60.6%) | 86 (39.5%) |
| Computers, Engineering & Science | 72 (67.3%) | 35 (32.7%) |
| Computers & Mathematics | 63 (100.0%) | 0 (0.0%) |
| Architecture & Engineering | 0 (0.0%) | 0 (0.0%) |
| Life, Physical & Social Science | 9 (20.4%) | 35 (79.5%) |
| Community & Social Service | 65 (50.0%) | 65 (50.0%) |
| Education, Arts & Media | 1 (20.0%) | 4 (80.0%) |
| Legal Services & Support | 20 (69.0%) | 9 (31.0%) |
| Education Instruction & Library | 41 (44.1%) | 52 (55.9%) |
| Arts, Media & Entertainment | 3 (100.0%) | 0 (0.0%) |
| Health Diagnosing & Treating | 19 (41.3%) | 27 (58.7%) |
| Health Technologists | 19 (41.3%) | 27 (58.7%) |
| Total (Category) | 487 (59.5%) | 332 (40.5%) |
| Total (Overall) | 572 (54.3%) | 482 (45.7%) |
Services Occupations
The most common Services occupations in Spring Lake borough are Food Preparation & Serving (34 | 3.2%), Cleaning & Maintenance (9 | 0.9%), and Personal Care & Service (3 | 0.3%).
Services Occupations by Sex
Within the Services occupations in Spring Lake borough, the most male-oriented occupations are Personal Care & Service (100.0%), and Food Preparation & Serving (23.5%), while the most female-oriented occupations are Cleaning & Maintenance (100.0%), and Food Preparation & Serving (76.5%).
| Occupation | Male | Female |
| Healthcare Support | 0 (0.0%) | 0 (0.0%) |
| Security & Protection | 0 (0.0%) | 0 (0.0%) |
| Firefighting & Prevention | 0 (0.0%) | 0 (0.0%) |
| Law Enforcement | 0 (0.0%) | 0 (0.0%) |
| Food Preparation & Serving | 8 (23.5%) | 26 (76.5%) |
| Cleaning & Maintenance | 0 (0.0%) | 9 (100.0%) |
| Personal Care & Service | 3 (100.0%) | 0 (0.0%) |
| Total (Category) | 11 (23.9%) | 35 (76.1%) |
| Total (Overall) | 572 (54.3%) | 482 (45.7%) |
Sales and Office Occupations
The most common Sales and Office occupations in Spring Lake borough are Sales & Related (100 | 9.5%), and Office & Administration (30 | 2.9%).
Sales and Office Occupations by Sex
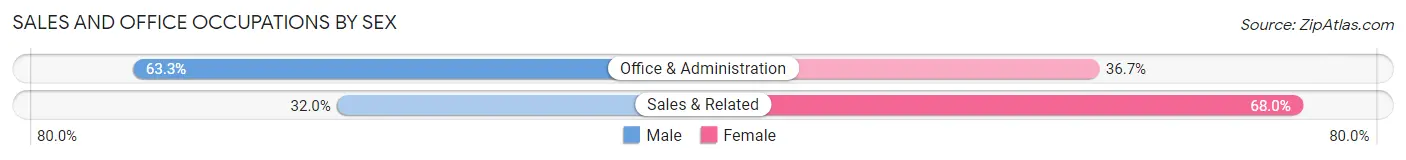
| Occupation | Male | Female |
| Sales & Related | 32 (32.0%) | 68 (68.0%) |
| Office & Administration | 19 (63.3%) | 11 (36.7%) |
| Total (Category) | 51 (39.2%) | 79 (60.8%) |
| Total (Overall) | 572 (54.3%) | 482 (45.7%) |
Natural Resources, Construction and Maintenance Occupations
The most common Natural Resources, Construction and Maintenance occupations in Spring Lake borough are Installation, Maintenance & Repair (16 | 1.5%), and Construction & Extraction (11 | 1.0%).
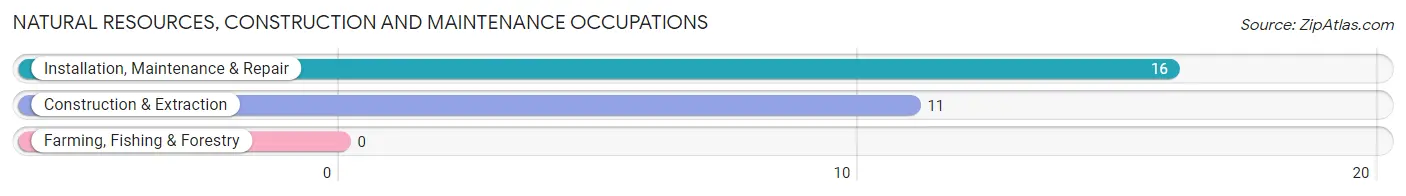
Natural Resources, Construction and Maintenance Occupations by Sex
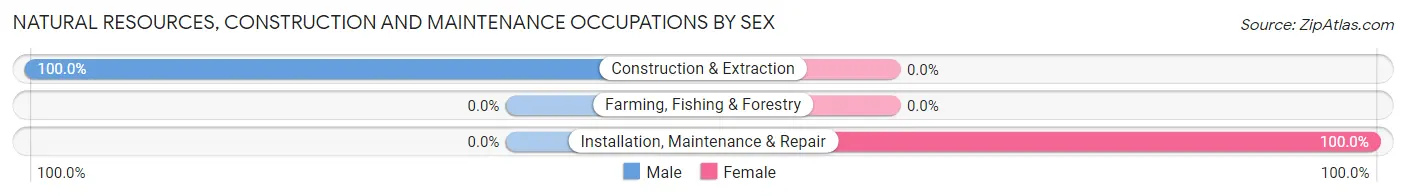
| Occupation | Male | Female |
| Farming, Fishing & Forestry | 0 (0.0%) | 0 (0.0%) |
| Construction & Extraction | 11 (100.0%) | 0 (0.0%) |
| Installation, Maintenance & Repair | 0 (0.0%) | 16 (100.0%) |
| Total (Category) | 11 (40.7%) | 16 (59.3%) |
| Total (Overall) | 572 (54.3%) | 482 (45.7%) |
Production, Transportation and Moving Occupations
The most common Production, Transportation and Moving occupations in Spring Lake borough are Transportation (12 | 1.1%), Material Moving (11 | 1.0%), and Production (9 | 0.9%).
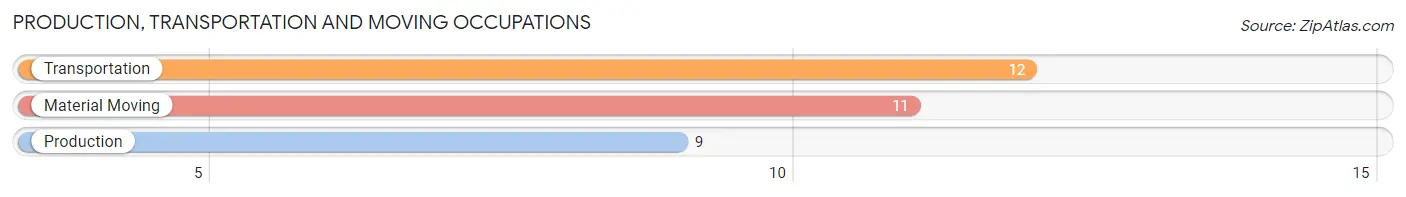
Production, Transportation and Moving Occupations by Sex
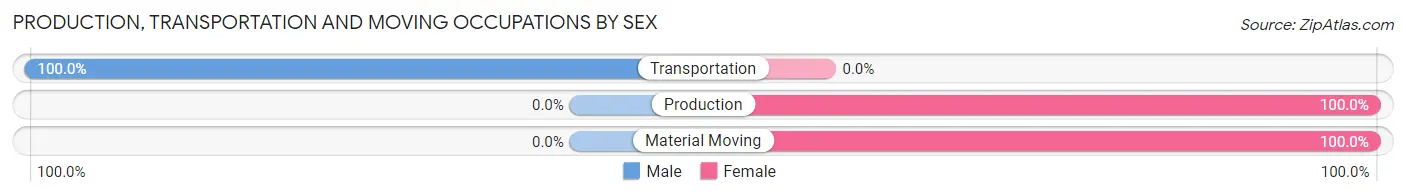
| Occupation | Male | Female |
| Production | 0 (0.0%) | 9 (100.0%) |
| Transportation | 12 (100.0%) | 0 (0.0%) |
| Material Moving | 0 (0.0%) | 11 (100.0%) |
| Total (Category) | 12 (37.5%) | 20 (62.5%) |
| Total (Overall) | 572 (54.3%) | 482 (45.7%) |
Employment Industries by Sex in Spring Lake borough
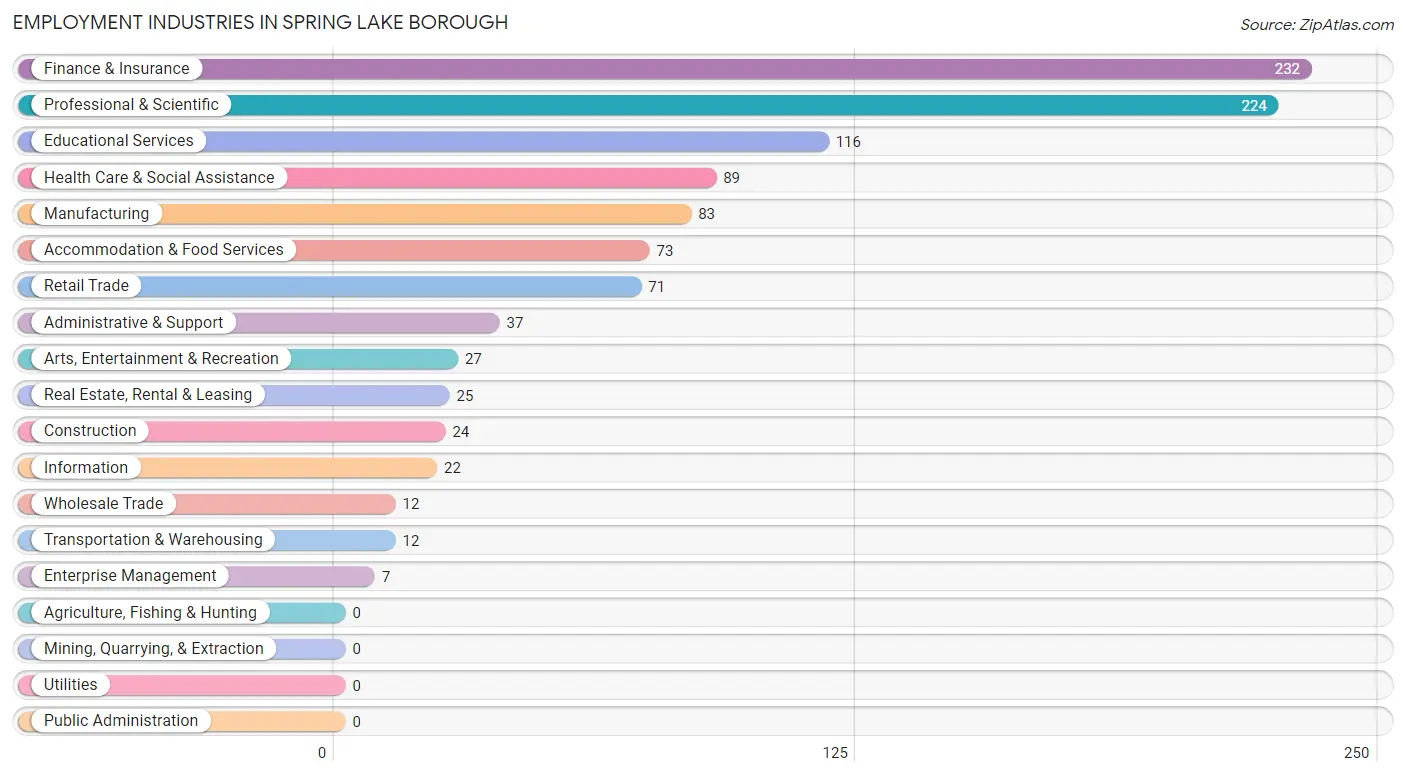
Employment Industries in Spring Lake borough
The major employment industries in Spring Lake borough include Finance & Insurance (232 | 22.0%), Professional & Scientific (224 | 21.2%), Educational Services (116 | 11.0%), Health Care & Social Assistance (89 | 8.4%), and Manufacturing (83 | 7.9%).
Employment Industries by Sex in Spring Lake borough
The Spring Lake borough industries that see more men than women are Construction (100.0%), Wholesale Trade (100.0%), and Transportation & Warehousing (100.0%), whereas the industries that tend to have a higher number of women are Real Estate, Rental & Leasing (88.0%), Retail Trade (87.3%), and Manufacturing (77.1%).
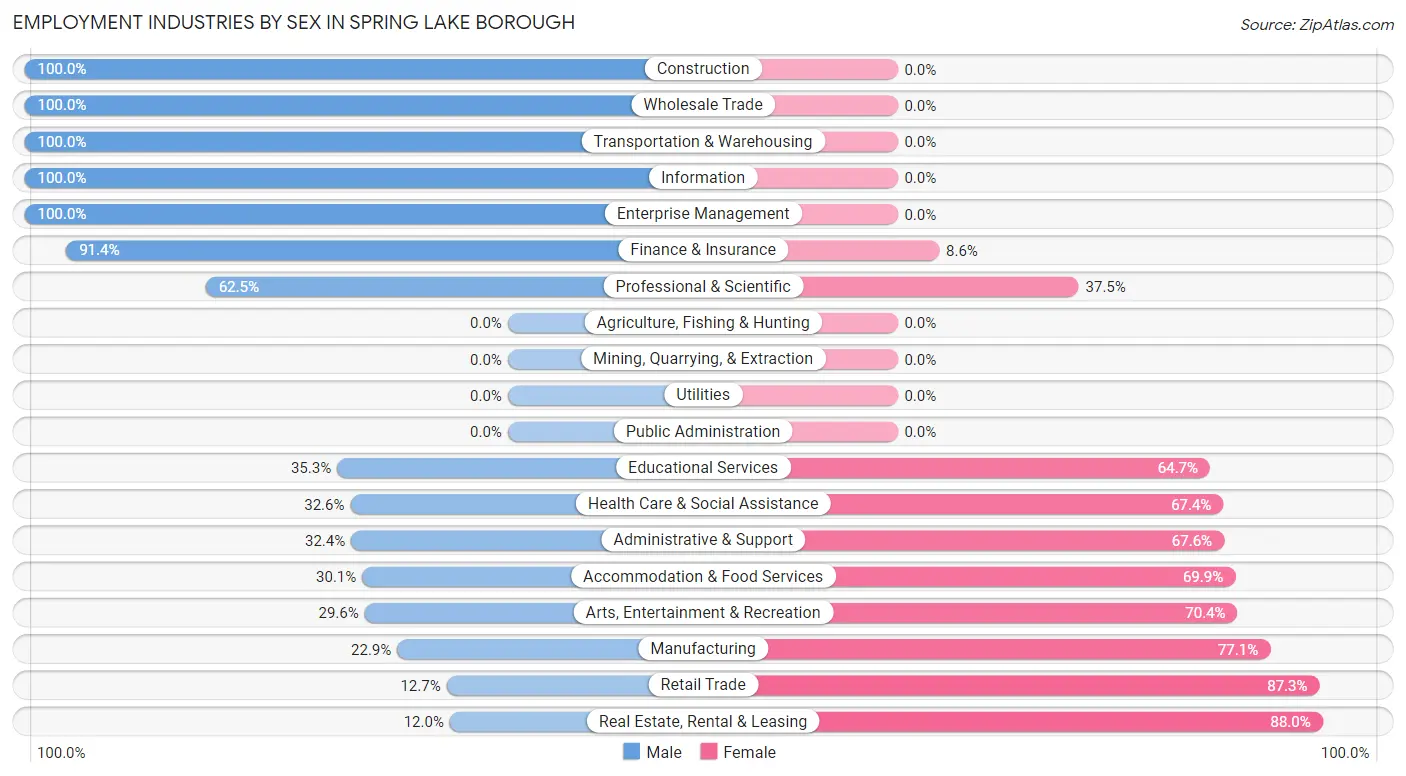
| Industry | Male | Female |
| Agriculture, Fishing & Hunting | 0 (0.0%) | 0 (0.0%) |
| Mining, Quarrying, & Extraction | 0 (0.0%) | 0 (0.0%) |
| Construction | 24 (100.0%) | 0 (0.0%) |
| Manufacturing | 19 (22.9%) | 64 (77.1%) |
| Wholesale Trade | 12 (100.0%) | 0 (0.0%) |
| Retail Trade | 9 (12.7%) | 62 (87.3%) |
| Transportation & Warehousing | 12 (100.0%) | 0 (0.0%) |
| Utilities | 0 (0.0%) | 0 (0.0%) |
| Information | 22 (100.0%) | 0 (0.0%) |
| Finance & Insurance | 212 (91.4%) | 20 (8.6%) |
| Real Estate, Rental & Leasing | 3 (12.0%) | 22 (88.0%) |
| Professional & Scientific | 140 (62.5%) | 84 (37.5%) |
| Enterprise Management | 7 (100.0%) | 0 (0.0%) |
| Administrative & Support | 12 (32.4%) | 25 (67.6%) |
| Educational Services | 41 (35.3%) | 75 (64.7%) |
| Health Care & Social Assistance | 29 (32.6%) | 60 (67.4%) |
| Arts, Entertainment & Recreation | 8 (29.6%) | 19 (70.4%) |
| Accommodation & Food Services | 22 (30.1%) | 51 (69.9%) |
| Public Administration | 0 (0.0%) | 0 (0.0%) |
| Total | 572 (54.3%) | 482 (45.7%) |
Education in Spring Lake borough
School Enrollment in Spring Lake borough
The most common levels of schooling among the 355 students in Spring Lake borough are high school (121 | 34.1%), elementary school (106 | 29.9%), and middle school (55 | 15.5%).
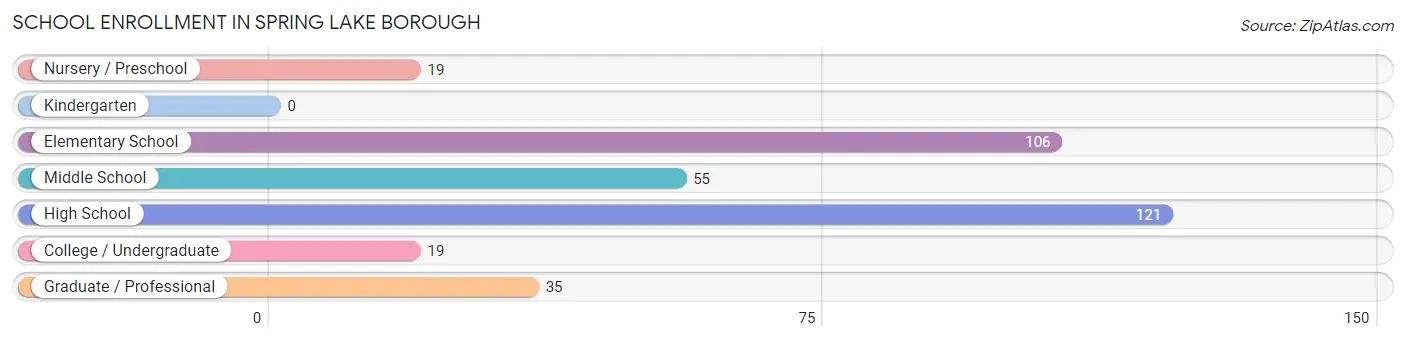
| School Level | # Students | % Students |
| Nursery / Preschool | 19 | 5.3% |
| Kindergarten | 0 | 0.0% |
| Elementary School | 106 | 29.9% |
| Middle School | 55 | 15.5% |
| High School | 121 | 34.1% |
| College / Undergraduate | 19 | 5.3% |
| Graduate / Professional | 35 | 9.9% |
| Total | 355 | 100.0% |
School Enrollment by Age by Funding Source in Spring Lake borough
Out of a total of 355 students who are enrolled in schools in Spring Lake borough, 149 (42.0%) attend a private institution, while the remaining 206 (58.0%) are enrolled in public schools. The age group of 25 to 34 year olds has the highest likelihood of being enrolled in private schools, with 17 (100.0% in the age bracket) enrolled. Conversely, the age group of 5 to 9 year old has the lowest likelihood of being enrolled in a private school, with 86 (81.9% in the age bracket) attending a public institution.
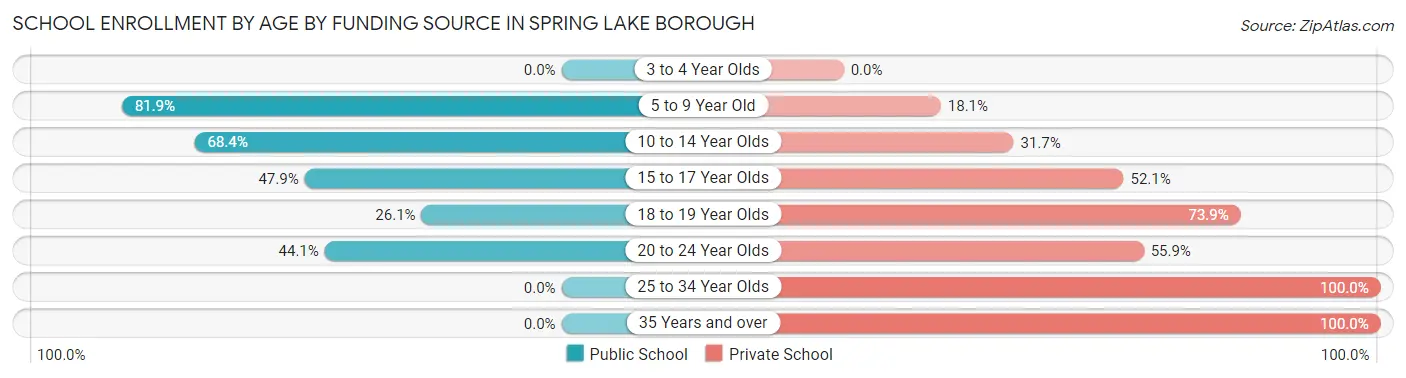
| Age Bracket | Public School | Private School |
| 3 to 4 Year Olds | 0 (0.0%) | 0 (0.0%) |
| 5 to 9 Year Old | 86 (81.9%) | 19 (18.1%) |
| 10 to 14 Year Olds | 54 (68.3%) | 25 (31.7%) |
| 15 to 17 Year Olds | 45 (47.9%) | 49 (52.1%) |
| 18 to 19 Year Olds | 6 (26.1%) | 17 (73.9%) |
| 20 to 24 Year Olds | 15 (44.1%) | 19 (55.9%) |
| 25 to 34 Year Olds | 0 (0.0%) | 17 (100.0%) |
| 35 Years and over | 0 (0.0%) | 3 (100.0%) |
| Total | 206 (58.0%) | 149 (42.0%) |
Educational Attainment by Field of Study in Spring Lake borough
Business (668 | 33.4%), social sciences (225 | 11.2%), education (190 | 9.5%), bio, nature & agricultural (174 | 8.7%), and engineering (118 | 5.9%) are the most common fields of study among 2,003 individuals in Spring Lake borough who have obtained a bachelor's degree or higher.
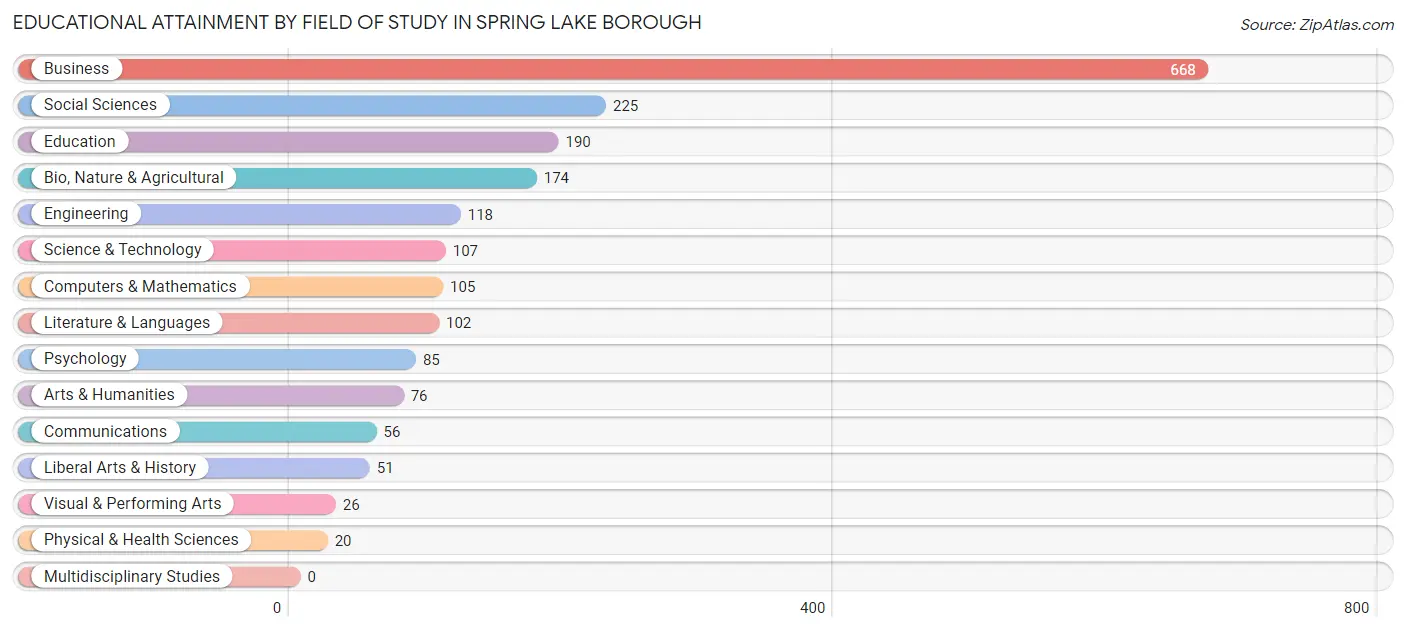
| Field of Study | # Graduates | % Graduates |
| Computers & Mathematics | 105 | 5.2% |
| Bio, Nature & Agricultural | 174 | 8.7% |
| Physical & Health Sciences | 20 | 1.0% |
| Psychology | 85 | 4.2% |
| Social Sciences | 225 | 11.2% |
| Engineering | 118 | 5.9% |
| Multidisciplinary Studies | 0 | 0.0% |
| Science & Technology | 107 | 5.3% |
| Business | 668 | 33.4% |
| Education | 190 | 9.5% |
| Literature & Languages | 102 | 5.1% |
| Liberal Arts & History | 51 | 2.5% |
| Visual & Performing Arts | 26 | 1.3% |
| Communications | 56 | 2.8% |
| Arts & Humanities | 76 | 3.8% |
| Total | 2,003 | 100.0% |
Transportation & Commute in Spring Lake borough
Vehicle Availability by Sex in Spring Lake borough
The most prevalent vehicle ownership categories in Spring Lake borough are males with 2 vehicles (315, accounting for 55.1%) and females with 2 vehicles (259, making up 65.3%).
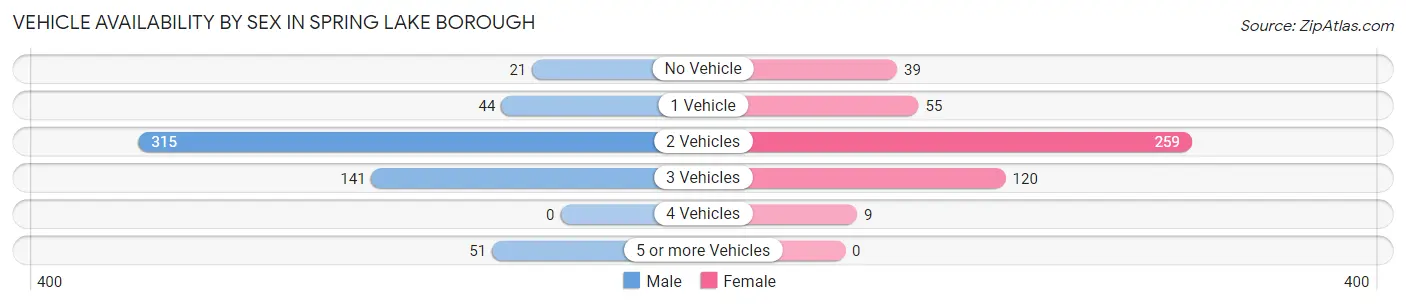
| Vehicles Available | Male | Female |
| No Vehicle | 21 (3.7%) | 39 (8.1%) |
| 1 Vehicle | 44 (7.7%) | 55 (11.4%) |
| 2 Vehicles | 315 (55.1%) | 259 (53.7%) |
| 3 Vehicles | 141 (24.6%) | 120 (24.9%) |
| 4 Vehicles | 0 (0.0%) | 9 (1.9%) |
| 5 or more Vehicles | 51 (8.9%) | 0 (0.0%) |
| Total | 572 (100.0%) | 482 (100.0%) |
Commute Time in Spring Lake borough
The most frequently occuring commute durations in Spring Lake borough are 90 or more minutes (159 commuters, 20.2%), 5 to 9 minutes (142 commuters, 18.1%), and 45 to 59 minutes (94 commuters, 12.0%).
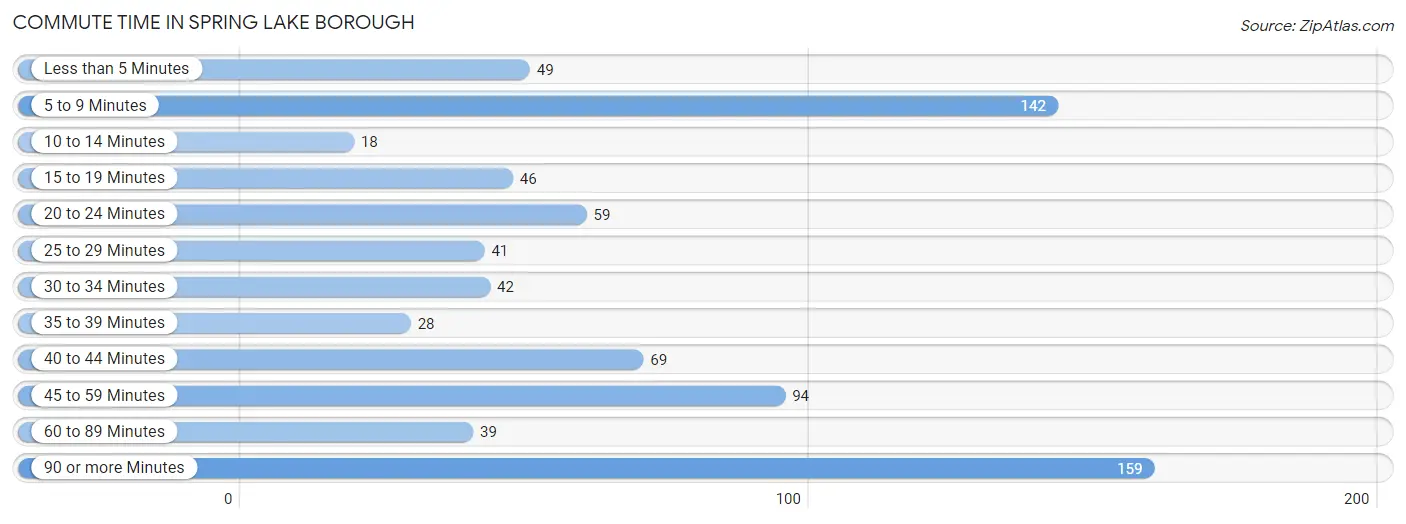
| Commute Time | # Commuters | % Commuters |
| Less than 5 Minutes | 49 | 6.2% |
| 5 to 9 Minutes | 142 | 18.1% |
| 10 to 14 Minutes | 18 | 2.3% |
| 15 to 19 Minutes | 46 | 5.9% |
| 20 to 24 Minutes | 59 | 7.5% |
| 25 to 29 Minutes | 41 | 5.2% |
| 30 to 34 Minutes | 42 | 5.3% |
| 35 to 39 Minutes | 28 | 3.6% |
| 40 to 44 Minutes | 69 | 8.8% |
| 45 to 59 Minutes | 94 | 12.0% |
| 60 to 89 Minutes | 39 | 5.0% |
| 90 or more Minutes | 159 | 20.2% |
Commute Time by Sex in Spring Lake borough
The most common commute times in Spring Lake borough are 90 or more minutes (121 commuters, 27.5%) for males and 45 to 59 minutes (58 commuters, 16.8%) for females.
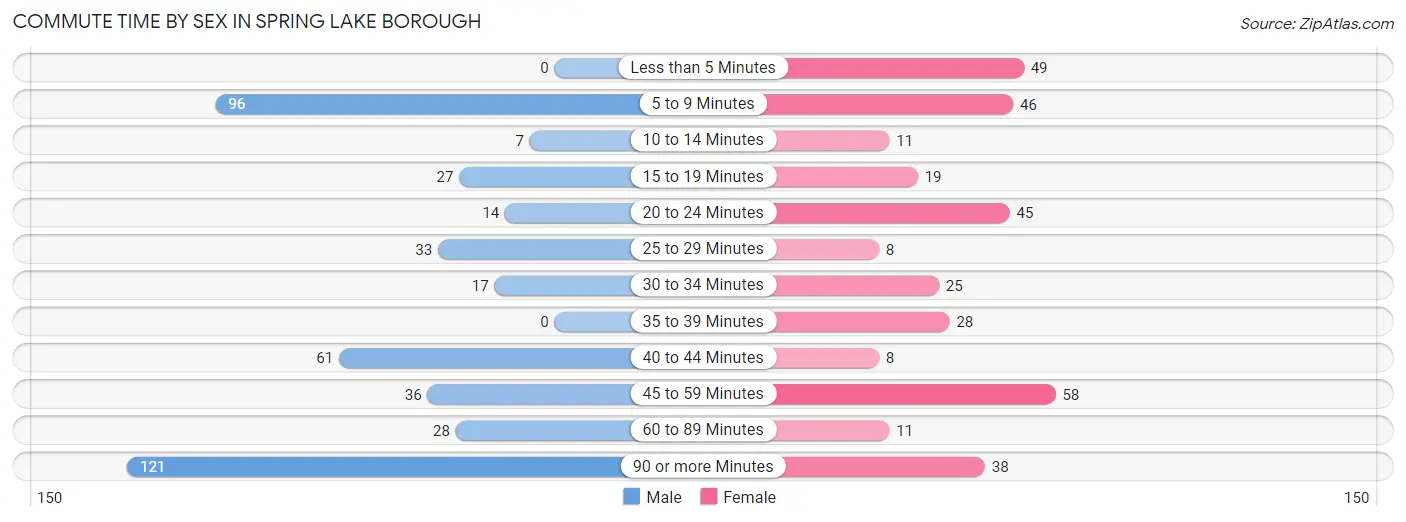
| Commute Time | Male | Female |
| Less than 5 Minutes | 0 (0.0%) | 49 (14.2%) |
| 5 to 9 Minutes | 96 (21.8%) | 46 (13.3%) |
| 10 to 14 Minutes | 7 (1.6%) | 11 (3.2%) |
| 15 to 19 Minutes | 27 (6.1%) | 19 (5.5%) |
| 20 to 24 Minutes | 14 (3.2%) | 45 (13.0%) |
| 25 to 29 Minutes | 33 (7.5%) | 8 (2.3%) |
| 30 to 34 Minutes | 17 (3.9%) | 25 (7.2%) |
| 35 to 39 Minutes | 0 (0.0%) | 28 (8.1%) |
| 40 to 44 Minutes | 61 (13.9%) | 8 (2.3%) |
| 45 to 59 Minutes | 36 (8.2%) | 58 (16.8%) |
| 60 to 89 Minutes | 28 (6.4%) | 11 (3.2%) |
| 90 or more Minutes | 121 (27.5%) | 38 (11.0%) |
Time of Departure to Work by Sex in Spring Lake borough
The most frequent times of departure to work in Spring Lake borough are 6:00 AM to 6:29 AM (108, 24.5%) for males and 7:30 AM to 7:59 AM (84, 24.3%) for females.
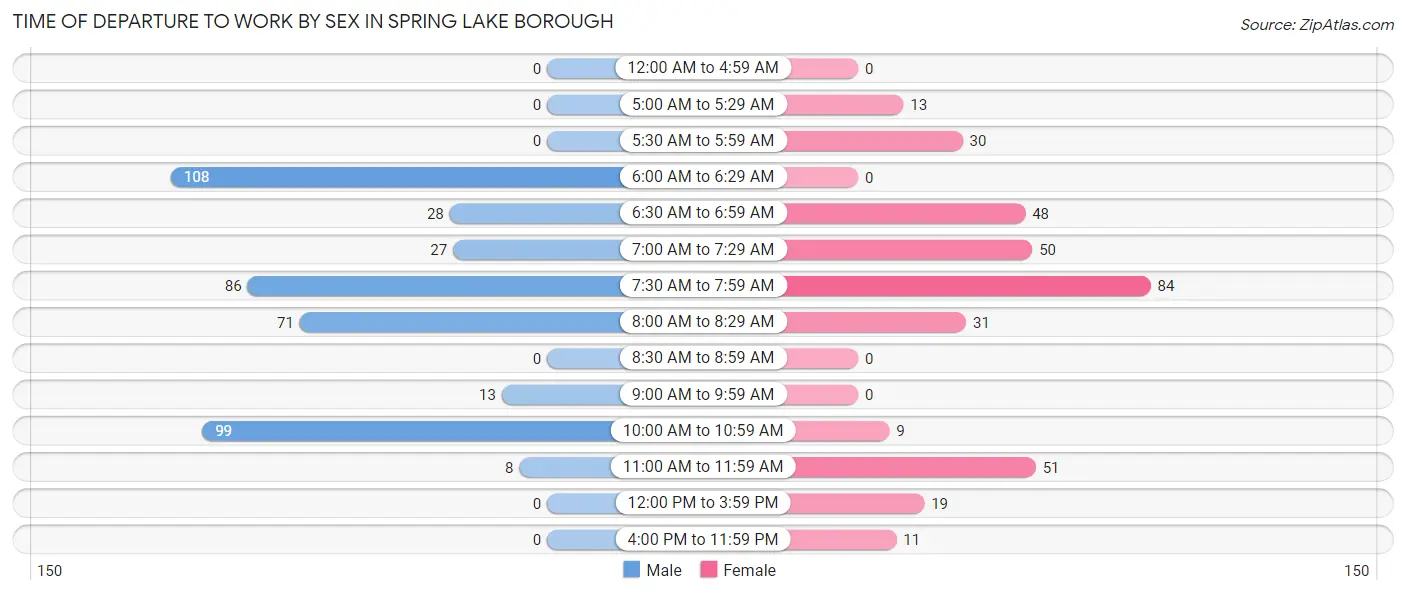
| Time of Departure | Male | Female |
| 12:00 AM to 4:59 AM | 0 (0.0%) | 0 (0.0%) |
| 5:00 AM to 5:29 AM | 0 (0.0%) | 13 (3.8%) |
| 5:30 AM to 5:59 AM | 0 (0.0%) | 30 (8.7%) |
| 6:00 AM to 6:29 AM | 108 (24.5%) | 0 (0.0%) |
| 6:30 AM to 6:59 AM | 28 (6.4%) | 48 (13.9%) |
| 7:00 AM to 7:29 AM | 27 (6.1%) | 50 (14.4%) |
| 7:30 AM to 7:59 AM | 86 (19.6%) | 84 (24.3%) |
| 8:00 AM to 8:29 AM | 71 (16.1%) | 31 (9.0%) |
| 8:30 AM to 8:59 AM | 0 (0.0%) | 0 (0.0%) |
| 9:00 AM to 9:59 AM | 13 (2.9%) | 0 (0.0%) |
| 10:00 AM to 10:59 AM | 99 (22.5%) | 9 (2.6%) |
| 11:00 AM to 11:59 AM | 8 (1.8%) | 51 (14.7%) |
| 12:00 PM to 3:59 PM | 0 (0.0%) | 19 (5.5%) |
| 4:00 PM to 11:59 PM | 0 (0.0%) | 11 (3.2%) |
| Total | 440 (100.0%) | 346 (100.0%) |
Housing Occupancy in Spring Lake borough
Occupancy by Ownership in Spring Lake borough
Of the total 1,268 dwellings in Spring Lake borough, owner-occupied units account for 1,113 (87.8%), while renter-occupied units make up 155 (12.2%).
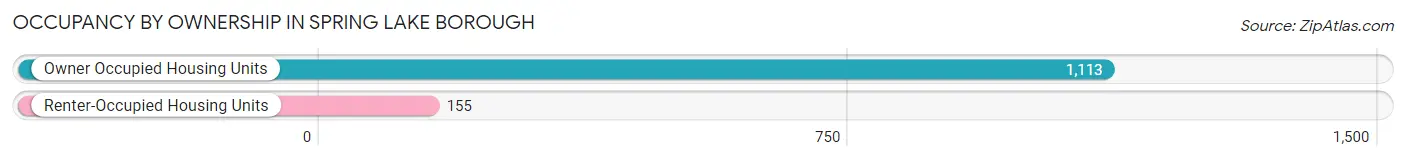
| Occupancy | # Housing Units | % Housing Units |
| Owner Occupied Housing Units | 1,113 | 87.8% |
| Renter-Occupied Housing Units | 155 | 12.2% |
| Total Occupied Housing Units | 1,268 | 100.0% |
Occupancy by Household Size in Spring Lake borough
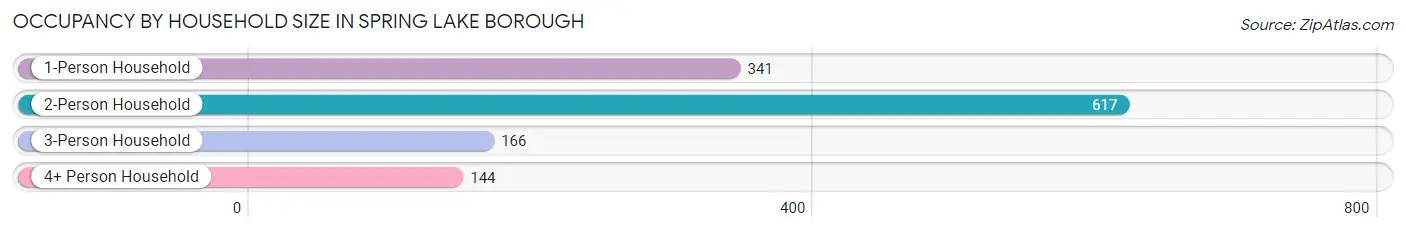
| Household Size | # Housing Units | % Housing Units |
| 1-Person Household | 341 | 26.9% |
| 2-Person Household | 617 | 48.7% |
| 3-Person Household | 166 | 13.1% |
| 4+ Person Household | 144 | 11.4% |
| Total Housing Units | 1,268 | 100.0% |
Occupancy by Ownership by Household Size in Spring Lake borough
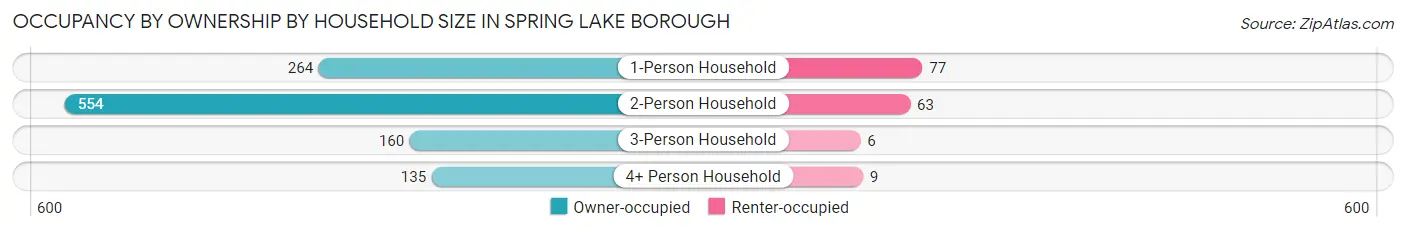
| Household Size | Owner-occupied | Renter-occupied |
| 1-Person Household | 264 (77.4%) | 77 (22.6%) |
| 2-Person Household | 554 (89.8%) | 63 (10.2%) |
| 3-Person Household | 160 (96.4%) | 6 (3.6%) |
| 4+ Person Household | 135 (93.8%) | 9 (6.2%) |
| Total Housing Units | 1,113 (87.8%) | 155 (12.2%) |
Occupancy by Educational Attainment in Spring Lake borough
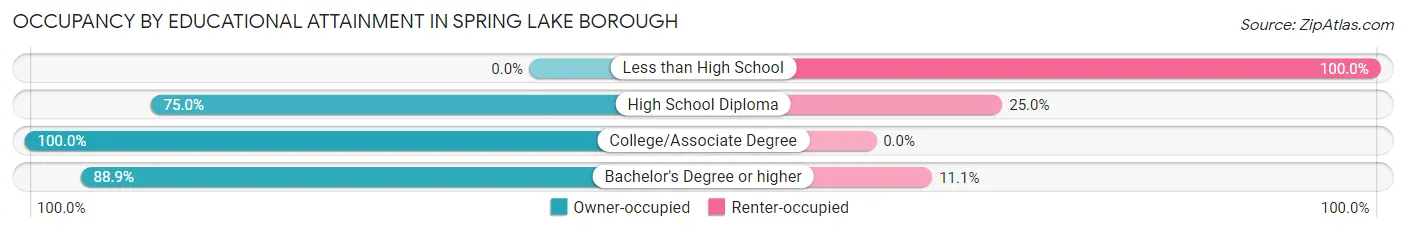
| Household Size | Owner-occupied | Renter-occupied |
| Less than High School | 0 (0.0%) | 12 (100.0%) |
| High School Diploma | 75 (75.0%) | 25 (25.0%) |
| College/Associate Degree | 95 (100.0%) | 0 (0.0%) |
| Bachelor's Degree or higher | 943 (88.9%) | 118 (11.1%) |
Occupancy by Age of Householder in Spring Lake borough
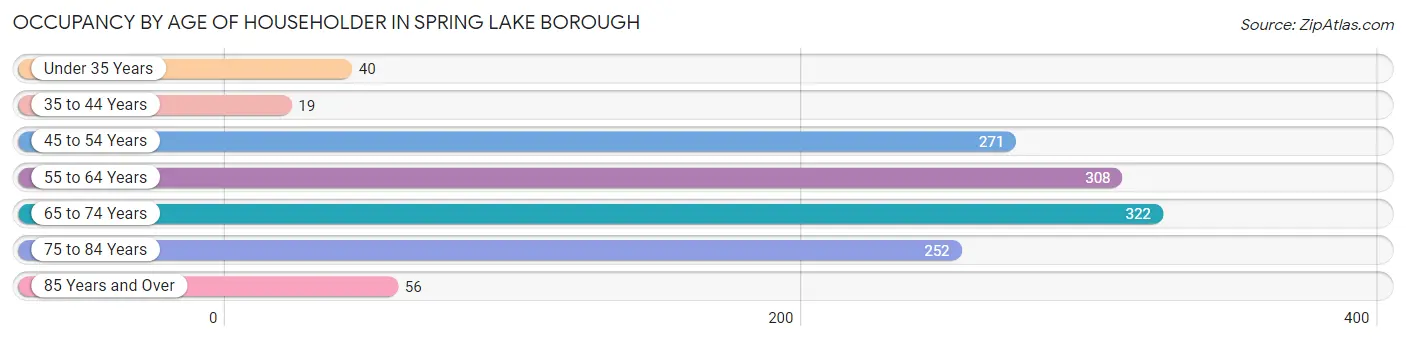
| Age Bracket | # Households | % Households |
| Under 35 Years | 40 | 3.2% |
| 35 to 44 Years | 19 | 1.5% |
| 45 to 54 Years | 271 | 21.4% |
| 55 to 64 Years | 308 | 24.3% |
| 65 to 74 Years | 322 | 25.4% |
| 75 to 84 Years | 252 | 19.9% |
| 85 Years and Over | 56 | 4.4% |
| Total | 1,268 | 100.0% |
Housing Finances in Spring Lake borough
Median Income by Occupancy in Spring Lake borough
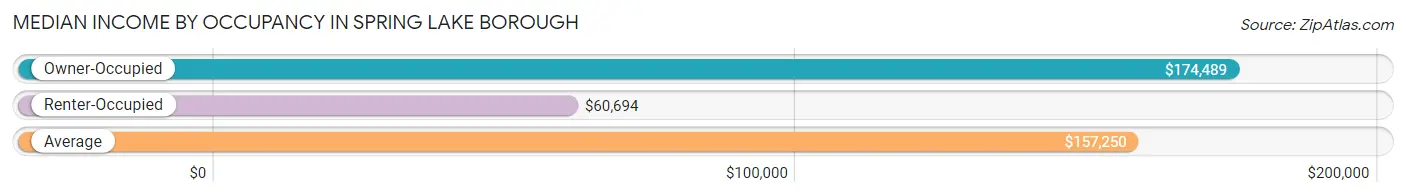
| Occupancy Type | # Households | Median Income |
| Owner-Occupied | 1,113 (87.8%) | $174,489 |
| Renter-Occupied | 155 (12.2%) | $60,694 |
| Average | 1,268 (100.0%) | $157,250 |
Occupancy by Householder Income Bracket in Spring Lake borough
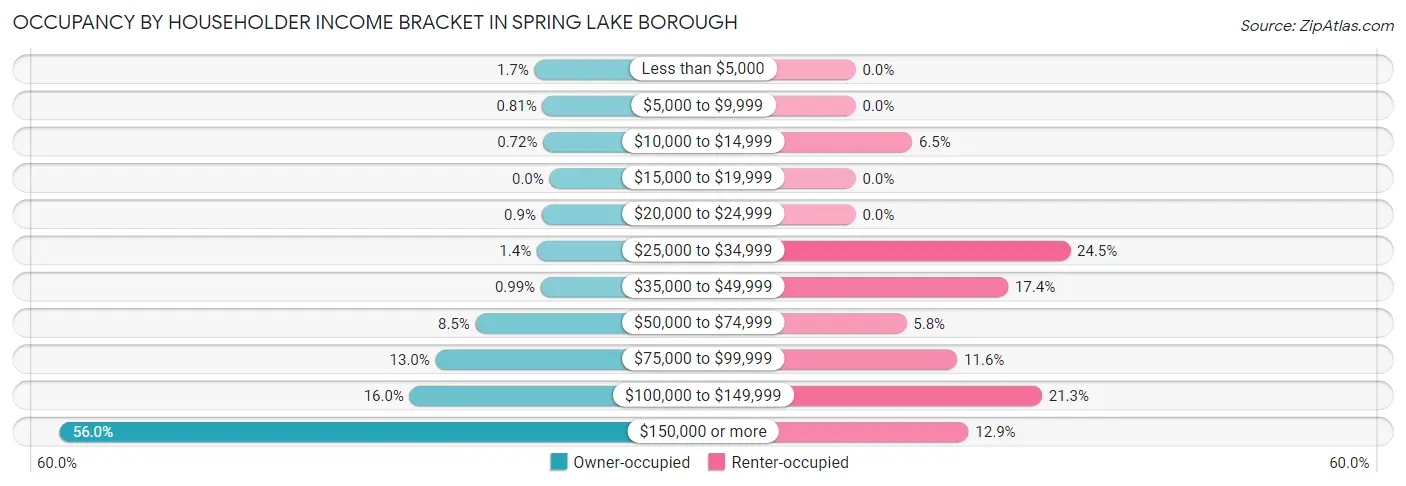
| Income Bracket | Owner-occupied | Renter-occupied |
| Less than $5,000 | 19 (1.7%) | 0 (0.0%) |
| $5,000 to $9,999 | 9 (0.8%) | 0 (0.0%) |
| $10,000 to $14,999 | 8 (0.7%) | 10 (6.5%) |
| $15,000 to $19,999 | 0 (0.0%) | 0 (0.0%) |
| $20,000 to $24,999 | 10 (0.9%) | 0 (0.0%) |
| $25,000 to $34,999 | 16 (1.4%) | 38 (24.5%) |
| $35,000 to $49,999 | 11 (1.0%) | 27 (17.4%) |
| $50,000 to $74,999 | 94 (8.5%) | 9 (5.8%) |
| $75,000 to $99,999 | 145 (13.0%) | 18 (11.6%) |
| $100,000 to $149,999 | 178 (16.0%) | 33 (21.3%) |
| $150,000 or more | 623 (56.0%) | 20 (12.9%) |
| Total | 1,113 (100.0%) | 155 (100.0%) |
Monthly Housing Cost Tiers in Spring Lake borough
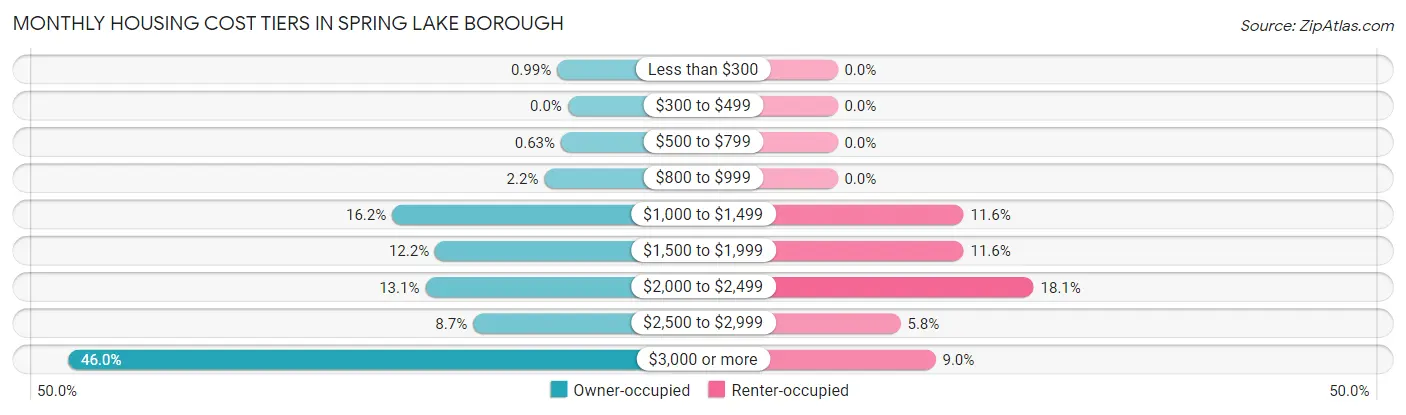
| Monthly Cost | Owner-occupied | Renter-occupied |
| Less than $300 | 11 (1.0%) | 0 (0.0%) |
| $300 to $499 | 0 (0.0%) | 0 (0.0%) |
| $500 to $799 | 7 (0.6%) | 0 (0.0%) |
| $800 to $999 | 24 (2.2%) | 0 (0.0%) |
| $1,000 to $1,499 | 180 (16.2%) | 18 (11.6%) |
| $1,500 to $1,999 | 136 (12.2%) | 18 (11.6%) |
| $2,000 to $2,499 | 146 (13.1%) | 28 (18.1%) |
| $2,500 to $2,999 | 97 (8.7%) | 9 (5.8%) |
| $3,000 or more | 512 (46.0%) | 14 (9.0%) |
| Total | 1,113 (100.0%) | 155 (100.0%) |
Physical Housing Characteristics in Spring Lake borough
Housing Structures in Spring Lake borough
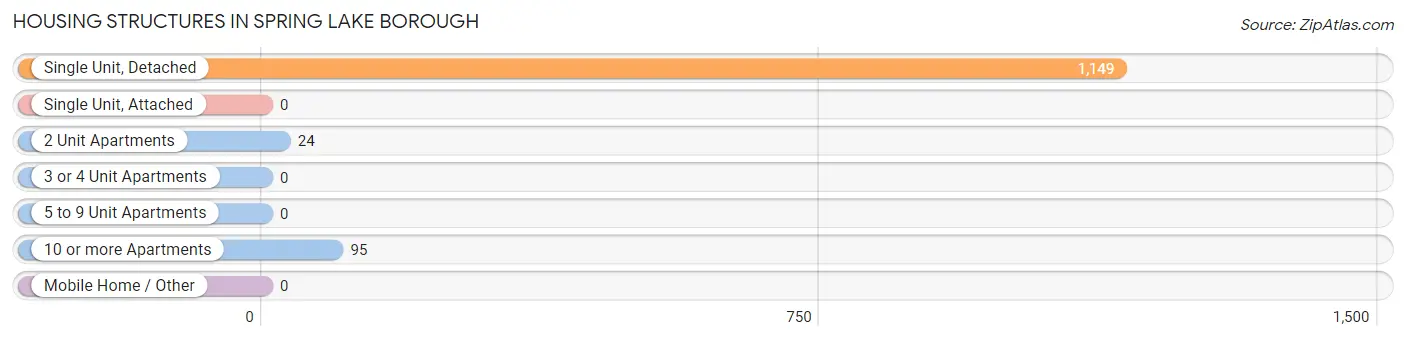
| Structure Type | # Housing Units | % Housing Units |
| Single Unit, Detached | 1,149 | 90.6% |
| Single Unit, Attached | 0 | 0.0% |
| 2 Unit Apartments | 24 | 1.9% |
| 3 or 4 Unit Apartments | 0 | 0.0% |
| 5 to 9 Unit Apartments | 0 | 0.0% |
| 10 or more Apartments | 95 | 7.5% |
| Mobile Home / Other | 0 | 0.0% |
| Total | 1,268 | 100.0% |
Housing Structures by Occupancy in Spring Lake borough
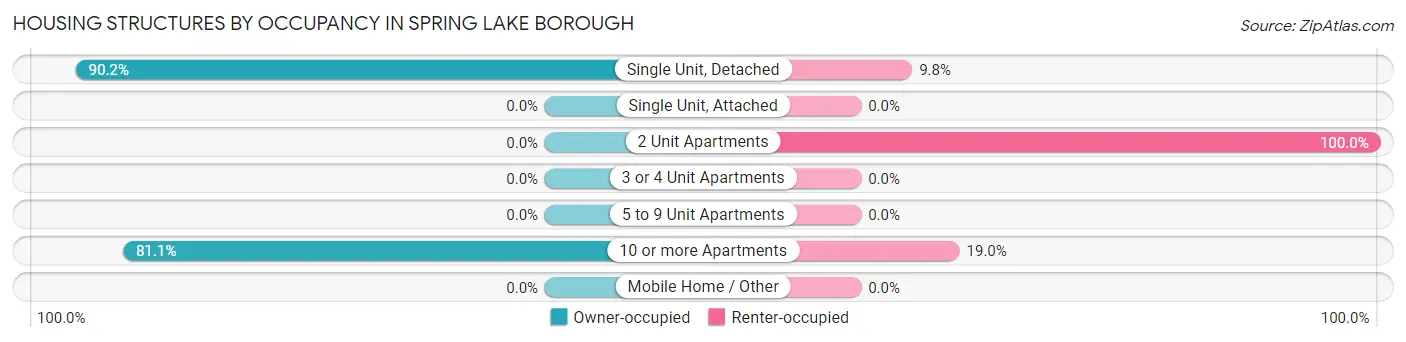
| Structure Type | Owner-occupied | Renter-occupied |
| Single Unit, Detached | 1,036 (90.2%) | 113 (9.8%) |
| Single Unit, Attached | 0 (0.0%) | 0 (0.0%) |
| 2 Unit Apartments | 0 (0.0%) | 24 (100.0%) |
| 3 or 4 Unit Apartments | 0 (0.0%) | 0 (0.0%) |
| 5 to 9 Unit Apartments | 0 (0.0%) | 0 (0.0%) |
| 10 or more Apartments | 77 (81.0%) | 18 (19.0%) |
| Mobile Home / Other | 0 (0.0%) | 0 (0.0%) |
| Total | 1,113 (87.8%) | 155 (12.2%) |
Housing Structures by Number of Rooms in Spring Lake borough
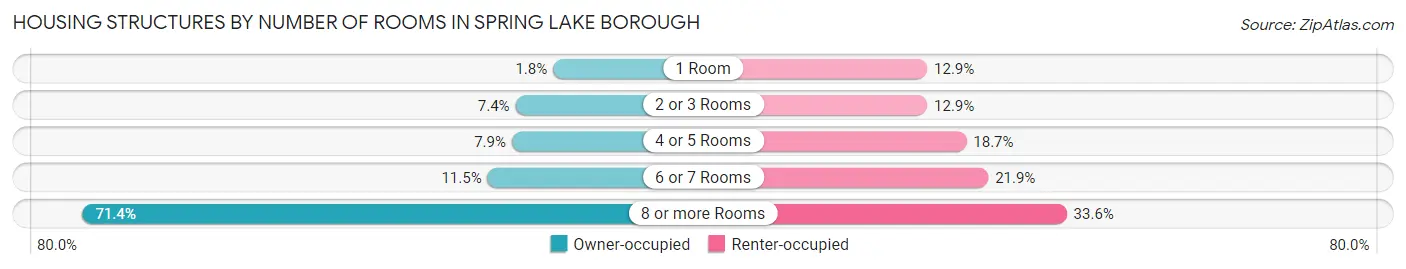
| Number of Rooms | Owner-occupied | Renter-occupied |
| 1 Room | 20 (1.8%) | 20 (12.9%) |
| 2 or 3 Rooms | 82 (7.4%) | 20 (12.9%) |
| 4 or 5 Rooms | 88 (7.9%) | 29 (18.7%) |
| 6 or 7 Rooms | 128 (11.5%) | 34 (21.9%) |
| 8 or more Rooms | 795 (71.4%) | 52 (33.6%) |
| Total | 1,113 (100.0%) | 155 (100.0%) |
Housing Structure by Heating Type in Spring Lake borough
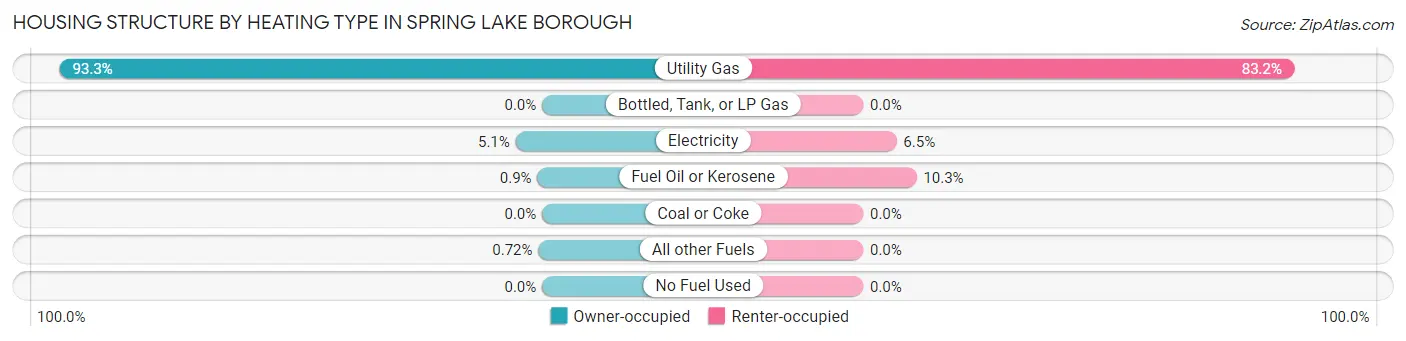
| Heating Type | Owner-occupied | Renter-occupied |
| Utility Gas | 1,038 (93.3%) | 129 (83.2%) |
| Bottled, Tank, or LP Gas | 0 (0.0%) | 0 (0.0%) |
| Electricity | 57 (5.1%) | 10 (6.5%) |
| Fuel Oil or Kerosene | 10 (0.9%) | 16 (10.3%) |
| Coal or Coke | 0 (0.0%) | 0 (0.0%) |
| All other Fuels | 8 (0.7%) | 0 (0.0%) |
| No Fuel Used | 0 (0.0%) | 0 (0.0%) |
| Total | 1,113 (100.0%) | 155 (100.0%) |
Household Vehicle Usage in Spring Lake borough
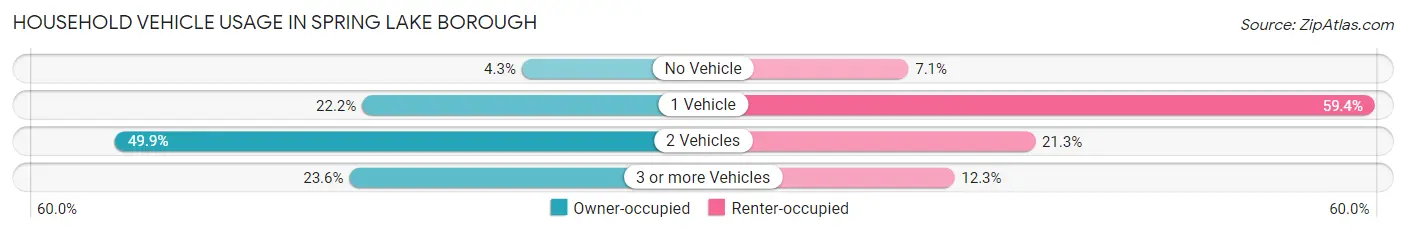
| Vehicles per Household | Owner-occupied | Renter-occupied |
| No Vehicle | 48 (4.3%) | 11 (7.1%) |
| 1 Vehicle | 247 (22.2%) | 92 (59.4%) |
| 2 Vehicles | 555 (49.9%) | 33 (21.3%) |
| 3 or more Vehicles | 263 (23.6%) | 19 (12.3%) |
| Total | 1,113 (100.0%) | 155 (100.0%) |
Real Estate & Mortgages in Spring Lake borough
Real Estate and Mortgage Overview in Spring Lake borough
| Characteristic | Without Mortgage | With Mortgage |
| Housing Units | 756 | 357 |
| Median Property Value | $2,000,001 | $2,000,001 |
| Median Household Income | $140,625 | $269 |
| Monthly Housing Costs | $1,501 | $324 |
| Real Estate Taxes | $10,001 | $11 |
Property Value by Mortgage Status in Spring Lake borough
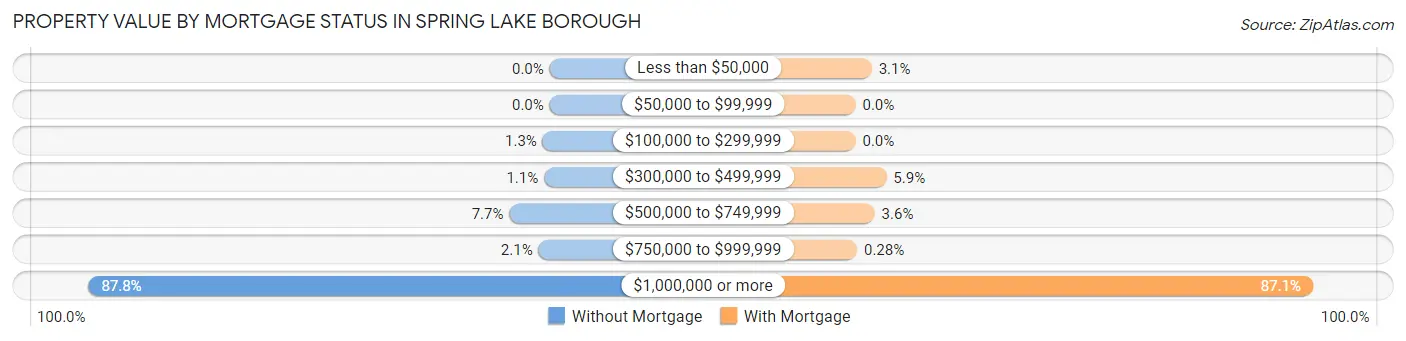
| Property Value | Without Mortgage | With Mortgage |
| Less than $50,000 | 0 (0.0%) | 11 (3.1%) |
| $50,000 to $99,999 | 0 (0.0%) | 0 (0.0%) |
| $100,000 to $299,999 | 10 (1.3%) | 0 (0.0%) |
| $300,000 to $499,999 | 8 (1.1%) | 21 (5.9%) |
| $500,000 to $749,999 | 58 (7.7%) | 13 (3.6%) |
| $750,000 to $999,999 | 16 (2.1%) | 1 (0.3%) |
| $1,000,000 or more | 664 (87.8%) | 311 (87.1%) |
| Total | 756 (100.0%) | 357 (100.0%) |
Household Income by Mortgage Status in Spring Lake borough
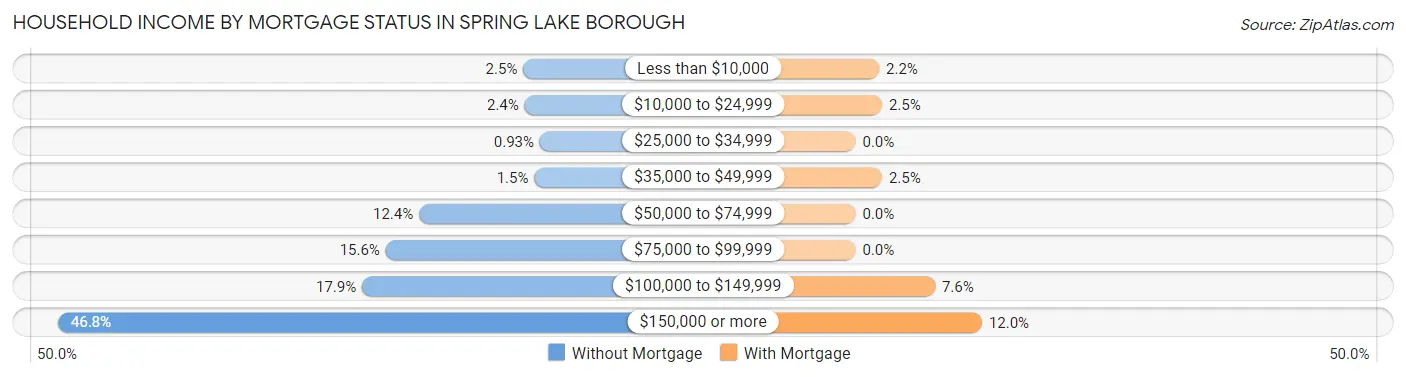
| Household Income | Without Mortgage | With Mortgage |
| Less than $10,000 | 19 (2.5%) | 8 (2.2%) |
| $10,000 to $24,999 | 18 (2.4%) | 9 (2.5%) |
| $25,000 to $34,999 | 7 (0.9%) | 0 (0.0%) |
| $35,000 to $49,999 | 11 (1.5%) | 9 (2.5%) |
| $50,000 to $74,999 | 94 (12.4%) | 0 (0.0%) |
| $75,000 to $99,999 | 118 (15.6%) | 0 (0.0%) |
| $100,000 to $149,999 | 135 (17.9%) | 27 (7.6%) |
| $150,000 or more | 354 (46.8%) | 43 (12.0%) |
| Total | 756 (100.0%) | 357 (100.0%) |
Property Value to Household Income Ratio in Spring Lake borough
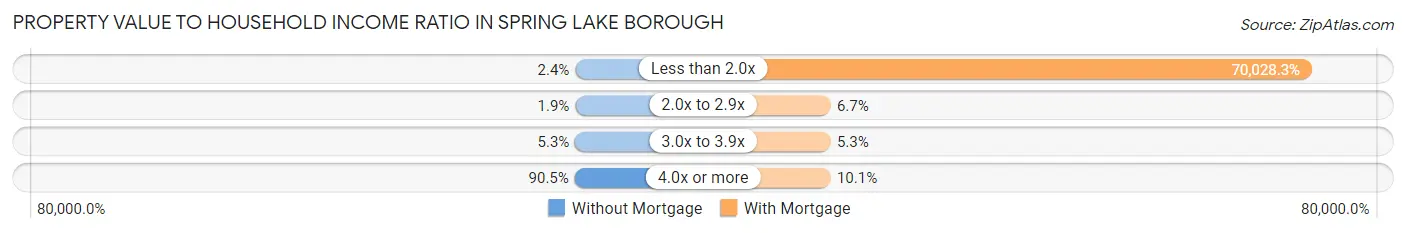
| Value-to-Income Ratio | Without Mortgage | With Mortgage |
| Less than 2.0x | 18 (2.4%) | 250,001 (70,028.3%) |
| 2.0x to 2.9x | 14 (1.8%) | 24 (6.7%) |
| 3.0x to 3.9x | 40 (5.3%) | 19 (5.3%) |
| 4.0x or more | 684 (90.5%) | 36 (10.1%) |
| Total | 756 (100.0%) | 357 (100.0%) |
Real Estate Taxes by Mortgage Status in Spring Lake borough
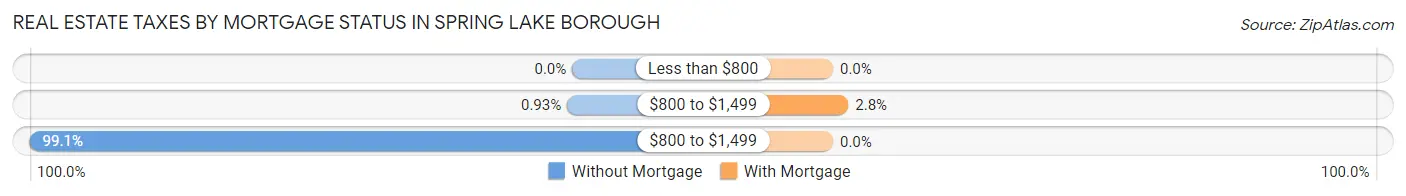
| Property Taxes | Without Mortgage | With Mortgage |
| Less than $800 | 0 (0.0%) | 0 (0.0%) |
| $800 to $1,499 | 7 (0.9%) | 10 (2.8%) |
| $800 to $1,499 | 749 (99.1%) | 0 (0.0%) |
| Total | 756 (100.0%) | 357 (100.0%) |
Health & Disability in Spring Lake borough
Health Insurance Coverage by Age in Spring Lake borough
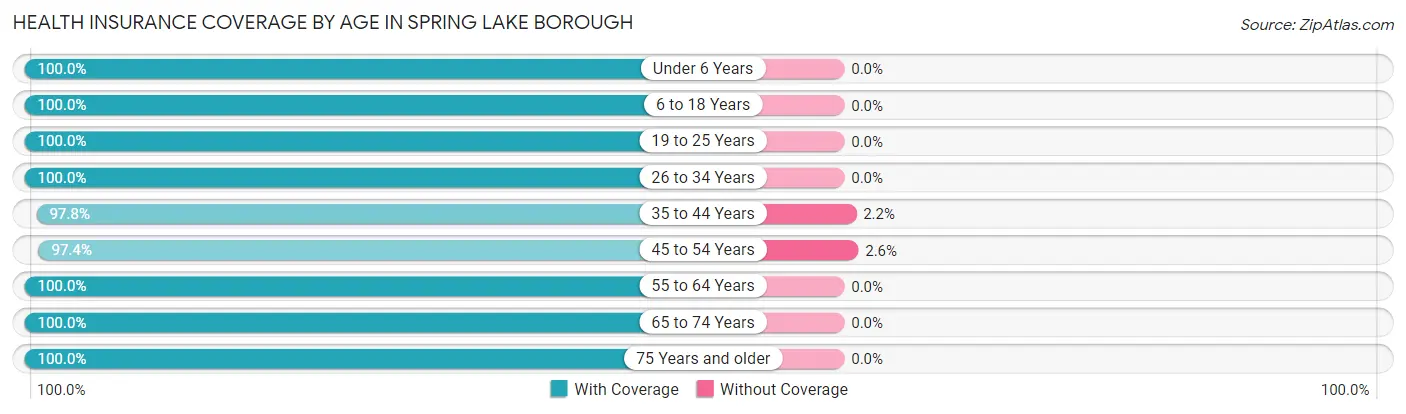
| Age Bracket | With Coverage | Without Coverage |
| Under 6 Years | 87 (100.0%) | 0 (0.0%) |
| 6 to 18 Years | 282 (100.0%) | 0 (0.0%) |
| 19 to 25 Years | 131 (100.0%) | 0 (0.0%) |
| 26 to 34 Years | 108 (100.0%) | 0 (0.0%) |
| 35 to 44 Years | 44 (97.8%) | 1 (2.2%) |
| 45 to 54 Years | 447 (97.4%) | 12 (2.6%) |
| 55 to 64 Years | 622 (100.0%) | 0 (0.0%) |
| 65 to 74 Years | 590 (100.0%) | 0 (0.0%) |
| 75 Years and older | 464 (100.0%) | 0 (0.0%) |
| Total | 2,775 (99.5%) | 13 (0.5%) |
Health Insurance Coverage by Citizenship Status in Spring Lake borough
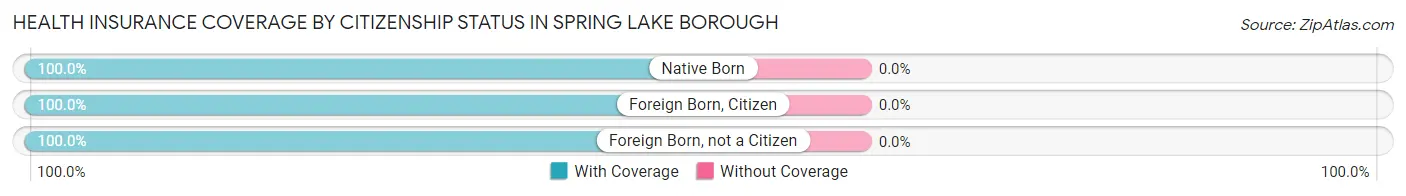
| Citizenship Status | With Coverage | Without Coverage |
| Native Born | 87 (100.0%) | 0 (0.0%) |
| Foreign Born, Citizen | 282 (100.0%) | 0 (0.0%) |
| Foreign Born, not a Citizen | 131 (100.0%) | 0 (0.0%) |
Health Insurance Coverage by Household Income in Spring Lake borough
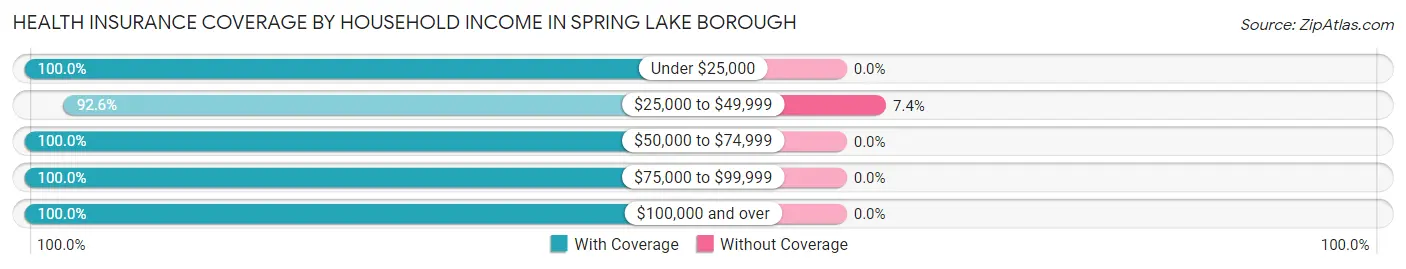
| Household Income | With Coverage | Without Coverage |
| Under $25,000 | 95 (100.0%) | 0 (0.0%) |
| $25,000 to $49,999 | 151 (92.6%) | 12 (7.4%) |
| $50,000 to $74,999 | 151 (100.0%) | 0 (0.0%) |
| $75,000 to $99,999 | 255 (100.0%) | 0 (0.0%) |
| $100,000 and over | 2,116 (100.0%) | 0 (0.0%) |
Public vs Private Health Insurance Coverage by Age in Spring Lake borough
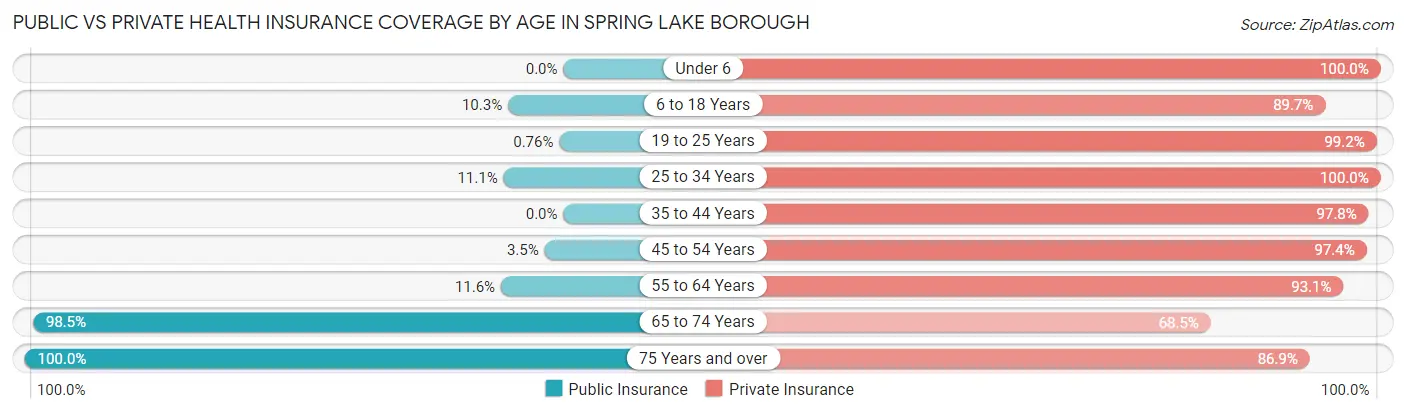
| Age Bracket | Public Insurance | Private Insurance |
| Under 6 | 0 (0.0%) | 87 (100.0%) |
| 6 to 18 Years | 29 (10.3%) | 253 (89.7%) |
| 19 to 25 Years | 1 (0.8%) | 130 (99.2%) |
| 25 to 34 Years | 12 (11.1%) | 108 (100.0%) |
| 35 to 44 Years | 0 (0.0%) | 44 (97.8%) |
| 45 to 54 Years | 16 (3.5%) | 447 (97.4%) |
| 55 to 64 Years | 72 (11.6%) | 579 (93.1%) |
| 65 to 74 Years | 581 (98.5%) | 404 (68.5%) |
| 75 Years and over | 464 (100.0%) | 403 (86.9%) |
| Total | 1,175 (42.1%) | 2,455 (88.1%) |
Disability Status by Sex by Age in Spring Lake borough
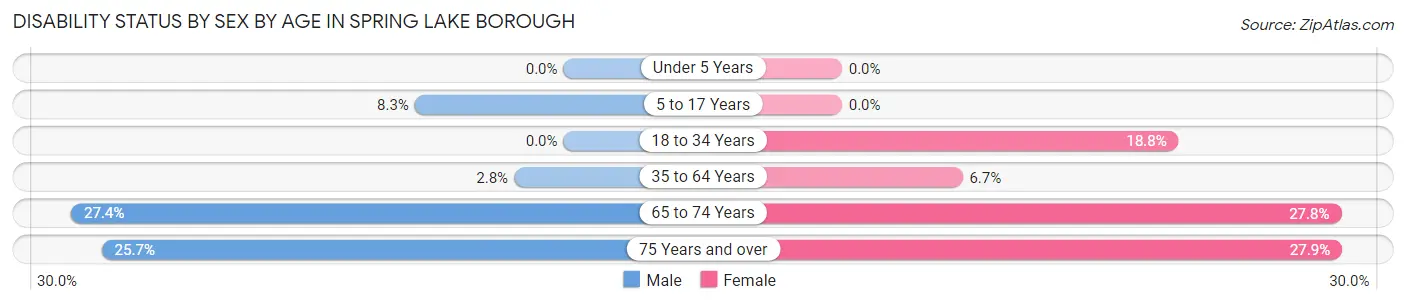
| Age Bracket | Male | Female |
| Under 5 Years | 0 (0.0%) | 0 (0.0%) |
| 5 to 17 Years | 13 (8.3%) | 0 (0.0%) |
| 18 to 34 Years | 0 (0.0%) | 27 (18.8%) |
| 35 to 64 Years | 15 (2.8%) | 39 (6.7%) |
| 65 to 74 Years | 74 (27.4%) | 89 (27.8%) |
| 75 Years and over | 63 (25.7%) | 61 (27.9%) |
Disability Class by Sex by Age in Spring Lake borough
Disability Class: Hearing Difficulty
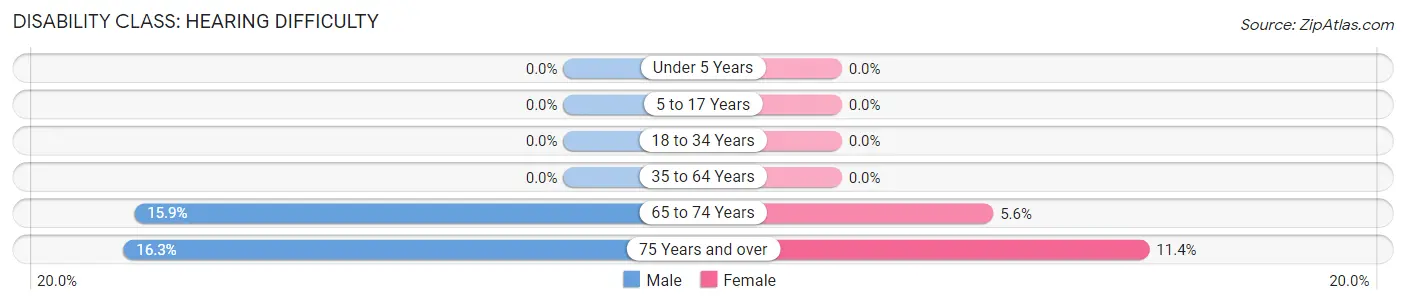
| Age Bracket | Male | Female |
| Under 5 Years | 0 (0.0%) | 0 (0.0%) |
| 5 to 17 Years | 0 (0.0%) | 0 (0.0%) |
| 18 to 34 Years | 0 (0.0%) | 0 (0.0%) |
| 35 to 64 Years | 0 (0.0%) | 0 (0.0%) |
| 65 to 74 Years | 43 (15.9%) | 18 (5.6%) |
| 75 Years and over | 40 (16.3%) | 25 (11.4%) |
Disability Class: Vision Difficulty
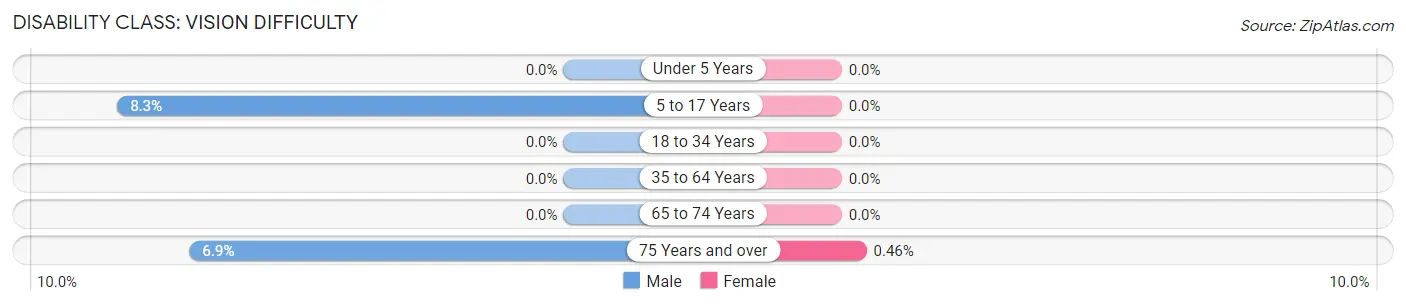
| Age Bracket | Male | Female |
| Under 5 Years | 0 (0.0%) | 0 (0.0%) |
| 5 to 17 Years | 13 (8.3%) | 0 (0.0%) |
| 18 to 34 Years | 0 (0.0%) | 0 (0.0%) |
| 35 to 64 Years | 0 (0.0%) | 0 (0.0%) |
| 65 to 74 Years | 0 (0.0%) | 0 (0.0%) |
| 75 Years and over | 17 (6.9%) | 1 (0.5%) |
Disability Class: Cognitive Difficulty
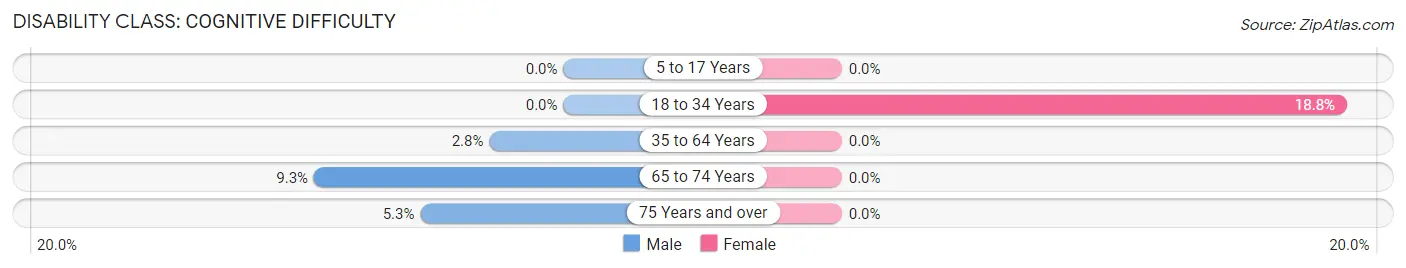
| Age Bracket | Male | Female |
| 5 to 17 Years | 0 (0.0%) | 0 (0.0%) |
| 18 to 34 Years | 0 (0.0%) | 27 (18.8%) |
| 35 to 64 Years | 15 (2.8%) | 0 (0.0%) |
| 65 to 74 Years | 25 (9.3%) | 0 (0.0%) |
| 75 Years and over | 13 (5.3%) | 0 (0.0%) |
Disability Class: Ambulatory Difficulty
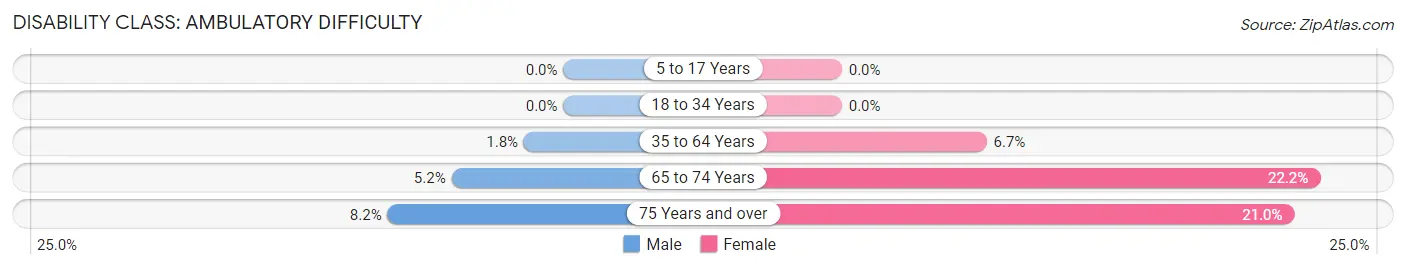
| Age Bracket | Male | Female |
| 5 to 17 Years | 0 (0.0%) | 0 (0.0%) |
| 18 to 34 Years | 0 (0.0%) | 0 (0.0%) |
| 35 to 64 Years | 10 (1.8%) | 39 (6.7%) |
| 65 to 74 Years | 14 (5.2%) | 71 (22.2%) |
| 75 Years and over | 20 (8.2%) | 46 (21.0%) |
Disability Class: Self-Care Difficulty
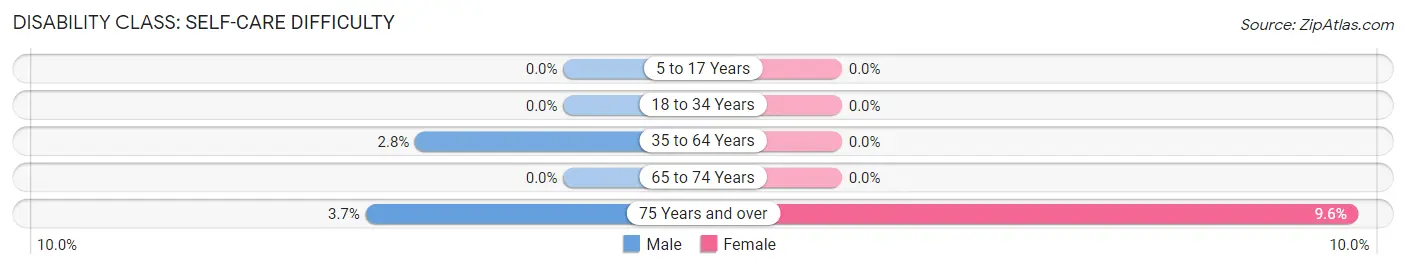
| Age Bracket | Male | Female |
| 5 to 17 Years | 0 (0.0%) | 0 (0.0%) |
| 18 to 34 Years | 0 (0.0%) | 0 (0.0%) |
| 35 to 64 Years | 15 (2.8%) | 0 (0.0%) |
| 65 to 74 Years | 0 (0.0%) | 0 (0.0%) |
| 75 Years and over | 9 (3.7%) | 21 (9.6%) |
Technology Access in Spring Lake borough
Computing Device Access in Spring Lake borough
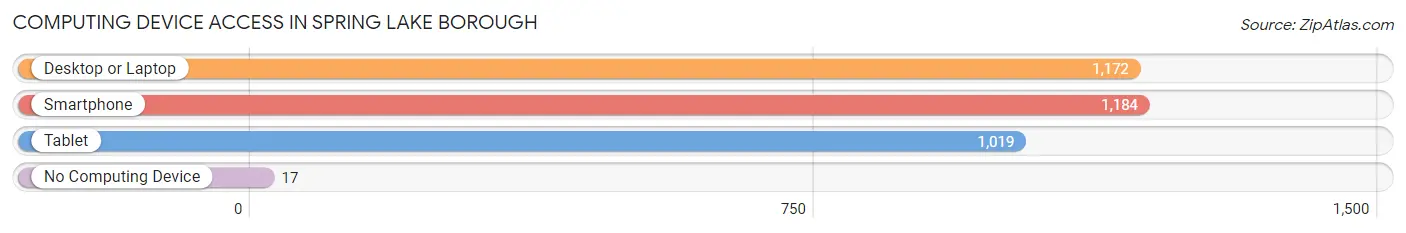
| Device Type | # Households | % Households |
| Desktop or Laptop | 1,172 | 92.4% |
| Smartphone | 1,184 | 93.4% |
| Tablet | 1,019 | 80.4% |
| No Computing Device | 17 | 1.3% |
| Total | 1,268 | 100.0% |
Internet Access in Spring Lake borough
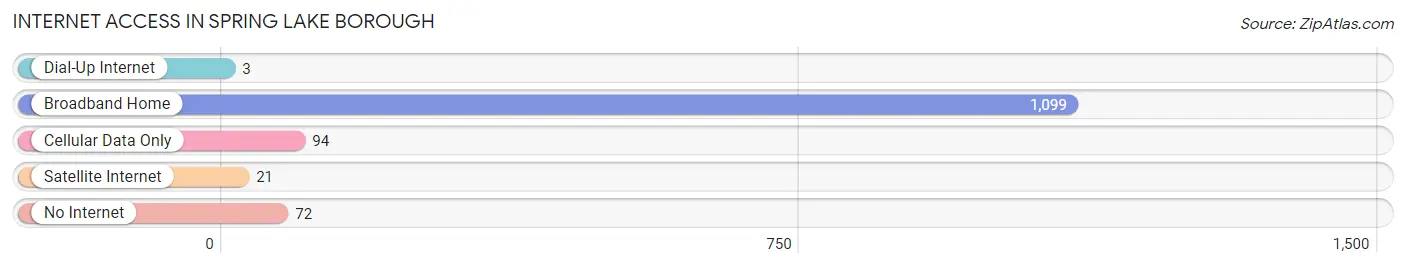
| Internet Type | # Households | % Households |
| Dial-Up Internet | 3 | 0.2% |
| Broadband Home | 1,099 | 86.7% |
| Cellular Data Only | 94 | 7.4% |
| Satellite Internet | 21 | 1.7% |
| No Internet | 72 | 5.7% |
| Total | 1,268 | 100.0% |
Spring Lake borough Summary
Introduction
Spring Lake Borough is a borough in Monmouth County, New Jersey, United States. It is located on the Atlantic Ocean, south of Belmar and north of Sea Girt. As of the 2010 United States Census, the borough's population was 2,993, reflecting a decline of 517 (-14.8%) from the 3,510 counted in the 2000 Census, which had in turn increased by 517 (+17.3%) from the 2,993 counted in the 1990 Census.
History
The area that is now Spring Lake was originally inhabited by the Lenni Lenape Native Americans. The first European settlers arrived in the area in the late 1600s. The area was originally known as "Wreck Pond" due to the numerous shipwrecks that occurred off the coast. In 1867, the area was renamed Spring Lake, after the freshwater lake located in the center of town.
In 1871, the Borough of Spring Lake was incorporated. The town quickly became a popular summer destination for wealthy families from New York City and Philadelphia. The town was known for its grand Victorian homes and its pristine beaches.
In the early 1900s, the town was a popular destination for the wealthy and famous. President Woodrow Wilson and his family spent their summers in Spring Lake. The town was also home to many prominent businessmen, including John D. Rockefeller and Cornelius Vanderbilt.
Geography
Spring Lake is located at 40°10′17″N 74°02′45″W (40.1714, -74.0457). According to the United States Census Bureau, the borough had a total area of 1.845 square miles (4.781 km2), including 1.844 square miles (4.778 km2) of land and 0.001 square miles (0.003 km2) of water (0.06%).
The borough borders the Monmouth County municipalities of Belmar, Lake Como, Sea Girt and Wall Township.
Economy
The economy of Spring Lake is largely based on tourism. The town is a popular summer destination for wealthy families from New York City and Philadelphia. The town is also home to many small businesses, including restaurants, retail stores, and professional services.
Demographics
As of the 2010 United States Census, there were 2,993 people, 1,093 households, and 817.8 families residing in the borough. The population density was 1,621.2 per square mile (625.3/km2). There were 1,541 housing units at an average density of 837.2 per square mile (323.3/km2). The racial makeup of the borough was 95.2% (2,867) White, 0.9% (27) Black or African American, 0.1% (3) Native American, 1.7% (51) Asian, 0.0% (0) Pacific Islander, 0.7% (20) from other races, and 1.4% (42) from two or more races. Hispanic or Latino of any race were 3.7% (111) of the population.
There were 1,093 households, out of which 33.2% had children under the age of 18 living with them, 63.2% were married couples living together, 8.2% had a female householder with no husband present, and 25.3% were non-families. 21.2% of all households were made up of individuals, and 11.2% had someone living alone who was 65 years of age or older. The average household size was 2.73 and the average family size was 3.20.
In the borough, the population was spread out, with 24.2% under the age of 18, 5.2% from 18 to 24, 22.2% from 25 to 44, 31.2% from 45 to 64, and 17.2% who were 65 years of age or older. The median age was 43.3 years. For every 100 females, there were 94.2 males. For every 100 females ages 18 and older there were 90.2 males.
The median income for a household in the borough was $97,917, and the median income for a family was $118,917. Males had a median income of $81,250 versus $50,000 for females. The per capita income for the borough was $54,917. About 1.7% of families and 2.9% of the population were below the poverty line, including 2.2% of those under age 18 and 3.2% of those age 65 or over.
Conclusion
Spring Lake Borough is a small borough located in Monmouth County, New Jersey. It is a popular summer destination for wealthy families from New York City and Philadelphia. The town is known for its grand Victorian homes and its pristine beaches. The economy of Spring Lake is largely based on tourism, and the town is home to many small businesses. The population of Spring Lake is largely white, with a small percentage of other races. The median income for a household in the borough is high, and the poverty rate is low.
Common Questions
What is Per Capita Income in Spring Lake borough?
Per Capita income in Spring Lake borough is $112,232.
What is the Median Family Income in Spring Lake borough?
Median Family Income in Spring Lake borough is $219,286.
What is the Median Household income in Spring Lake borough?
Median Household Income in Spring Lake borough is $157,250.
What is Income or Wage Gap in Spring Lake borough?
Income or Wage Gap in Spring Lake borough is 36.6%.
Women in Spring Lake borough earn 63.4 cents for every dollar earned by a man.
What is Family Income Deficit in Spring Lake borough?
Family Income Deficit in Spring Lake borough is $9,573.
Families that are below poverty line in Spring Lake borough earn $9,573 less on average than the poverty threshold level.
What is Inequality or Gini Index in Spring Lake borough?
Inequality or Gini Index in Spring Lake borough is 0.50.
What is the Total Population of Spring Lake borough?
Total Population of Spring Lake borough is 2,788.
What is the Total Male Population of Spring Lake borough?
Total Male Population of Spring Lake borough is 1,355.
What is the Total Female Population of Spring Lake borough?
Total Female Population of Spring Lake borough is 1,433.
What is the Ratio of Males per 100 Females in Spring Lake borough?
There are 94.56 Males per 100 Females in Spring Lake borough.
What is the Ratio of Females per 100 Males in Spring Lake borough?
There are 105.76 Females per 100 Males in Spring Lake borough.
What is the Median Population Age in Spring Lake borough?
Median Population Age in Spring Lake borough is 58.6 Years.
What is the Average Family Size in Spring Lake borough
Average Family Size in Spring Lake borough is 2.6 People.
What is the Average Household Size in Spring Lake borough
Average Household Size in Spring Lake borough is 2.2 People.
How Large is the Labor Force in Spring Lake borough?
There are 1,083 People in the Labor Forcein in Spring Lake borough.
What is the Percentage of People in the Labor Force in Spring Lake borough?
43.0% of People are in the Labor Force in Spring Lake borough.
What is the Unemployment Rate in Spring Lake borough?
Unemployment Rate in Spring Lake borough is 2.6%.