Cities with the Highest Percentage of Immigrants from Spain in New Jersey
RELATED REPORTS & OPTIONS
Spain
New Jersey
Compare Cities
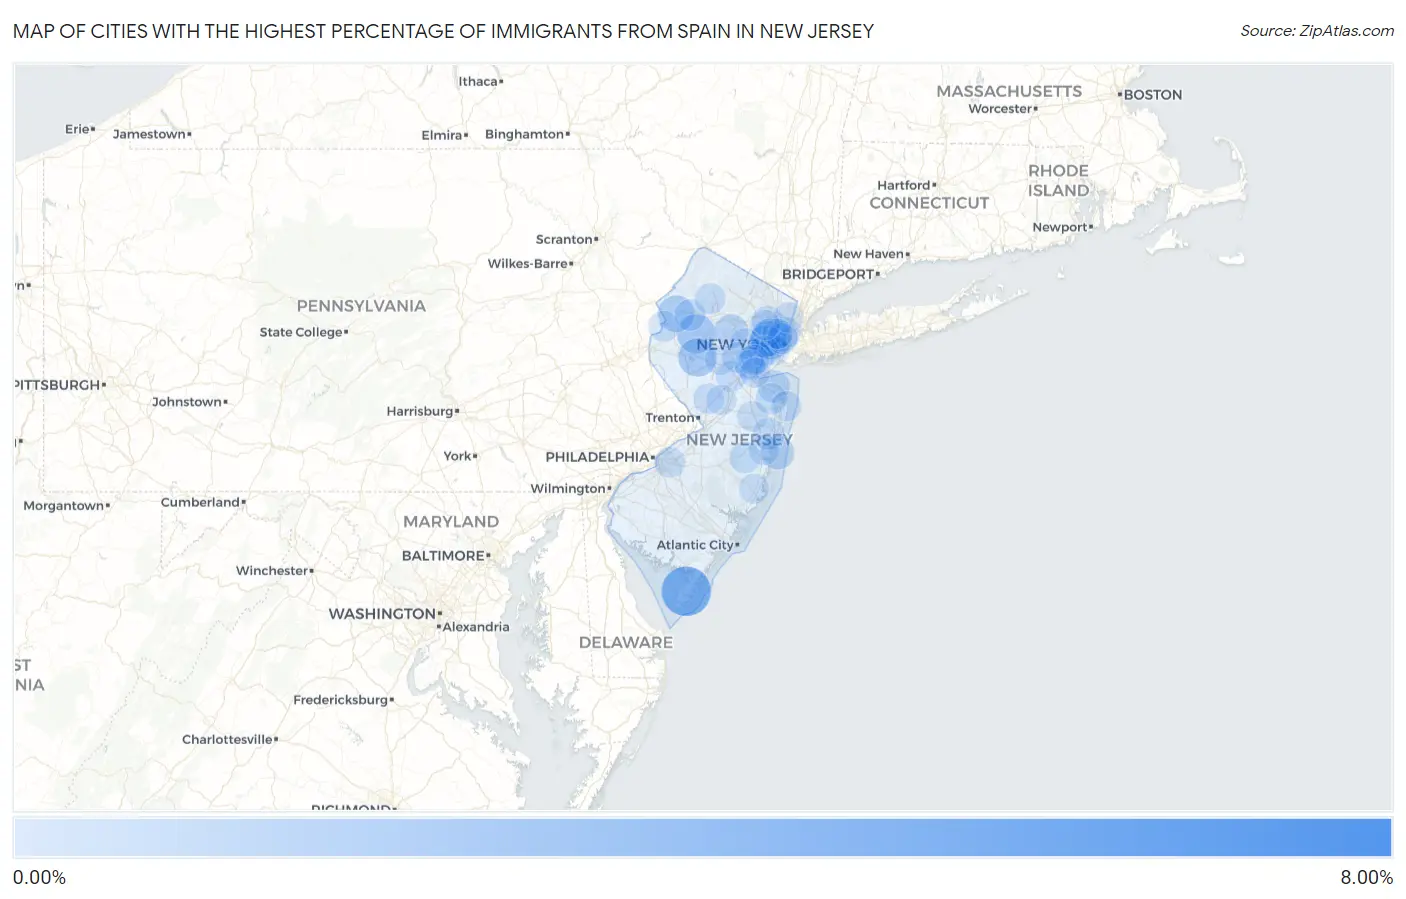
Map of Cities with the Highest Percentage of Immigrants from Spain in New Jersey
0.00%
8.00%
Cities with the Highest Percentage of Immigrants from Spain in New Jersey
| City | Spain | vs State | vs National | |
| 1. | Llewellyn Park | 6.61% | 0.11%(+6.50)#1 | 0.037%(+6.57)#6 |
| 2. | Whitesboro | 4.04% | 0.11%(+3.93)#2 | 0.037%(+4.01)#13 |
| 3. | Mountainside Borough | 2.83% | 0.11%(+2.72)#3 | 0.037%(+2.80)#18 |
| 4. | Kearny | 2.20% | 0.11%(+2.09)#4 | 0.037%(+2.16)#20 |
| 5. | Long Valley | 1.81% | 0.11%(+1.70)#5 | 0.037%(+1.77)#31 |
| 6. | White House Station | 1.74% | 0.11%(+1.63)#6 | 0.037%(+1.71)#35 |
| 7. | Peapack And Gladstone Borough | 1.52% | 0.11%(+1.41)#7 | 0.037%(+1.49)#42 |
| 8. | Hope | 1.37% | 0.11%(+1.26)#8 | 0.037%(+1.33)#49 |
| 9. | North Arlington Borough | 1.27% | 0.11%(+1.16)#9 | 0.037%(+1.24)#52 |
| 10. | Woodstown Borough | 1.20% | 0.11%(+1.08)#10 | 0.037%(+1.16)#57 |
| 11. | Harrison | 1.19% | 0.11%(+1.08)#11 | 0.037%(+1.15)#60 |
| 12. | North Plainfield Borough | 0.96% | 0.11%(+0.854)#12 | 0.037%(+0.928)#79 |
| 13. | Neshanic Station | 0.96% | 0.11%(+0.848)#13 | 0.037%(+0.923)#82 |
| 14. | Fairview Borough | 0.95% | 0.11%(+0.840)#14 | 0.037%(+0.914)#85 |
| 15. | Morristown | 0.88% | 0.11%(+0.774)#15 | 0.037%(+0.848)#93 |
| 16. | Kenilworth Borough | 0.87% | 0.11%(+0.764)#16 | 0.037%(+0.838)#95 |
| 17. | Freehold Borough | 0.87% | 0.11%(+0.761)#17 | 0.037%(+0.836)#96 |
| 18. | Cliffside Park Borough | 0.86% | 0.11%(+0.750)#18 | 0.037%(+0.825)#99 |
| 19. | Watchung Borough | 0.84% | 0.11%(+0.731)#19 | 0.037%(+0.805)#103 |
| 20. | Dover Beaches North | 0.83% | 0.11%(+0.715)#20 | 0.037%(+0.789)#106 |
| 21. | Sea Bright Borough | 0.80% | 0.11%(+0.687)#21 | 0.037%(+0.762)#113 |
| 22. | Island Heights Borough | 0.79% | 0.11%(+0.678)#22 | 0.037%(+0.752)#118 |
| 23. | Cookstown | 0.66% | 0.11%(+0.546)#23 | 0.037%(+0.620)#143 |
| 24. | Union | 0.61% | 0.11%(+0.494)#24 | 0.037%(+0.569)#166 |
| 25. | Port Monmouth | 0.54% | 0.11%(+0.425)#25 | 0.037%(+0.499)#191 |
| 26. | Linden | 0.51% | 0.11%(+0.400)#26 | 0.037%(+0.474)#202 |
| 27. | Newark | 0.51% | 0.11%(+0.399)#27 | 0.037%(+0.474)#205 |
| 28. | Rutherford Borough | 0.50% | 0.11%(+0.390)#28 | 0.037%(+0.465)#208 |
| 29. | Robbinsville Center | 0.49% | 0.11%(+0.384)#29 | 0.037%(+0.458)#211 |
| 30. | National Park Borough | 0.46% | 0.11%(+0.352)#30 | 0.037%(+0.426)#234 |
| 31. | Ramtown | 0.43% | 0.11%(+0.320)#31 | 0.037%(+0.394)#250 |
| 32. | Ridgefield Borough | 0.43% | 0.11%(+0.317)#32 | 0.037%(+0.391)#256 |
| 33. | Keasbey | 0.40% | 0.11%(+0.290)#33 | 0.037%(+0.364)#274 |
| 34. | Sea Girt Borough | 0.39% | 0.11%(+0.283)#34 | 0.037%(+0.357)#279 |
| 35. | Hopewell Borough | 0.38% | 0.11%(+0.273)#35 | 0.037%(+0.347)#290 |
| 36. | Palisades Park Borough | 0.38% | 0.11%(+0.270)#36 | 0.037%(+0.344)#294 |
| 37. | Rutgers University-Busch Campus | 0.36% | 0.11%(+0.249)#37 | 0.037%(+0.324)#311 |
| 38. | Colonia | 0.36% | 0.11%(+0.244)#38 | 0.037%(+0.319)#318 |
| 39. | Brielle Borough | 0.34% | 0.11%(+0.232)#39 | 0.037%(+0.306)#331 |
| 40. | Crestwood Village | 0.33% | 0.11%(+0.219)#40 | 0.037%(+0.294)#341 |
| 41. | Panther Valley | 0.33% | 0.11%(+0.218)#41 | 0.037%(+0.292)#345 |
| 42. | West New York | 0.31% | 0.11%(+0.204)#42 | 0.037%(+0.278)#362 |
| 43. | Haledon Borough | 0.31% | 0.11%(+0.202)#43 | 0.037%(+0.276)#365 |
| 44. | Lincroft | 0.31% | 0.11%(+0.198)#44 | 0.037%(+0.273)#372 |
| 45. | Roseland Borough | 0.31% | 0.11%(+0.195)#45 | 0.037%(+0.269)#378 |
| 46. | Woodland Park Borough | 0.30% | 0.11%(+0.190)#46 | 0.037%(+0.264)#382 |
| 47. | Oak Ridge | 0.30% | 0.11%(+0.189)#47 | 0.037%(+0.264)#386 |
| 48. | Clifton | 0.29% | 0.11%(+0.182)#48 | 0.037%(+0.256)#398 |
| 49. | Basking Ridge | 0.29% | 0.11%(+0.180)#49 | 0.037%(+0.254)#400 |
| 50. | Wood Ridge Borough | 0.29% | 0.11%(+0.180)#50 | 0.037%(+0.254)#401 |
| 51. | Demarest Borough | 0.28% | 0.11%(+0.173)#51 | 0.037%(+0.247)#411 |
| 52. | Summit | 0.26% | 0.11%(+0.146)#52 | 0.037%(+0.221)#466 |
| 53. | Bayonne | 0.25% | 0.11%(+0.143)#53 | 0.037%(+0.217)#475 |
| 54. | Maywood Borough | 0.25% | 0.11%(+0.138)#54 | 0.037%(+0.212)#487 |
| 55. | Fort Lee Borough | 0.24% | 0.11%(+0.133)#55 | 0.037%(+0.207)#505 |
| 56. | Lake Mohawk | 0.24% | 0.11%(+0.126)#56 | 0.037%(+0.201)#514 |
| 57. | Belvidere | 0.24% | 0.11%(+0.126)#57 | 0.037%(+0.200)#515 |
| 58. | Elizabeth | 0.24% | 0.11%(+0.126)#58 | 0.037%(+0.200)#516 |
| 59. | West Freehold | 0.24% | 0.11%(+0.125)#59 | 0.037%(+0.199)#518 |
| 60. | Upper Greenwood Lake | 0.23% | 0.11%(+0.123)#60 | 0.037%(+0.198)#520 |
| 61. | East Franklin | 0.23% | 0.11%(+0.115)#61 | 0.037%(+0.189)#534 |
| 62. | Hasbrouck Heights Borough | 0.22% | 0.11%(+0.113)#62 | 0.037%(+0.187)#542 |
| 63. | Essex Fells Borough | 0.22% | 0.11%(+0.108)#63 | 0.037%(+0.182)#550 |
| 64. | Paramus Borough | 0.22% | 0.11%(+0.107)#64 | 0.037%(+0.182)#551 |
| 65. | Union City | 0.21% | 0.11%(+0.102)#65 | 0.037%(+0.176)#561 |
| 66. | East Rutherford Borough | 0.21% | 0.11%(+0.099)#66 | 0.037%(+0.173)#567 |
| 67. | Mckee | 0.21% | 0.11%(+0.098)#67 | 0.037%(+0.173)#570 |
| 68. | Plainfield | 0.20% | 0.11%(+0.093)#68 | 0.037%(+0.168)#587 |
| 69. | Ship Bottom Borough | 0.20% | 0.11%(+0.090)#69 | 0.037%(+0.164)#595 |
| 70. | Ellisburg | 0.20% | 0.11%(+0.090)#70 | 0.037%(+0.164)#596 |
| 71. | Bogota Borough | 0.19% | 0.11%(+0.079)#71 | 0.037%(+0.154)#621 |
| 72. | Princeton | 0.18% | 0.11%(+0.070)#72 | 0.037%(+0.144)#643 |
| 73. | Hoboken | 0.18% | 0.11%(+0.068)#73 | 0.037%(+0.142)#647 |
| 74. | Ho Ho Kus Borough | 0.17% | 0.11%(+0.055)#74 | 0.037%(+0.129)#672 |
| 75. | Flemington Borough | 0.16% | 0.11%(+0.054)#75 | 0.037%(+0.128)#675 |
| 76. | Franklin Borough | 0.16% | 0.11%(+0.051)#76 | 0.037%(+0.126)#682 |
| 77. | Iselin | 0.16% | 0.11%(+0.051)#77 | 0.037%(+0.126)#684 |
| 78. | Brooklawn Borough | 0.16% | 0.11%(+0.048)#78 | 0.037%(+0.122)#697 |
| 79. | Oakland Borough | 0.16% | 0.11%(+0.046)#79 | 0.037%(+0.121)#705 |
| 80. | Toms River | 0.16% | 0.11%(+0.045)#80 | 0.037%(+0.120)#712 |
| 81. | Englewood | 0.15% | 0.11%(+0.044)#81 | 0.037%(+0.118)#715 |
| 82. | Rahway | 0.15% | 0.11%(+0.041)#82 | 0.037%(+0.115)#724 |
| 83. | Montvale Borough | 0.14% | 0.11%(+0.032)#83 | 0.037%(+0.106)#756 |
| 84. | Tinton Falls Borough | 0.14% | 0.11%(+0.030)#84 | 0.037%(+0.104)#763 |
| 85. | Dumont Borough | 0.14% | 0.11%(+0.028)#85 | 0.037%(+0.102)#771 |
| 86. | Long Branch | 0.13% | 0.11%(+0.018)#86 | 0.037%(+0.092)#801 |
| 87. | Madison Borough | 0.13% | 0.11%(+0.016)#87 | 0.037%(+0.091)#808 |
| 88. | Caldwell Borough | 0.12% | 0.11%(+0.013)#88 | 0.037%(+0.087)#821 |
| 89. | Highland Park Borough | 0.12% | 0.11%(+0.009)#89 | 0.037%(+0.084)#835 |
| 90. | Lodi Borough | 0.12% | 0.11%(+0.009)#90 | 0.037%(+0.083)#839 |
| 91. | Manville Borough | 0.12% | 0.11%(+0.009)#91 | 0.037%(+0.083)#840 |
| 92. | Princeton Meadows | 0.12% | 0.11%(+0.005)#92 | 0.037%(+0.079)#857 |
| 93. | Collingswood Borough | 0.11% | 0.11%(+0.002)#93 | 0.037%(+0.077)#865 |
| 94. | Secaucus | 0.11% | 0.11%(+0.001)#94 | 0.037%(+0.075)#871 |
| 95. | Hawthorne Borough | 0.11% | 0.11%(-0.003)#95 | 0.037%(+0.071)#890 |
| 96. | Martinsville | 0.11% | 0.11%(-0.006)#96 | 0.037%(+0.069)#908 |
| 97. | Ocean Acres | 0.099% | 0.11%(-0.012)#97 | 0.037%(+0.062)#929 |
| 98. | Perth Amboy | 0.098% | 0.11%(-0.013)#98 | 0.037%(+0.061)#938 |
| 99. | Brookdale | 0.097% | 0.11%(-0.014)#99 | 0.037%(+0.060)#941 |
| 100. | Fair Lawn Borough | 0.094% | 0.11%(-0.016)#100 | 0.037%(+0.058)#955 |
Common Questions
What are the Top 10 Cities with the Highest Percentage of Immigrants from Spain in New Jersey?
Top 10 Cities with the Highest Percentage of Immigrants from Spain in New Jersey are:
#1
4.04%
#2
2.20%
#3
1.81%
#4
1.74%
#5
1.37%
#6
1.19%
#7
0.88%
#8
0.83%
#9
0.54%
#10
0.51%
What city has the Highest Percentage of Immigrants from Spain in New Jersey?
Whitesboro has the Highest Percentage of Immigrants from Spain in New Jersey with 4.04%.
What is the Percentage of Immigrants from Spain in the State of New Jersey?
Percentage of Immigrants from Spain in New Jersey is 0.11%.
What is the Percentage of Immigrants from Spain in the United States?
Percentage of Immigrants from Spain in the United States is 0.037%.