Cities with the Most Immigrants from Oceania in New Jersey
RELATED REPORTS & OPTIONS
Oceania
New Jersey
Compare Cities
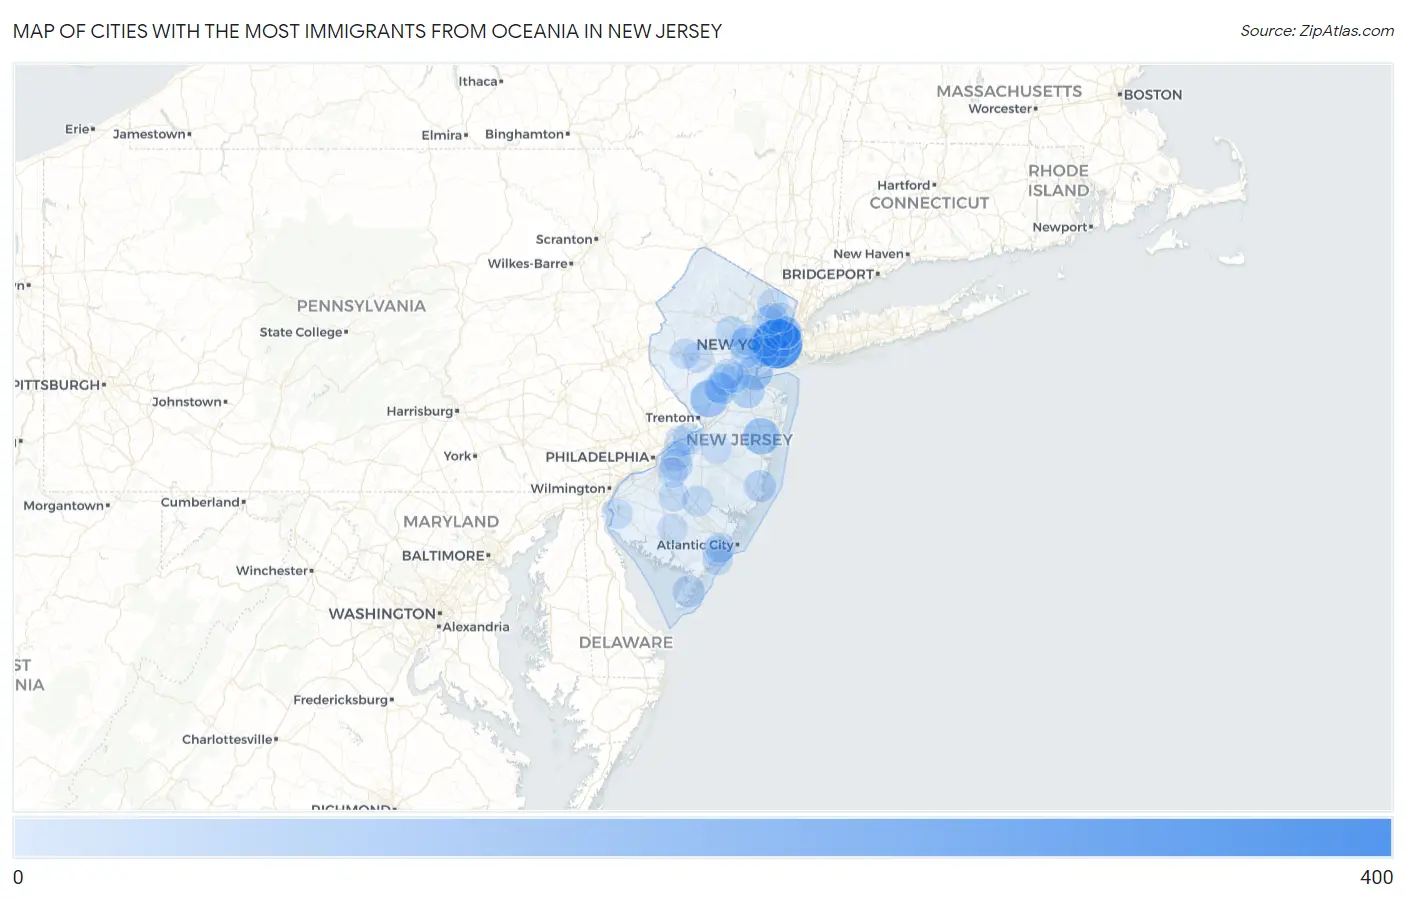
Map of Cities with the Most Immigrants from Oceania in New Jersey
0
400
Cities with the Most Immigrants from Oceania in New Jersey
| City | Oceania | vs State | vs National | |
| 1. | Jersey City | 315 | 3,154(9.99%)#1 | 293,459(0.11%)#144 |
| 2. | Edgewater Borough | 134 | 3,154(4.25%)#2 | 293,459(0.05%)#371 |
| 3. | Princeton | 110 | 3,154(3.49%)#3 | 293,459(0.04%)#437 |
| 4. | Lakewood | 100 | 3,154(3.17%)#4 | 293,459(0.03%)#477 |
| 5. | Hoboken | 91 | 3,154(2.89%)#5 | 293,459(0.03%)#520 |
| 6. | Perth Amboy | 80 | 3,154(2.54%)#6 | 293,459(0.03%)#580 |
| 7. | Madison Borough | 60 | 3,154(1.90%)#7 | 293,459(0.02%)#721 |
| 8. | Red Bank Borough | 60 | 3,154(1.90%)#8 | 293,459(0.02%)#723 |
| 9. | Old Bridge | 59 | 3,154(1.87%)#9 | 293,459(0.02%)#735 |
| 10. | Ramsey Borough | 47 | 3,154(1.49%)#10 | 293,459(0.02%)#862 |
| 11. | West New York | 42 | 3,154(1.33%)#11 | 293,459(0.01%)#934 |
| 12. | Englewood Cliffs Borough | 42 | 3,154(1.33%)#12 | 293,459(0.01%)#941 |
| 13. | Bayonne | 41 | 3,154(1.30%)#13 | 293,459(0.01%)#948 |
| 14. | Greentree | 41 | 3,154(1.30%)#14 | 293,459(0.01%)#956 |
| 15. | Rutherford Borough | 39 | 3,154(1.24%)#15 | 293,459(0.01%)#987 |
| 16. | Watsessing | 38 | 3,154(1.20%)#16 | 293,459(0.01%)#1,013 |
| 17. | Guttenberg | 33 | 3,154(1.05%)#17 | 293,459(0.01%)#1,116 |
| 18. | Barnegat | 33 | 3,154(1.05%)#18 | 293,459(0.01%)#1,120 |
| 19. | Summit | 32 | 3,154(1.01%)#19 | 293,459(0.01%)#1,138 |
| 20. | Spring Lake Heights Borough | 32 | 3,154(1.01%)#20 | 293,459(0.01%)#1,145 |
| 21. | Burleigh | 32 | 3,154(1.01%)#21 | 293,459(0.01%)#1,149 |
| 22. | Basking Ridge | 31 | 3,154(0.98%)#22 | 293,459(0.01%)#1,164 |
| 23. | Bellmawr Borough | 27 | 3,154(0.86%)#23 | 293,459(0.01%)#1,275 |
| 24. | Kendall Park | 27 | 3,154(0.86%)#24 | 293,459(0.01%)#1,277 |
| 25. | Burlington | 26 | 3,154(0.82%)#25 | 293,459(0.01%)#1,305 |
| 26. | Bergenfield Borough | 25 | 3,154(0.79%)#26 | 293,459(0.01%)#1,320 |
| 27. | Tenafly Borough | 25 | 3,154(0.79%)#27 | 293,459(0.01%)#1,329 |
| 28. | Haddonfield Borough | 24 | 3,154(0.76%)#28 | 293,459(0.01%)#1,369 |
| 29. | Somerville Borough | 23 | 3,154(0.73%)#29 | 293,459(0.01%)#1,407 |
| 30. | Far Hills Borough | 23 | 3,154(0.73%)#30 | 293,459(0.01%)#1,424 |
| 31. | Parsippany | 22 | 3,154(0.70%)#31 | 293,459(0.01%)#1,439 |
| 32. | Saddle River Borough | 22 | 3,154(0.70%)#32 | 293,459(0.01%)#1,456 |
| 33. | Newark | 20 | 3,154(0.63%)#33 | 293,459(0.01%)#1,511 |
| 34. | Elizabeth | 20 | 3,154(0.63%)#34 | 293,459(0.01%)#1,513 |
| 35. | Westfield | 20 | 3,154(0.63%)#35 | 293,459(0.01%)#1,528 |
| 36. | Spring Lake Borough | 20 | 3,154(0.63%)#36 | 293,459(0.01%)#1,550 |
| 37. | Morristown | 19 | 3,154(0.60%)#37 | 293,459(0.01%)#1,576 |
| 38. | Old Tappan Borough | 19 | 3,154(0.60%)#38 | 293,459(0.01%)#1,591 |
| 39. | Ledgewood | 19 | 3,154(0.60%)#39 | 293,459(0.01%)#1,595 |
| 40. | Six Mile Run | 19 | 3,154(0.60%)#40 | 293,459(0.01%)#1,601 |
| 41. | Clifton | 18 | 3,154(0.57%)#41 | 293,459(0.01%)#1,612 |
| 42. | Collingswood Borough | 18 | 3,154(0.57%)#42 | 293,459(0.01%)#1,635 |
| 43. | Cresskill Borough | 18 | 3,154(0.57%)#43 | 293,459(0.01%)#1,646 |
| 44. | Demarest Borough | 18 | 3,154(0.57%)#44 | 293,459(0.01%)#1,656 |
| 45. | Beverly | 18 | 3,154(0.57%)#45 | 293,459(0.01%)#1,658 |
| 46. | Secaucus | 17 | 3,154(0.54%)#46 | 293,459(0.01%)#1,681 |
| 47. | Short Hills | 17 | 3,154(0.54%)#47 | 293,459(0.01%)#1,689 |
| 48. | Ten Mile Run | 15 | 3,154(0.48%)#48 | 293,459(0.01%)#1,842 |
| 49. | Paramus Borough | 14 | 3,154(0.44%)#49 | 293,459(0.00%)#1,865 |
| 50. | Garfield | 13 | 3,154(0.41%)#50 | 293,459(0.00%)#1,937 |
| 51. | Little Silver Borough | 13 | 3,154(0.41%)#51 | 293,459(0.00%)#1,968 |
| 52. | Atlantic Highlands Borough | 13 | 3,154(0.41%)#52 | 293,459(0.00%)#1,979 |
| 53. | New Brunswick | 11 | 3,154(0.35%)#53 | 293,459(0.00%)#2,096 |
| 54. | Ridgewood | 11 | 3,154(0.35%)#54 | 293,459(0.00%)#2,116 |
| 55. | Hammonton | 11 | 3,154(0.35%)#55 | 293,459(0.00%)#2,134 |
| 56. | Mountain Lakes Borough | 11 | 3,154(0.35%)#56 | 293,459(0.00%)#2,162 |
| 57. | Tinton Falls Borough | 10 | 3,154(0.32%)#57 | 293,459(0.00%)#2,211 |
| 58. | Moorestown Lenola | 10 | 3,154(0.32%)#58 | 293,459(0.00%)#2,217 |
| 59. | Somers Point | 10 | 3,154(0.32%)#59 | 293,459(0.00%)#2,222 |
| 60. | Maywood Borough | 10 | 3,154(0.32%)#60 | 293,459(0.00%)#2,224 |
| 61. | White House Station | 10 | 3,154(0.32%)#61 | 293,459(0.00%)#2,244 |
| 62. | Williamstown | 9 | 3,154(0.29%)#62 | 293,459(0.00%)#2,305 |
| 63. | Glen Rock Borough | 9 | 3,154(0.29%)#63 | 293,459(0.00%)#2,312 |
| 64. | Bound Brook Borough | 9 | 3,154(0.29%)#64 | 293,459(0.00%)#2,313 |
| 65. | Salem | 9 | 3,154(0.29%)#65 | 293,459(0.00%)#2,338 |
| 66. | Fair Lawn Borough | 8 | 3,154(0.25%)#66 | 293,459(0.00%)#2,388 |
| 67. | Ocean City | 8 | 3,154(0.25%)#67 | 293,459(0.00%)#2,420 |
| 68. | Fort Dix | 8 | 3,154(0.25%)#68 | 293,459(0.00%)#2,429 |
| 69. | Linwood | 8 | 3,154(0.25%)#69 | 293,459(0.00%)#2,433 |
| 70. | Alpha Borough | 8 | 3,154(0.25%)#70 | 293,459(0.00%)#2,452 |
| 71. | Echelon | 7 | 3,154(0.22%)#71 | 293,459(0.00%)#2,512 |
| 72. | Oradell Borough | 7 | 3,154(0.22%)#72 | 293,459(0.00%)#2,533 |
| 73. | Annandale | 7 | 3,154(0.22%)#73 | 293,459(0.00%)#2,563 |
| 74. | Califon Borough | 7 | 3,154(0.22%)#74 | 293,459(0.00%)#2,577 |
| 75. | Vineland | 6 | 3,154(0.19%)#75 | 293,459(0.00%)#2,598 |
| 76. | Oakland Borough | 6 | 3,154(0.19%)#76 | 293,459(0.00%)#2,629 |
| 77. | Peapack And Gladstone Borough | 6 | 3,154(0.19%)#77 | 293,459(0.00%)#2,671 |
| 78. | Pine Beach Borough | 6 | 3,154(0.19%)#78 | 293,459(0.00%)#2,676 |
| 79. | Somerset | 5 | 3,154(0.16%)#79 | 293,459(0.00%)#2,728 |
| 80. | Woodbury Heights Borough | 5 | 3,154(0.16%)#80 | 293,459(0.00%)#2,765 |
| 81. | Sicklerville | 3 | 3,154(0.10%)#81 | 293,459(0.00%)#2,916 |
| 82. | Manville Borough | 3 | 3,154(0.10%)#82 | 293,459(0.00%)#2,928 |
| 83. | Caldwell Borough | 3 | 3,154(0.10%)#83 | 293,459(0.00%)#2,932 |
| 84. | Pitman Borough | 3 | 3,154(0.10%)#84 | 293,459(0.00%)#2,933 |
| 85. | Emerson Borough | 3 | 3,154(0.10%)#85 | 293,459(0.00%)#2,937 |
| 86. | Brooklawn Borough | 3 | 3,154(0.10%)#86 | 293,459(0.00%)#2,954 |
| 87. | Frenchtown Borough | 3 | 3,154(0.10%)#87 | 293,459(0.00%)#2,965 |
| 88. | Hackensack | 1 | 3,154(0.03%)#88 | 293,459(0.00%)#3,130 |
Common Questions
What are the Top 10 Cities with the Most Immigrants from Oceania in New Jersey?
Top 10 Cities with the Most Immigrants from Oceania in New Jersey are:
#1
315
#2
110
#3
100
#4
91
#5
80
#6
59
#7
42
#8
41
#9
41
#10
33
What city has the Most Immigrants from Oceania in New Jersey?
Jersey City has the Most Immigrants from Oceania in New Jersey with 315.
What is the Total Immigrants from Oceania in the State of New Jersey?
Total Immigrants from Oceania in New Jersey is 3,154.
What is the Total Immigrants from Oceania in the United States?
Total Immigrants from Oceania in the United States is 293,459.