Cities with the Largest Jamaican Community in New Jersey
RELATED REPORTS & OPTIONS
Jamaican
New Jersey
Compare Cities
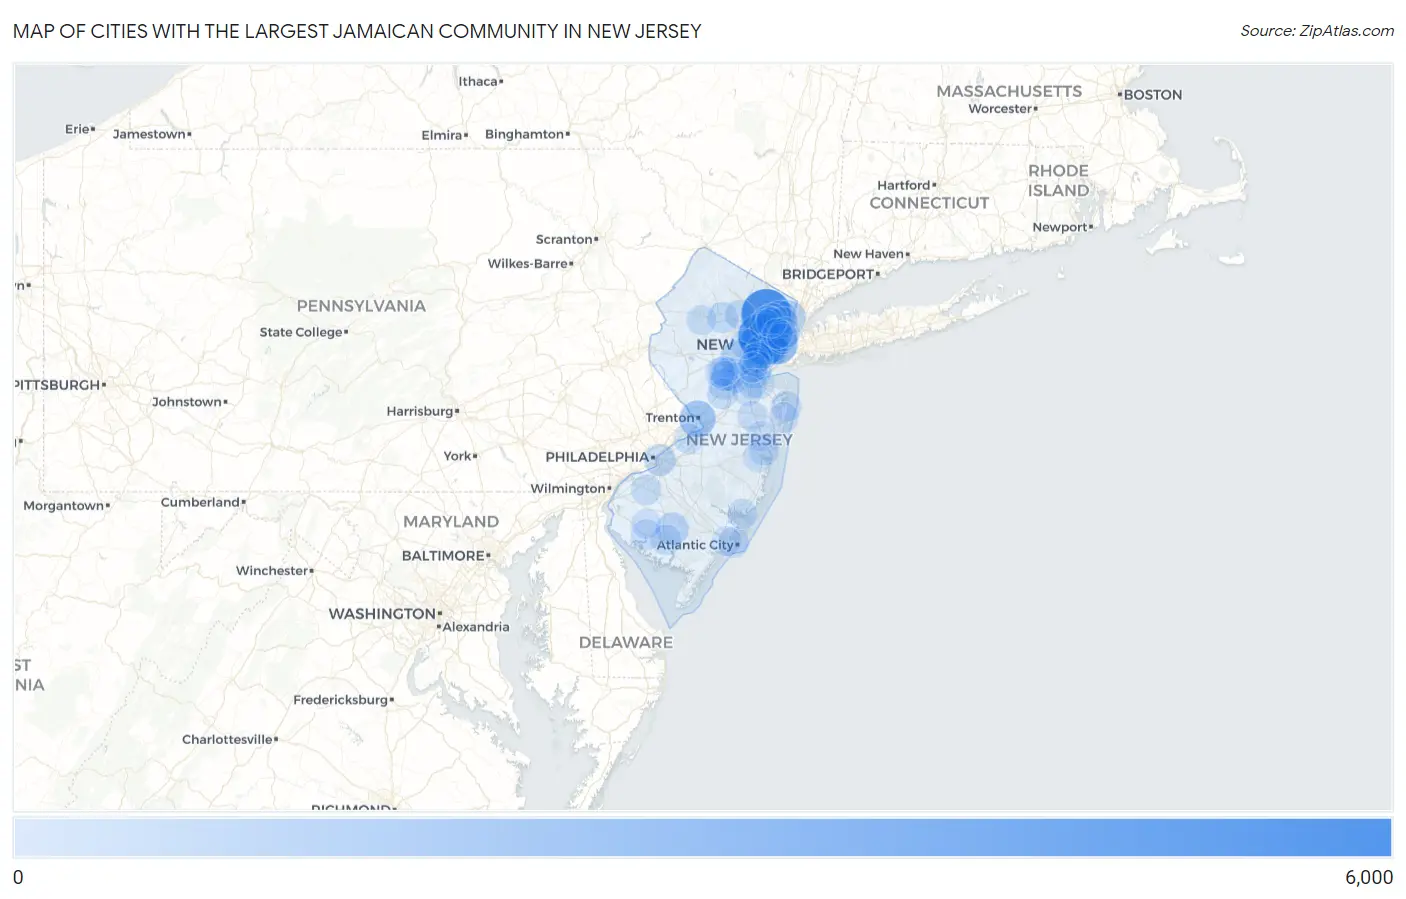
Map of Cities with the Largest Jamaican Community in New Jersey
0
6,000
Cities with the Largest Jamaican Community in New Jersey
| City | Jamaican | vs State | vs National | |
| 1. | Paterson | 5,331 | 69,540(7.67%)#1 | 1,203,841(0.44%)#24 |
| 2. | Newark | 4,662 | 69,540(6.70%)#2 | 1,203,841(0.39%)#29 |
| 3. | East Orange | 4,400 | 69,540(6.33%)#3 | 1,203,841(0.37%)#32 |
| 4. | Jersey City | 2,825 | 69,540(4.06%)#4 | 1,203,841(0.23%)#46 |
| 5. | Trenton | 1,701 | 69,540(2.45%)#5 | 1,203,841(0.14%)#79 |
| 6. | Elizabeth | 1,201 | 69,540(1.73%)#6 | 1,203,841(0.10%)#115 |
| 7. | Englewood | 1,111 | 69,540(1.60%)#7 | 1,203,841(0.09%)#127 |
| 8. | Hackensack | 1,100 | 69,540(1.58%)#8 | 1,203,841(0.09%)#128 |
| 9. | Plainfield | 1,020 | 69,540(1.47%)#9 | 1,203,841(0.08%)#142 |
| 10. | Somerset | 849 | 69,540(1.22%)#10 | 1,203,841(0.07%)#178 |
| 11. | Vineland | 748 | 69,540(1.08%)#11 | 1,203,841(0.06%)#196 |
| 12. | Elmwood Park Borough | 704 | 69,540(1.01%)#12 | 1,203,841(0.06%)#202 |
| 13. | North Plainfield Borough | 580 | 69,540(0.83%)#13 | 1,203,841(0.05%)#244 |
| 14. | Camden | 573 | 69,540(0.82%)#14 | 1,203,841(0.05%)#250 |
| 15. | Lodi Borough | 533 | 69,540(0.77%)#15 | 1,203,841(0.04%)#272 |
| 16. | Rahway | 512 | 69,540(0.74%)#16 | 1,203,841(0.04%)#281 |
| 17. | Franklin Park | 441 | 69,540(0.63%)#17 | 1,203,841(0.04%)#313 |
| 18. | Sayreville Borough | 438 | 69,540(0.63%)#18 | 1,203,841(0.04%)#315 |
| 19. | Roselle Borough | 422 | 69,540(0.61%)#19 | 1,203,841(0.04%)#325 |
| 20. | Fair Lawn Borough | 405 | 69,540(0.58%)#20 | 1,203,841(0.03%)#337 |
| 21. | Hasbrouck Heights Borough | 372 | 69,540(0.53%)#21 | 1,203,841(0.03%)#367 |
| 22. | Perth Amboy | 360 | 69,540(0.52%)#22 | 1,203,841(0.03%)#380 |
| 23. | Bergenfield Borough | 346 | 69,540(0.50%)#23 | 1,203,841(0.03%)#394 |
| 24. | Bogota Borough | 342 | 69,540(0.49%)#24 | 1,203,841(0.03%)#397 |
| 25. | Ridgefield Park | 315 | 69,540(0.45%)#25 | 1,203,841(0.03%)#428 |
| 26. | Dover | 311 | 69,540(0.45%)#26 | 1,203,841(0.03%)#431 |
| 27. | Garfield | 303 | 69,540(0.44%)#27 | 1,203,841(0.03%)#440 |
| 28. | Brookdale | 290 | 69,540(0.42%)#28 | 1,203,841(0.02%)#458 |
| 29. | South Plainfield Borough | 285 | 69,540(0.41%)#29 | 1,203,841(0.02%)#466 |
| 30. | Millville | 275 | 69,540(0.40%)#30 | 1,203,841(0.02%)#477 |
| 31. | Watsessing | 275 | 69,540(0.40%)#31 | 1,203,841(0.02%)#479 |
| 32. | Lindenwold Borough | 273 | 69,540(0.39%)#32 | 1,203,841(0.02%)#483 |
| 33. | Bridgeton | 270 | 69,540(0.39%)#33 | 1,203,841(0.02%)#488 |
| 34. | New Brunswick | 263 | 69,540(0.38%)#34 | 1,203,841(0.02%)#504 |
| 35. | Clifton | 257 | 69,540(0.37%)#35 | 1,203,841(0.02%)#512 |
| 36. | Silver Lake Cdp Essex County | 249 | 69,540(0.36%)#36 | 1,203,841(0.02%)#531 |
| 37. | Mullica Hill | 246 | 69,540(0.35%)#37 | 1,203,841(0.02%)#540 |
| 38. | Monmouth Junction | 242 | 69,540(0.35%)#38 | 1,203,841(0.02%)#548 |
| 39. | Sicklerville | 224 | 69,540(0.32%)#39 | 1,203,841(0.02%)#582 |
| 40. | Port Reading | 224 | 69,540(0.32%)#40 | 1,203,841(0.02%)#585 |
| 41. | Atlantic City | 208 | 69,540(0.30%)#41 | 1,203,841(0.02%)#618 |
| 42. | Bayonne | 204 | 69,540(0.29%)#42 | 1,203,841(0.02%)#629 |
| 43. | Boonton | 204 | 69,540(0.29%)#43 | 1,203,841(0.02%)#632 |
| 44. | Hoboken | 203 | 69,540(0.29%)#44 | 1,203,841(0.02%)#633 |
| 45. | Long Branch | 201 | 69,540(0.29%)#45 | 1,203,841(0.02%)#642 |
| 46. | River Edge Borough | 192 | 69,540(0.28%)#46 | 1,203,841(0.02%)#665 |
| 47. | Hillsdale Borough | 189 | 69,540(0.27%)#47 | 1,203,841(0.02%)#676 |
| 48. | Tinton Falls Borough | 187 | 69,540(0.27%)#48 | 1,203,841(0.02%)#685 |
| 49. | Toms River | 184 | 69,540(0.26%)#49 | 1,203,841(0.02%)#690 |
| 50. | Asbury Park | 182 | 69,540(0.26%)#50 | 1,203,841(0.02%)#698 |
| 51. | Pine Hill Borough | 174 | 69,540(0.25%)#51 | 1,203,841(0.01%)#723 |
| 52. | Union City | 173 | 69,540(0.25%)#52 | 1,203,841(0.01%)#727 |
| 53. | Fort Lee Borough | 172 | 69,540(0.25%)#53 | 1,203,841(0.01%)#728 |
| 54. | Ringwood Borough | 168 | 69,540(0.24%)#54 | 1,203,841(0.01%)#744 |
| 55. | Highland Park Borough | 162 | 69,540(0.23%)#55 | 1,203,841(0.01%)#765 |
| 56. | West Freehold | 160 | 69,540(0.23%)#56 | 1,203,841(0.01%)#776 |
| 57. | Middlebush | 159 | 69,540(0.23%)#57 | 1,203,841(0.01%)#783 |
| 58. | Avenel | 156 | 69,540(0.22%)#58 | 1,203,841(0.01%)#788 |
| 59. | Linden | 148 | 69,540(0.21%)#59 | 1,203,841(0.01%)#826 |
| 60. | Hawthorne Borough | 148 | 69,540(0.21%)#60 | 1,203,841(0.01%)#827 |
| 61. | Carteret Borough | 146 | 69,540(0.21%)#61 | 1,203,841(0.01%)#837 |
| 62. | Burlington | 146 | 69,540(0.21%)#62 | 1,203,841(0.01%)#838 |
| 63. | Dunellen Borough | 134 | 69,540(0.19%)#63 | 1,203,841(0.01%)#888 |
| 64. | Totowa Borough | 133 | 69,540(0.19%)#64 | 1,203,841(0.01%)#897 |
| 65. | West New York | 132 | 69,540(0.19%)#65 | 1,203,841(0.01%)#907 |
| 66. | Mystic Island | 125 | 69,540(0.18%)#66 | 1,203,841(0.01%)#940 |
| 67. | Budd Lake | 120 | 69,540(0.17%)#67 | 1,203,841(0.01%)#967 |
| 68. | Ramsey Borough | 114 | 69,540(0.16%)#68 | 1,203,841(0.01%)#1,012 |
| 69. | Landing | 114 | 69,540(0.16%)#69 | 1,203,841(0.01%)#1,017 |
| 70. | Red Bank Borough | 112 | 69,540(0.16%)#70 | 1,203,841(0.01%)#1,031 |
| 71. | Lakewood | 108 | 69,540(0.16%)#71 | 1,203,841(0.01%)#1,052 |
| 72. | Maywood Borough | 107 | 69,540(0.15%)#72 | 1,203,841(0.01%)#1,065 |
| 73. | Cliffwood Beach | 106 | 69,540(0.15%)#73 | 1,203,841(0.01%)#1,071 |
| 74. | Pleasantville | 105 | 69,540(0.15%)#74 | 1,203,841(0.01%)#1,079 |
| 75. | New Milford Borough | 104 | 69,540(0.15%)#75 | 1,203,841(0.01%)#1,087 |
| 76. | Passaic | 103 | 69,540(0.15%)#76 | 1,203,841(0.01%)#1,092 |
| 77. | Metuchen Borough | 102 | 69,540(0.15%)#77 | 1,203,841(0.01%)#1,104 |
| 78. | Neptune City Borough | 102 | 69,540(0.15%)#78 | 1,203,841(0.01%)#1,106 |
| 79. | Dumont Borough | 101 | 69,540(0.15%)#79 | 1,203,841(0.01%)#1,110 |
| 80. | Cliffside Park Borough | 100 | 69,540(0.14%)#80 | 1,203,841(0.01%)#1,119 |
| 81. | Madison Park | 99 | 69,540(0.14%)#81 | 1,203,841(0.01%)#1,135 |
| 82. | Palmyra Borough | 97 | 69,540(0.14%)#82 | 1,203,841(0.01%)#1,150 |
| 83. | Old Bridge | 96 | 69,540(0.14%)#83 | 1,203,841(0.01%)#1,156 |
| 84. | Netcong Borough | 95 | 69,540(0.14%)#84 | 1,203,841(0.01%)#1,173 |
| 85. | Secaucus | 93 | 69,540(0.13%)#85 | 1,203,841(0.01%)#1,185 |
| 86. | Summit | 91 | 69,540(0.13%)#86 | 1,203,841(0.01%)#1,199 |
| 87. | Seabrook Farms | 91 | 69,540(0.13%)#87 | 1,203,841(0.01%)#1,203 |
| 88. | Holiday City South | 90 | 69,540(0.13%)#88 | 1,203,841(0.01%)#1,215 |
| 89. | Wood Ridge Borough | 87 | 69,540(0.13%)#89 | 1,203,841(0.01%)#1,245 |
| 90. | Franklin Center | 84 | 69,540(0.12%)#90 | 1,203,841(0.01%)#1,286 |
| 91. | Weston | 82 | 69,540(0.12%)#91 | 1,203,841(0.01%)#1,310 |
| 92. | Woodbridge | 79 | 69,540(0.11%)#92 | 1,203,841(0.01%)#1,332 |
| 93. | Roselle Park Borough | 79 | 69,540(0.11%)#93 | 1,203,841(0.01%)#1,336 |
| 94. | Waldwick Borough | 79 | 69,540(0.11%)#94 | 1,203,841(0.01%)#1,337 |
| 95. | East Rutherford Borough | 79 | 69,540(0.11%)#95 | 1,203,841(0.01%)#1,338 |
| 96. | Lake Hopatcong | 78 | 69,540(0.11%)#96 | 1,203,841(0.01%)#1,344 |
| 97. | Somerville Borough | 75 | 69,540(0.11%)#97 | 1,203,841(0.01%)#1,369 |
| 98. | Palisades Park Borough | 73 | 69,540(0.10%)#98 | 1,203,841(0.01%)#1,386 |
| 99. | Gouldtown | 71 | 69,540(0.10%)#99 | 1,203,841(0.01%)#1,420 |
| 100. | Madison Borough | 68 | 69,540(0.10%)#100 | 1,203,841(0.01%)#1,459 |
Common Questions
What are the Top 10 Cities with the Largest Jamaican Community in New Jersey?
Top 10 Cities with the Largest Jamaican Community in New Jersey are:
#1
5,331
#2
4,662
#3
4,400
#4
2,825
#5
1,701
#6
1,201
#7
1,111
#8
1,100
#9
1,020
#10
849
What city has the Largest Jamaican Community in New Jersey?
Paterson has the Largest Jamaican Community in New Jersey with 5,331.
What is the Total Jamaican Population in the State of New Jersey?
Total Jamaican Population in New Jersey is 69,540.
What is the Total Jamaican Population in the United States?
Total Jamaican Population in the United States is 1,203,841.