Cities with the Highest Percentage of Nigerian Population in New Jersey
RELATED REPORTS & OPTIONS
Nigerian
New Jersey
Compare Cities
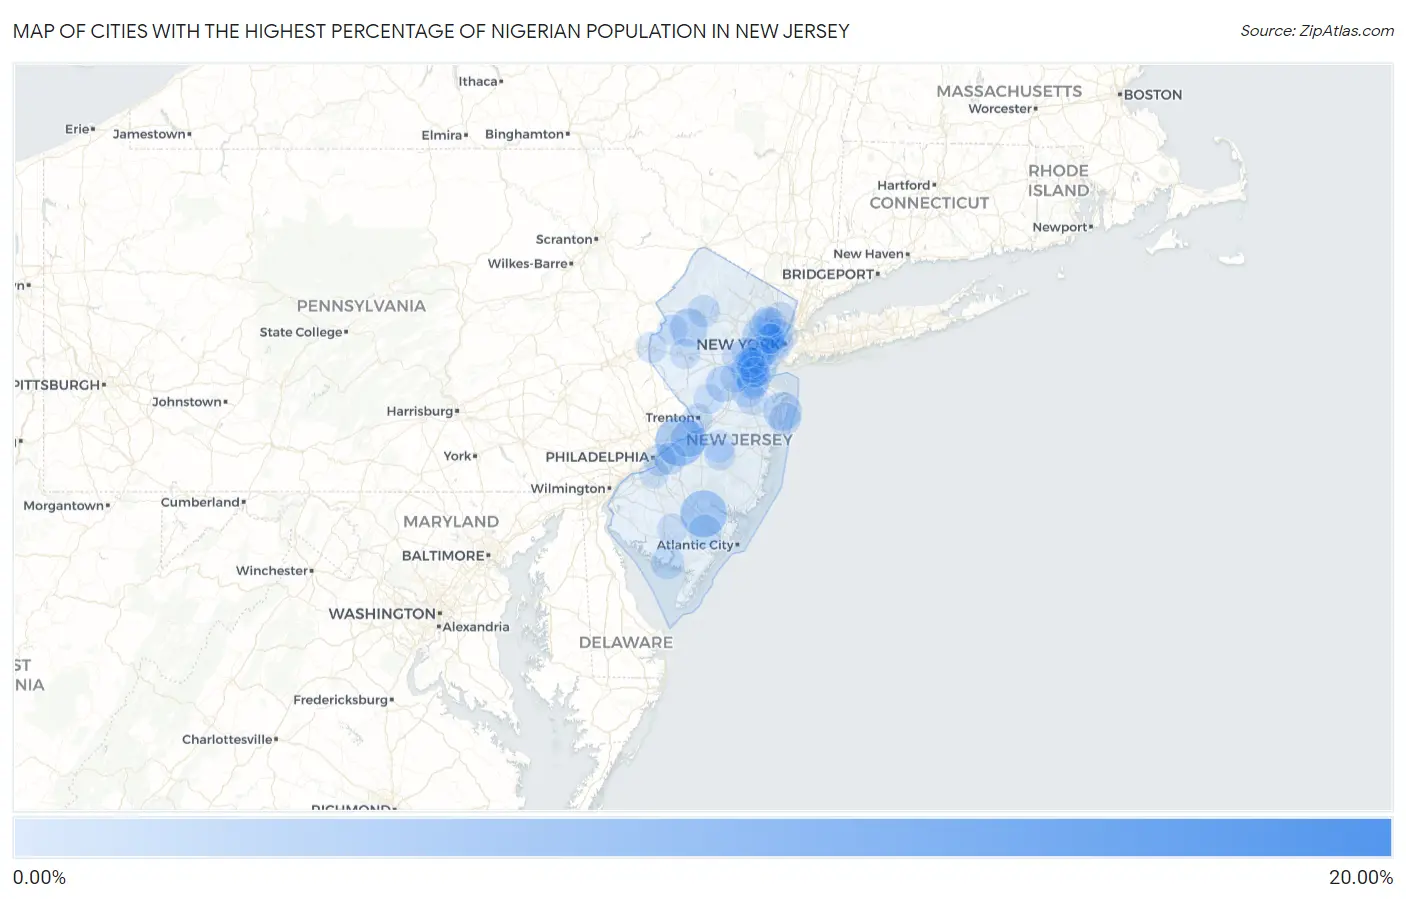
Map of Cities with the Highest Percentage of Nigerian Population in New Jersey
0.00%
20.00%
Cities with the Highest Percentage of Nigerian Population in New Jersey
| City | Nigerian | vs State | vs National | |
| 1. | Vauxhall | 18.91% | 0.36%(+18.6)#1 | 0.18%(+18.7)#3 |
| 2. | Forsgate | 6.39% | 0.36%(+6.04)#2 | 0.18%(+6.22)#23 |
| 3. | Beverly | 6.00% | 0.36%(+5.64)#3 | 0.18%(+5.82)#26 |
| 4. | Elwood | 5.22% | 0.36%(+4.87)#4 | 0.18%(+5.05)#39 |
| 5. | Hightstown Borough | 3.44% | 0.36%(+3.09)#5 | 0.18%(+3.27)#76 |
| 6. | Peapack And Gladstone Borough | 3.12% | 0.36%(+2.77)#6 | 0.18%(+2.95)#87 |
| 7. | Port Reading | 3.12% | 0.36%(+2.76)#7 | 0.18%(+2.94)#88 |
| 8. | Woodlynne Borough | 2.72% | 0.36%(+2.37)#8 | 0.18%(+2.54)#104 |
| 9. | Oakhurst | 2.66% | 0.36%(+2.30)#9 | 0.18%(+2.48)#108 |
| 10. | East Orange | 2.62% | 0.36%(+2.27)#10 | 0.18%(+2.44)#111 |
| 11. | Beattystown | 2.56% | 0.36%(+2.20)#11 | 0.18%(+2.38)#112 |
| 12. | Fords | 2.48% | 0.36%(+2.12)#12 | 0.18%(+2.30)#115 |
| 13. | Oaklyn Borough | 2.26% | 0.36%(+1.91)#13 | 0.18%(+2.08)#128 |
| 14. | Newark | 2.17% | 0.36%(+1.82)#14 | 0.18%(+2.00)#133 |
| 15. | Burlington | 2.15% | 0.36%(+1.79)#15 | 0.18%(+1.97)#137 |
| 16. | Franklin Park | 1.95% | 0.36%(+1.60)#16 | 0.18%(+1.78)#157 |
| 17. | Pine Beach Borough | 1.83% | 0.36%(+1.48)#17 | 0.18%(+1.66)#166 |
| 18. | Pottersville | 1.80% | 0.36%(+1.45)#18 | 0.18%(+1.63)#171 |
| 19. | Ampere North | 1.76% | 0.36%(+1.41)#19 | 0.18%(+1.59)#178 |
| 20. | Watsessing | 1.76% | 0.36%(+1.41)#20 | 0.18%(+1.59)#179 |
| 21. | Sicklerville | 1.63% | 0.36%(+1.28)#21 | 0.18%(+1.46)#197 |
| 22. | South Amboy | 1.53% | 0.36%(+1.18)#22 | 0.18%(+1.36)#215 |
| 23. | Avenel | 1.19% | 0.36%(+0.836)#23 | 0.18%(+1.02)#305 |
| 24. | Wallington Borough | 1.17% | 0.36%(+0.819)#24 | 0.18%(+0.998)#309 |
| 25. | Port Norris | 1.17% | 0.36%(+0.814)#25 | 0.18%(+0.993)#311 |
| 26. | Mays Landing | 1.15% | 0.36%(+0.793)#26 | 0.18%(+0.973)#320 |
| 27. | Branchville Borough | 0.99% | 0.36%(+0.634)#27 | 0.18%(+0.813)#376 |
| 28. | Swedesboro Borough | 0.96% | 0.36%(+0.606)#28 | 0.18%(+0.785)#399 |
| 29. | Ramapo College Of New Jersey | 0.94% | 0.36%(+0.581)#29 | 0.18%(+0.761)#410 |
| 30. | Spotswood Borough | 0.91% | 0.36%(+0.555)#30 | 0.18%(+0.734)#419 |
| 31. | Byram Center | 0.86% | 0.36%(+0.508)#31 | 0.18%(+0.688)#442 |
| 32. | Mcguire Afb | 0.82% | 0.36%(+0.464)#32 | 0.18%(+0.643)#470 |
| 33. | Linden | 0.81% | 0.36%(+0.457)#33 | 0.18%(+0.636)#473 |
| 34. | Ocean Grove | 0.80% | 0.36%(+0.444)#34 | 0.18%(+0.623)#486 |
| 35. | Camden | 0.78% | 0.36%(+0.425)#35 | 0.18%(+0.604)#494 |
| 36. | Old Bridge | 0.77% | 0.36%(+0.414)#36 | 0.18%(+0.593)#504 |
| 37. | Caldwell Borough | 0.76% | 0.36%(+0.409)#37 | 0.18%(+0.589)#510 |
| 38. | South Plainfield Borough | 0.70% | 0.36%(+0.349)#38 | 0.18%(+0.529)#544 |
| 39. | Cherry Hill Mall | 0.70% | 0.36%(+0.349)#39 | 0.18%(+0.528)#545 |
| 40. | Glassboro Borough | 0.69% | 0.36%(+0.336)#40 | 0.18%(+0.515)#553 |
| 41. | Parsippany | 0.66% | 0.36%(+0.310)#41 | 0.18%(+0.489)#576 |
| 42. | William Paterson University Of New Jersey | 0.63% | 0.36%(+0.278)#42 | 0.18%(+0.458)#611 |
| 43. | Lake Hopatcong | 0.61% | 0.36%(+0.256)#43 | 0.18%(+0.435)#639 |
| 44. | Bloomsbury Borough | 0.58% | 0.36%(+0.226)#44 | 0.18%(+0.406)#688 |
| 45. | Barrington Borough | 0.57% | 0.36%(+0.215)#45 | 0.18%(+0.394)#707 |
| 46. | Lindenwold Borough | 0.57% | 0.36%(+0.212)#46 | 0.18%(+0.391)#710 |
| 47. | Brookdale | 0.52% | 0.36%(+0.169)#47 | 0.18%(+0.348)#757 |
| 48. | Phillipsburg | 0.51% | 0.36%(+0.158)#48 | 0.18%(+0.337)#772 |
| 49. | Madison Park | 0.51% | 0.36%(+0.152)#49 | 0.18%(+0.331)#784 |
| 50. | Hackensack | 0.49% | 0.36%(+0.130)#50 | 0.18%(+0.309)#813 |
| 51. | Sayreville Borough | 0.45% | 0.36%(+0.090)#51 | 0.18%(+0.270)#874 |
| 52. | Roselle Borough | 0.44% | 0.36%(+0.089)#52 | 0.18%(+0.269)#876 |
| 53. | Stockton University | 0.42% | 0.36%(+0.068)#53 | 0.18%(+0.248)#913 |
| 54. | Robertsville | 0.42% | 0.36%(+0.064)#54 | 0.18%(+0.243)#924 |
| 55. | Somerville Borough | 0.41% | 0.36%(+0.054)#55 | 0.18%(+0.233)#947 |
| 56. | Oxford | 0.40% | 0.36%(+0.045)#56 | 0.18%(+0.225)#960 |
| 57. | Jersey City | 0.39% | 0.36%(+0.032)#57 | 0.18%(+0.211)#978 |
| 58. | Kean University | 0.38% | 0.36%(+0.026)#58 | 0.18%(+0.205)#995 |
| 59. | Vineland | 0.36% | 0.36%(+0.008)#59 | 0.18%(+0.188)#1,039 |
| 60. | Plainfield | 0.35% | 0.36%(-0.007)#60 | 0.18%(+0.172)#1,078 |
| 61. | Bogota Borough | 0.35% | 0.36%(-0.008)#61 | 0.18%(+0.171)#1,079 |
| 62. | New Milford Borough | 0.34% | 0.36%(-0.012)#62 | 0.18%(+0.168)#1,087 |
| 63. | Browns Mills | 0.34% | 0.36%(-0.017)#63 | 0.18%(+0.162)#1,101 |
| 64. | Collingswood Borough | 0.33% | 0.36%(-0.030)#64 | 0.18%(+0.150)#1,135 |
| 65. | Carteret Borough | 0.32% | 0.36%(-0.033)#65 | 0.18%(+0.146)#1,144 |
| 66. | Lodi Borough | 0.32% | 0.36%(-0.035)#66 | 0.18%(+0.144)#1,151 |
| 67. | Woodbridge | 0.31% | 0.36%(-0.044)#67 | 0.18%(+0.135)#1,176 |
| 68. | Highland Park Borough | 0.29% | 0.36%(-0.068)#68 | 0.18%(+0.111)#1,240 |
| 69. | Trenton | 0.29% | 0.36%(-0.070)#69 | 0.18%(+0.110)#1,249 |
| 70. | Cliffside Park Borough | 0.28% | 0.36%(-0.073)#70 | 0.18%(+0.106)#1,256 |
| 71. | Leonia Borough | 0.28% | 0.36%(-0.075)#71 | 0.18%(+0.105)#1,262 |
| 72. | Fair Lawn Borough | 0.28% | 0.36%(-0.077)#72 | 0.18%(+0.102)#1,274 |
| 73. | Annandale | 0.27% | 0.36%(-0.085)#73 | 0.18%(+0.094)#1,299 |
| 74. | Fairview Borough | 0.27% | 0.36%(-0.087)#74 | 0.18%(+0.092)#1,304 |
| 75. | Union City | 0.25% | 0.36%(-0.104)#75 | 0.18%(+0.076)#1,348 |
| 76. | Bergenfield Borough | 0.25% | 0.36%(-0.107)#76 | 0.18%(+0.072)#1,363 |
| 77. | Fanwood Borough | 0.25% | 0.36%(-0.109)#77 | 0.18%(+0.070)#1,368 |
| 78. | Bayonne | 0.24% | 0.36%(-0.115)#78 | 0.18%(+0.064)#1,394 |
| 79. | Secaucus | 0.24% | 0.36%(-0.117)#79 | 0.18%(+0.062)#1,407 |
| 80. | Edgewater Borough | 0.23% | 0.36%(-0.126)#80 | 0.18%(+0.054)#1,440 |
| 81. | Harrison | 0.23% | 0.36%(-0.126)#81 | 0.18%(+0.053)#1,442 |
| 82. | Princeton | 0.23% | 0.36%(-0.128)#82 | 0.18%(+0.051)#1,446 |
| 83. | Elizabeth | 0.19% | 0.36%(-0.161)#83 | 0.18%(+0.018)#1,561 |
| 84. | Pompton Lakes Borough | 0.19% | 0.36%(-0.165)#84 | 0.18%(+0.014)#1,577 |
| 85. | Lyons | 0.18% | 0.36%(-0.176)#85 | 0.18%(+0.003)#1,633 |
| 86. | Red Bank Borough | 0.18% | 0.36%(-0.176)#86 | 0.18%(+0.003)#1,635 |
| 87. | Colonia | 0.18% | 0.36%(-0.177)#87 | 0.18%(+0.002)#1,640 |
| 88. | Westmont | 0.18% | 0.36%(-0.178)#88 | 0.18%(+0.001)#1,649 |
| 89. | Montclair State University | 0.18% | 0.36%(-0.180)#89 | 0.18%(-0.001)#1,659 |
| 90. | New Brunswick | 0.16% | 0.36%(-0.195)#90 | 0.18%(-0.016)#1,740 |
| 91. | Woodbury | 0.14% | 0.36%(-0.215)#91 | 0.18%(-0.035)#1,866 |
| 92. | Tinton Falls Borough | 0.13% | 0.36%(-0.225)#92 | 0.18%(-0.045)#1,930 |
| 93. | Tenafly Borough | 0.12% | 0.36%(-0.231)#93 | 0.18%(-0.052)#1,974 |
| 94. | Passaic | 0.12% | 0.36%(-0.232)#94 | 0.18%(-0.053)#1,982 |
| 95. | Franklin Lakes Borough | 0.12% | 0.36%(-0.237)#95 | 0.18%(-0.058)#2,011 |
| 96. | Kearny | 0.12% | 0.36%(-0.238)#96 | 0.18%(-0.059)#2,016 |
| 97. | Westfield | 0.11% | 0.36%(-0.242)#97 | 0.18%(-0.062)#2,032 |
| 98. | Eatontown Borough | 0.11% | 0.36%(-0.244)#98 | 0.18%(-0.065)#2,052 |
| 99. | Clifton | 0.10% | 0.36%(-0.253)#99 | 0.18%(-0.074)#2,115 |
| 100. | Perth Amboy | 0.10% | 0.36%(-0.254)#100 | 0.18%(-0.074)#2,121 |
Common Questions
What are the Top 10 Cities with the Highest Percentage of Nigerian Population in New Jersey?
Top 10 Cities with the Highest Percentage of Nigerian Population in New Jersey are:
#1
6.00%
#2
5.22%
#3
3.12%
#4
2.66%
#5
2.62%
#6
2.56%
#7
2.48%
#8
2.17%
#9
2.15%
#10
1.95%
What city has the Highest Percentage of Nigerian Population in New Jersey?
Beverly has the Highest Percentage of Nigerian Population in New Jersey with 6.00%.
What is the Percentage of Nigerian Population in the State of New Jersey?
Percentage of Nigerian Population in New Jersey is 0.36%.
What is the Percentage of Nigerian Population in the United States?
Percentage of Nigerian Population in the United States is 0.18%.