Cities with the Highest Percentage of Slovak Population in New Jersey
RELATED REPORTS & OPTIONS
Slovak
New Jersey
Compare Cities
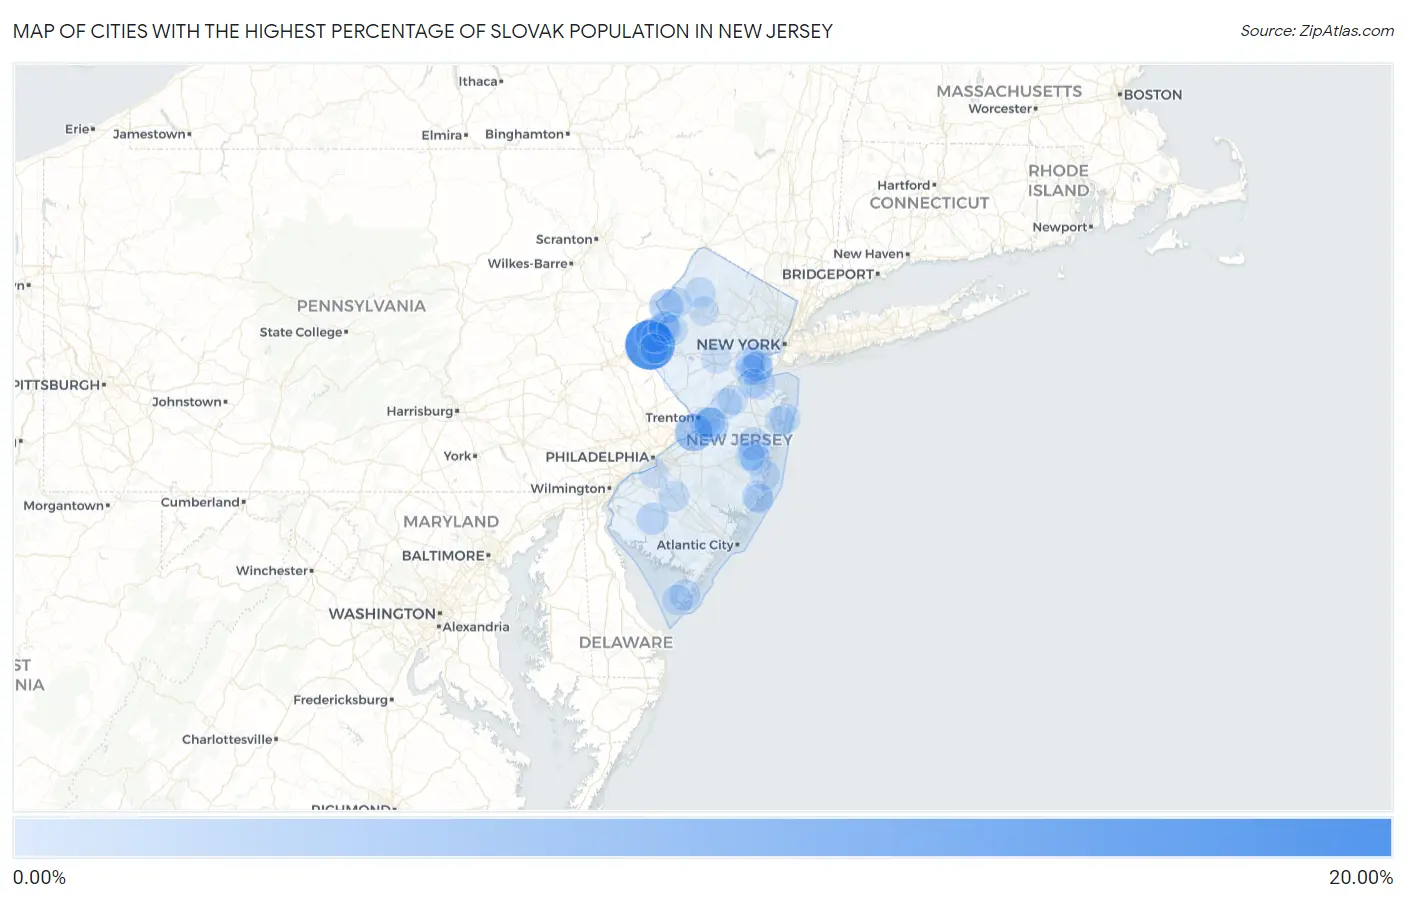
Map of Cities with the Highest Percentage of Slovak Population in New Jersey
0.00%
20.00%
Cities with the Highest Percentage of Slovak Population in New Jersey
| City | Slovak | vs State | vs National | |
| 1. | Delaware Park | 16.57% | 0.31%(+16.3)#1 | 0.19%(+16.4)#22 |
| 2. | Oceanville | 9.93% | 0.31%(+9.62)#2 | 0.19%(+9.74)#61 |
| 3. | Florence | 6.73% | 0.31%(+6.42)#3 | 0.19%(+6.54)#155 |
| 4. | Oldwick | 4.79% | 0.31%(+4.48)#4 | 0.19%(+4.60)#279 |
| 5. | Groveville | 4.56% | 0.31%(+4.25)#5 | 0.19%(+4.37)#297 |
| 6. | Brainards | 4.22% | 0.31%(+3.91)#6 | 0.19%(+4.03)#339 |
| 7. | Pluckemin | 4.21% | 0.31%(+3.89)#7 | 0.19%(+4.01)#342 |
| 8. | Lakehurst Borough | 4.11% | 0.31%(+3.80)#8 | 0.19%(+3.92)#360 |
| 9. | Hainesburg | 3.89% | 0.31%(+3.58)#9 | 0.19%(+3.70)#381 |
| 10. | Neshanic | 3.58% | 0.31%(+3.27)#10 | 0.19%(+3.39)#417 |
| 11. | Interlaken Borough | 3.54% | 0.31%(+3.23)#11 | 0.19%(+3.35)#424 |
| 12. | Flagtown | 3.40% | 0.31%(+3.09)#12 | 0.19%(+3.21)#446 |
| 13. | Alpha Borough | 3.37% | 0.31%(+3.06)#13 | 0.19%(+3.18)#454 |
| 14. | Gillette | 3.10% | 0.31%(+2.78)#14 | 0.19%(+2.90)#513 |
| 15. | Sewaren | 2.93% | 0.31%(+2.62)#15 | 0.19%(+2.74)#540 |
| 16. | Cedar Glen West | 2.91% | 0.31%(+2.60)#16 | 0.19%(+2.72)#546 |
| 17. | Olivet | 2.74% | 0.31%(+2.42)#17 | 0.19%(+2.54)#586 |
| 18. | Brookfield | 2.71% | 0.31%(+2.40)#18 | 0.19%(+2.52)#597 |
| 19. | Manville Borough | 2.63% | 0.31%(+2.31)#19 | 0.19%(+2.43)#616 |
| 20. | Sea Bright Borough | 2.46% | 0.31%(+2.14)#20 | 0.19%(+2.26)#646 |
| 21. | Union Beach Borough | 2.23% | 0.31%(+1.91)#21 | 0.19%(+2.03)#722 |
| 22. | Greenwich | 2.20% | 0.31%(+1.89)#22 | 0.19%(+2.01)#729 |
| 23. | Oceanport Borough | 2.11% | 0.31%(+1.80)#23 | 0.19%(+1.92)#762 |
| 24. | Point Pleasant Beach Borough | 2.03% | 0.31%(+1.72)#24 | 0.19%(+1.84)#794 |
| 25. | Far Hills Borough | 2.01% | 0.31%(+1.69)#25 | 0.19%(+1.81)#803 |
| 26. | Cliffwood Beach | 1.96% | 0.31%(+1.65)#26 | 0.19%(+1.77)#818 |
| 27. | Ho Ho Kus Borough | 1.96% | 0.31%(+1.65)#27 | 0.19%(+1.77)#822 |
| 28. | Beach Haven Borough | 1.89% | 0.31%(+1.57)#28 | 0.19%(+1.69)#849 |
| 29. | North Haledon Borough | 1.82% | 0.31%(+1.51)#29 | 0.19%(+1.63)#882 |
| 30. | Rio Grande | 1.81% | 0.31%(+1.50)#30 | 0.19%(+1.62)#883 |
| 31. | Cookstown | 1.81% | 0.31%(+1.49)#31 | 0.19%(+1.61)#885 |
| 32. | Garwood Borough | 1.78% | 0.31%(+1.47)#32 | 0.19%(+1.59)#900 |
| 33. | White Horse | 1.73% | 0.31%(+1.42)#33 | 0.19%(+1.54)#920 |
| 34. | Manahawkin | 1.73% | 0.31%(+1.42)#34 | 0.19%(+1.54)#922 |
| 35. | Newton | 1.72% | 0.31%(+1.41)#35 | 0.19%(+1.53)#929 |
| 36. | Califon Borough | 1.70% | 0.31%(+1.39)#36 | 0.19%(+1.51)#938 |
| 37. | Williamstown | 1.68% | 0.31%(+1.37)#37 | 0.19%(+1.49)#951 |
| 38. | The Ponds | 1.64% | 0.31%(+1.32)#38 | 0.19%(+1.44)#969 |
| 39. | Metuchen Borough | 1.60% | 0.31%(+1.29)#39 | 0.19%(+1.41)#985 |
| 40. | Ocean Grove | 1.53% | 0.31%(+1.22)#40 | 0.19%(+1.34)#1,021 |
| 41. | Cranbury | 1.52% | 0.31%(+1.21)#41 | 0.19%(+1.33)#1,032 |
| 42. | Harmony | 1.52% | 0.31%(+1.21)#42 | 0.19%(+1.33)#1,033 |
| 43. | Colonia | 1.52% | 0.31%(+1.21)#43 | 0.19%(+1.33)#1,036 |
| 44. | Layton | 1.50% | 0.31%(+1.19)#44 | 0.19%(+1.31)#1,046 |
| 45. | Seaside Park Borough | 1.50% | 0.31%(+1.19)#45 | 0.19%(+1.31)#1,048 |
| 46. | Germania | 1.50% | 0.31%(+1.19)#46 | 0.19%(+1.31)#1,049 |
| 47. | Blairstown | 1.50% | 0.31%(+1.19)#47 | 0.19%(+1.31)#1,053 |
| 48. | Holiday City Berkeley | 1.45% | 0.31%(+1.14)#48 | 0.19%(+1.26)#1,077 |
| 49. | Mantoloking Borough | 1.44% | 0.31%(+1.13)#49 | 0.19%(+1.25)#1,083 |
| 50. | Yardville | 1.44% | 0.31%(+1.12)#50 | 0.19%(+1.25)#1,085 |
| 51. | Seaville | 1.42% | 0.31%(+1.11)#51 | 0.19%(+1.23)#1,094 |
| 52. | Three Bridges | 1.41% | 0.31%(+1.09)#52 | 0.19%(+1.21)#1,104 |
| 53. | Port Reading | 1.39% | 0.31%(+1.07)#53 | 0.19%(+1.19)#1,112 |
| 54. | Belvidere | 1.38% | 0.31%(+1.07)#54 | 0.19%(+1.19)#1,114 |
| 55. | Oxford | 1.36% | 0.31%(+1.05)#55 | 0.19%(+1.17)#1,127 |
| 56. | Fords | 1.34% | 0.31%(+1.03)#56 | 0.19%(+1.15)#1,141 |
| 57. | Mount Hope | 1.33% | 0.31%(+1.01)#57 | 0.19%(+1.13)#1,151 |
| 58. | Holiday Heights | 1.32% | 0.31%(+1.01)#58 | 0.19%(+1.13)#1,157 |
| 59. | Butler Borough | 1.32% | 0.31%(+1.01)#59 | 0.19%(+1.13)#1,158 |
| 60. | Bridgewater Center | 1.31% | 0.31%(+0.999)#60 | 0.19%(+1.12)#1,167 |
| 61. | Lake Hiawatha | 1.30% | 0.31%(+0.990)#61 | 0.19%(+1.11)#1,172 |
| 62. | North Cape May | 1.28% | 0.31%(+0.967)#62 | 0.19%(+1.09)#1,194 |
| 63. | Hopewell Borough | 1.26% | 0.31%(+0.949)#63 | 0.19%(+1.07)#1,208 |
| 64. | New Providence Borough | 1.26% | 0.31%(+0.946)#64 | 0.19%(+1.07)#1,214 |
| 65. | Shark River Hills | 1.23% | 0.31%(+0.918)#65 | 0.19%(+1.04)#1,232 |
| 66. | Forked River | 1.22% | 0.31%(+0.908)#66 | 0.19%(+1.03)#1,240 |
| 67. | Stockton University | 1.20% | 0.31%(+0.888)#67 | 0.19%(+1.01)#1,258 |
| 68. | Lake Hopatcong | 1.18% | 0.31%(+0.872)#68 | 0.19%(+0.992)#1,276 |
| 69. | West Wildwood Borough | 1.17% | 0.31%(+0.859)#69 | 0.19%(+0.980)#1,289 |
| 70. | Hampton Borough | 1.13% | 0.31%(+0.816)#70 | 0.19%(+0.936)#1,327 |
| 71. | Berlin Borough | 1.12% | 0.31%(+0.810)#71 | 0.19%(+0.930)#1,332 |
| 72. | Rossmoor | 1.12% | 0.31%(+0.807)#72 | 0.19%(+0.927)#1,336 |
| 73. | Newfoundland | 1.11% | 0.31%(+0.803)#73 | 0.19%(+0.923)#1,341 |
| 74. | Lyons | 1.11% | 0.31%(+0.799)#74 | 0.19%(+0.919)#1,347 |
| 75. | Frenchtown Borough | 1.10% | 0.31%(+0.787)#75 | 0.19%(+0.907)#1,359 |
| 76. | Fieldsboro Borough | 1.09% | 0.31%(+0.781)#76 | 0.19%(+0.902)#1,365 |
| 77. | Linden | 1.08% | 0.31%(+0.770)#77 | 0.19%(+0.890)#1,379 |
| 78. | Whippany | 1.08% | 0.31%(+0.769)#78 | 0.19%(+0.889)#1,381 |
| 79. | Folsom Borough | 1.08% | 0.31%(+0.767)#79 | 0.19%(+0.888)#1,382 |
| 80. | Wallington Borough | 1.01% | 0.31%(+0.702)#80 | 0.19%(+0.822)#1,451 |
| 81. | South Plainfield Borough | 1.00% | 0.31%(+0.685)#81 | 0.19%(+0.806)#1,469 |
| 82. | Glen Gardner Borough | 0.99% | 0.31%(+0.682)#82 | 0.19%(+0.802)#1,476 |
| 83. | Allentown Borough | 0.99% | 0.31%(+0.679)#83 | 0.19%(+0.799)#1,477 |
| 84. | Parsippany | 0.97% | 0.31%(+0.661)#84 | 0.19%(+0.781)#1,502 |
| 85. | Byram Center | 0.96% | 0.31%(+0.653)#85 | 0.19%(+0.774)#1,514 |
| 86. | Woodbury | 0.96% | 0.31%(+0.650)#86 | 0.19%(+0.770)#1,519 |
| 87. | Neshanic Station | 0.96% | 0.31%(+0.648)#87 | 0.19%(+0.768)#1,526 |
| 88. | Upper Pohatcong | 0.96% | 0.31%(+0.647)#88 | 0.19%(+0.767)#1,527 |
| 89. | Forsgate | 0.96% | 0.31%(+0.645)#89 | 0.19%(+0.765)#1,529 |
| 90. | Green Knoll | 0.95% | 0.31%(+0.638)#90 | 0.19%(+0.758)#1,538 |
| 91. | Eatontown Borough | 0.95% | 0.31%(+0.635)#91 | 0.19%(+0.755)#1,542 |
| 92. | Old Tappan Borough | 0.94% | 0.31%(+0.627)#92 | 0.19%(+0.747)#1,560 |
| 93. | Basking Ridge | 0.94% | 0.31%(+0.625)#93 | 0.19%(+0.745)#1,569 |
| 94. | Pine Ridge At Crestwood | 0.93% | 0.31%(+0.623)#94 | 0.19%(+0.744)#1,573 |
| 95. | Mendham Borough | 0.93% | 0.31%(+0.614)#95 | 0.19%(+0.735)#1,589 |
| 96. | Madison Park | 0.92% | 0.31%(+0.605)#96 | 0.19%(+0.725)#1,607 |
| 97. | Ship Bottom Borough | 0.90% | 0.31%(+0.593)#97 | 0.19%(+0.713)#1,616 |
| 98. | Ogdensburg Borough | 0.90% | 0.31%(+0.591)#98 | 0.19%(+0.712)#1,621 |
| 99. | Beach Haven West | 0.87% | 0.31%(+0.562)#99 | 0.19%(+0.683)#1,666 |
| 100. | New Gretna | 0.87% | 0.31%(+0.554)#100 | 0.19%(+0.674)#1,682 |
Common Questions
What are the Top 10 Cities with the Highest Percentage of Slovak Population in New Jersey?
Top 10 Cities with the Highest Percentage of Slovak Population in New Jersey are:
#1
16.57%
#2
6.73%
#3
4.56%
#4
4.22%
#5
3.89%
#6
2.93%
#7
2.91%
#8
2.74%
#9
2.71%
#10
2.20%
What city has the Highest Percentage of Slovak Population in New Jersey?
Delaware Park has the Highest Percentage of Slovak Population in New Jersey with 16.57%.
What is the Percentage of Slovak Population in the State of New Jersey?
Percentage of Slovak Population in New Jersey is 0.31%.
What is the Percentage of Slovak Population in the United States?
Percentage of Slovak Population in the United States is 0.19%.