Cities with the Largest Eastern European Community in New Jersey
RELATED REPORTS & OPTIONS
Eastern European
New Jersey
Compare Cities
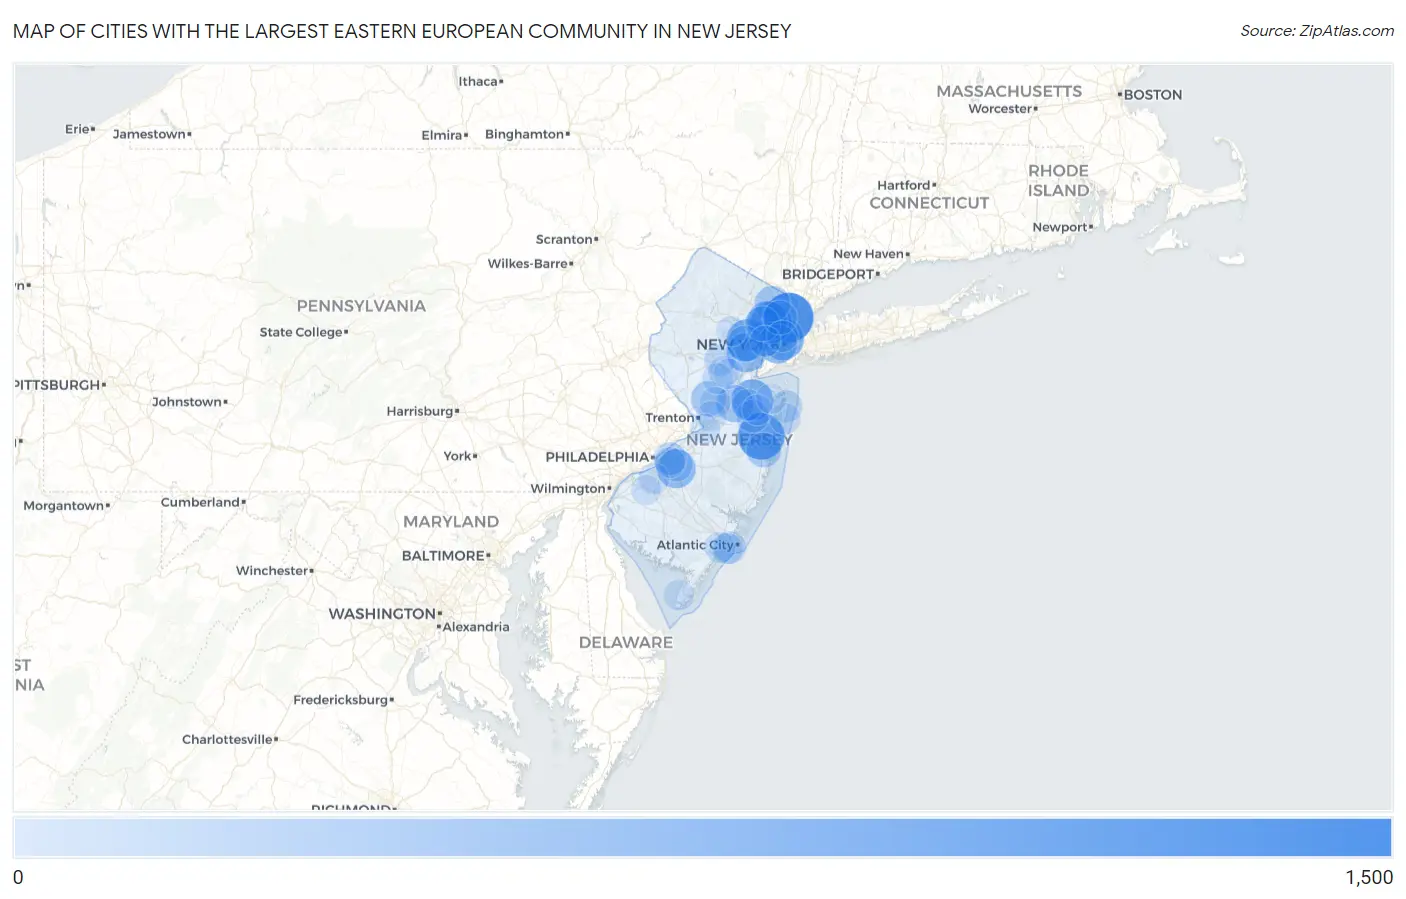
Map of Cities with the Largest Eastern European Community in New Jersey
0
1,500
Cities with the Largest Eastern European Community in New Jersey
| City | Eastern European | vs State | vs National | |
| 1. | Englewood | 1,275 | 60,875(2.09%)#1 | 1,005,654(0.13%)#51 |
| 2. | Lakewood | 1,100 | 60,875(1.81%)#2 | 1,005,654(0.11%)#64 |
| 3. | Glen Rock Borough | 974 | 60,875(1.60%)#3 | 1,005,654(0.10%)#86 |
| 4. | Hoboken | 839 | 60,875(1.38%)#4 | 1,005,654(0.08%)#106 |
| 5. | Short Hills | 788 | 60,875(1.29%)#5 | 1,005,654(0.08%)#118 |
| 6. | Passaic | 785 | 60,875(1.29%)#6 | 1,005,654(0.08%)#120 |
| 7. | Robertsville | 772 | 60,875(1.27%)#7 | 1,005,654(0.08%)#122 |
| 8. | Tenafly Borough | 730 | 60,875(1.20%)#8 | 1,005,654(0.07%)#132 |
| 9. | Clifton | 687 | 60,875(1.13%)#9 | 1,005,654(0.07%)#145 |
| 10. | Fair Lawn Borough | 653 | 60,875(1.07%)#10 | 1,005,654(0.06%)#157 |
| 11. | Westfield | 643 | 60,875(1.06%)#11 | 1,005,654(0.06%)#160 |
| 12. | Jersey City | 636 | 60,875(1.04%)#12 | 1,005,654(0.06%)#163 |
| 13. | Springdale | 614 | 60,875(1.01%)#13 | 1,005,654(0.06%)#169 |
| 14. | Concordia | 505 | 60,875(0.83%)#14 | 1,005,654(0.05%)#216 |
| 15. | Fort Lee Borough | 446 | 60,875(0.73%)#15 | 1,005,654(0.04%)#242 |
| 16. | Summit | 442 | 60,875(0.73%)#16 | 1,005,654(0.04%)#248 |
| 17. | Franklin Lakes Borough | 440 | 60,875(0.72%)#17 | 1,005,654(0.04%)#251 |
| 18. | Ridgewood | 421 | 60,875(0.69%)#18 | 1,005,654(0.04%)#268 |
| 19. | Princeton | 410 | 60,875(0.67%)#19 | 1,005,654(0.04%)#274 |
| 20. | Bergenfield Borough | 405 | 60,875(0.67%)#20 | 1,005,654(0.04%)#277 |
| 21. | Stonebridge | 400 | 60,875(0.66%)#21 | 1,005,654(0.04%)#280 |
| 22. | Upper Montclair | 371 | 60,875(0.61%)#22 | 1,005,654(0.04%)#306 |
| 23. | Toms River | 367 | 60,875(0.60%)#23 | 1,005,654(0.04%)#316 |
| 24. | River Edge Borough | 323 | 60,875(0.53%)#24 | 1,005,654(0.03%)#372 |
| 25. | Hackensack | 321 | 60,875(0.53%)#25 | 1,005,654(0.03%)#379 |
| 26. | Highland Park Borough | 294 | 60,875(0.48%)#26 | 1,005,654(0.03%)#427 |
| 27. | Metuchen Borough | 281 | 60,875(0.46%)#27 | 1,005,654(0.03%)#447 |
| 28. | Woodcliff Lake Borough | 271 | 60,875(0.45%)#28 | 1,005,654(0.03%)#471 |
| 29. | Closter Borough | 268 | 60,875(0.44%)#29 | 1,005,654(0.03%)#481 |
| 30. | Greentree | 255 | 60,875(0.42%)#30 | 1,005,654(0.03%)#507 |
| 31. | Cherry Hill Mall | 254 | 60,875(0.42%)#31 | 1,005,654(0.03%)#511 |
| 32. | Lake Hopatcong | 239 | 60,875(0.39%)#32 | 1,005,654(0.02%)#548 |
| 33. | West Freehold | 237 | 60,875(0.39%)#33 | 1,005,654(0.02%)#554 |
| 34. | Oceanport Borough | 223 | 60,875(0.37%)#34 | 1,005,654(0.02%)#612 |
| 35. | Preakness | 217 | 60,875(0.36%)#35 | 1,005,654(0.02%)#632 |
| 36. | Long Branch | 211 | 60,875(0.35%)#36 | 1,005,654(0.02%)#652 |
| 37. | Ventnor City | 204 | 60,875(0.34%)#37 | 1,005,654(0.02%)#677 |
| 38. | Demarest Borough | 203 | 60,875(0.33%)#38 | 1,005,654(0.02%)#682 |
| 39. | Sayreville Borough | 196 | 60,875(0.32%)#39 | 1,005,654(0.02%)#720 |
| 40. | Middlesex Borough | 188 | 60,875(0.31%)#40 | 1,005,654(0.02%)#760 |
| 41. | The Hills | 188 | 60,875(0.31%)#41 | 1,005,654(0.02%)#761 |
| 42. | Towaco | 185 | 60,875(0.30%)#42 | 1,005,654(0.02%)#772 |
| 43. | Paramus Borough | 181 | 60,875(0.30%)#43 | 1,005,654(0.02%)#787 |
| 44. | Martinsville | 174 | 60,875(0.29%)#44 | 1,005,654(0.02%)#821 |
| 45. | Yorketown | 174 | 60,875(0.29%)#45 | 1,005,654(0.02%)#822 |
| 46. | Oak Ridge | 168 | 60,875(0.28%)#46 | 1,005,654(0.02%)#861 |
| 47. | Red Bank Borough | 164 | 60,875(0.27%)#47 | 1,005,654(0.02%)#889 |
| 48. | Oradell Borough | 160 | 60,875(0.26%)#48 | 1,005,654(0.02%)#910 |
| 49. | North Caldwell Borough | 160 | 60,875(0.26%)#49 | 1,005,654(0.02%)#911 |
| 50. | Union City | 154 | 60,875(0.25%)#50 | 1,005,654(0.02%)#941 |
| 51. | Woodland Park Borough | 150 | 60,875(0.25%)#51 | 1,005,654(0.01%)#964 |
| 52. | Lyons | 150 | 60,875(0.25%)#52 | 1,005,654(0.01%)#967 |
| 53. | Manville Borough | 146 | 60,875(0.24%)#53 | 1,005,654(0.01%)#997 |
| 54. | Margate City | 145 | 60,875(0.24%)#54 | 1,005,654(0.01%)#1,002 |
| 55. | Newark | 142 | 60,875(0.23%)#55 | 1,005,654(0.01%)#1,018 |
| 56. | South Plainfield Borough | 140 | 60,875(0.23%)#56 | 1,005,654(0.01%)#1,046 |
| 57. | Pleasantdale | 139 | 60,875(0.23%)#57 | 1,005,654(0.01%)#1,056 |
| 58. | Linwood | 137 | 60,875(0.23%)#58 | 1,005,654(0.01%)#1,073 |
| 59. | Ocean Grove | 136 | 60,875(0.22%)#59 | 1,005,654(0.01%)#1,082 |
| 60. | Hillsborough | 135 | 60,875(0.22%)#60 | 1,005,654(0.01%)#1,089 |
| 61. | Watchung Borough | 135 | 60,875(0.22%)#61 | 1,005,654(0.01%)#1,093 |
| 62. | Franklin Center | 130 | 60,875(0.21%)#62 | 1,005,654(0.01%)#1,141 |
| 63. | Oak Valley | 129 | 60,875(0.21%)#63 | 1,005,654(0.01%)#1,148 |
| 64. | Princeton Junction | 129 | 60,875(0.21%)#64 | 1,005,654(0.01%)#1,149 |
| 65. | New Milford Borough | 127 | 60,875(0.21%)#65 | 1,005,654(0.01%)#1,162 |
| 66. | Ramsey Borough | 126 | 60,875(0.21%)#66 | 1,005,654(0.01%)#1,167 |
| 67. | Caldwell Borough | 124 | 60,875(0.20%)#67 | 1,005,654(0.01%)#1,191 |
| 68. | Shrewsbury Borough | 124 | 60,875(0.20%)#68 | 1,005,654(0.01%)#1,193 |
| 69. | Blackwells Mills | 122 | 60,875(0.20%)#69 | 1,005,654(0.01%)#1,208 |
| 70. | Collingswood Borough | 119 | 60,875(0.20%)#70 | 1,005,654(0.01%)#1,228 |
| 71. | East Freehold | 116 | 60,875(0.19%)#71 | 1,005,654(0.01%)#1,262 |
| 72. | Hillsdale Borough | 115 | 60,875(0.19%)#72 | 1,005,654(0.01%)#1,273 |
| 73. | Ellisburg | 115 | 60,875(0.19%)#73 | 1,005,654(0.01%)#1,276 |
| 74. | Madison Borough | 113 | 60,875(0.19%)#74 | 1,005,654(0.01%)#1,295 |
| 75. | Edgewater Borough | 110 | 60,875(0.18%)#75 | 1,005,654(0.01%)#1,322 |
| 76. | Villas | 108 | 60,875(0.18%)#76 | 1,005,654(0.01%)#1,348 |
| 77. | Ledgewood | 107 | 60,875(0.18%)#77 | 1,005,654(0.01%)#1,363 |
| 78. | Harrington Park Borough | 106 | 60,875(0.17%)#78 | 1,005,654(0.01%)#1,378 |
| 79. | Whippany | 104 | 60,875(0.17%)#79 | 1,005,654(0.01%)#1,389 |
| 80. | Upper Saddle River Borough | 103 | 60,875(0.17%)#80 | 1,005,654(0.01%)#1,400 |
| 81. | Bernardsville Borough | 103 | 60,875(0.17%)#81 | 1,005,654(0.01%)#1,401 |
| 82. | Chatham Borough | 102 | 60,875(0.17%)#82 | 1,005,654(0.01%)#1,413 |
| 83. | Haddonfield Borough | 100 | 60,875(0.16%)#83 | 1,005,654(0.01%)#1,441 |
| 84. | Morris Plains Borough | 99 | 60,875(0.16%)#84 | 1,005,654(0.01%)#1,456 |
| 85. | Atlantic Highlands Borough | 99 | 60,875(0.16%)#85 | 1,005,654(0.01%)#1,457 |
| 86. | Florham Park Borough | 93 | 60,875(0.15%)#86 | 1,005,654(0.01%)#1,534 |
| 87. | Haddon Heights Borough | 93 | 60,875(0.15%)#87 | 1,005,654(0.01%)#1,536 |
| 88. | Basking Ridge | 92 | 60,875(0.15%)#88 | 1,005,654(0.01%)#1,549 |
| 89. | Carteret Borough | 91 | 60,875(0.15%)#89 | 1,005,654(0.01%)#1,562 |
| 90. | Stanhope Borough | 90 | 60,875(0.15%)#90 | 1,005,654(0.01%)#1,582 |
| 91. | Hamilton Square | 89 | 60,875(0.15%)#91 | 1,005,654(0.01%)#1,591 |
| 92. | Westville Borough | 89 | 60,875(0.15%)#92 | 1,005,654(0.01%)#1,594 |
| 93. | Windsor | 89 | 60,875(0.15%)#93 | 1,005,654(0.01%)#1,597 |
| 94. | Westmont | 88 | 60,875(0.14%)#94 | 1,005,654(0.01%)#1,605 |
| 95. | Lincroft | 88 | 60,875(0.14%)#95 | 1,005,654(0.01%)#1,609 |
| 96. | New Providence Borough | 87 | 60,875(0.14%)#96 | 1,005,654(0.01%)#1,626 |
| 97. | Mullica Hill | 87 | 60,875(0.14%)#97 | 1,005,654(0.01%)#1,635 |
| 98. | Bordentown | 87 | 60,875(0.14%)#98 | 1,005,654(0.01%)#1,636 |
| 99. | Somerset | 82 | 60,875(0.13%)#99 | 1,005,654(0.01%)#1,693 |
| 100. | Morristown | 82 | 60,875(0.13%)#100 | 1,005,654(0.01%)#1,695 |
Common Questions
What are the Top 10 Cities with the Largest Eastern European Community in New Jersey?
Top 10 Cities with the Largest Eastern European Community in New Jersey are:
#1
1,275
#2
1,100
#3
839
#4
788
#5
785
#6
772
#7
687
#8
643
#9
636
#10
614
What city has the Largest Eastern European Community in New Jersey?
Englewood has the Largest Eastern European Community in New Jersey with 1,275.
What is the Total Eastern European Population in the State of New Jersey?
Total Eastern European Population in New Jersey is 60,875.
What is the Total Eastern European Population in the United States?
Total Eastern European Population in the United States is 1,005,654.