Cities with the Highest Poverty Level Among Single Females in New Jersey
RELATED REPORTS & OPTIONS
Highest Poverty | Single Female
New Jersey
Compare Cities
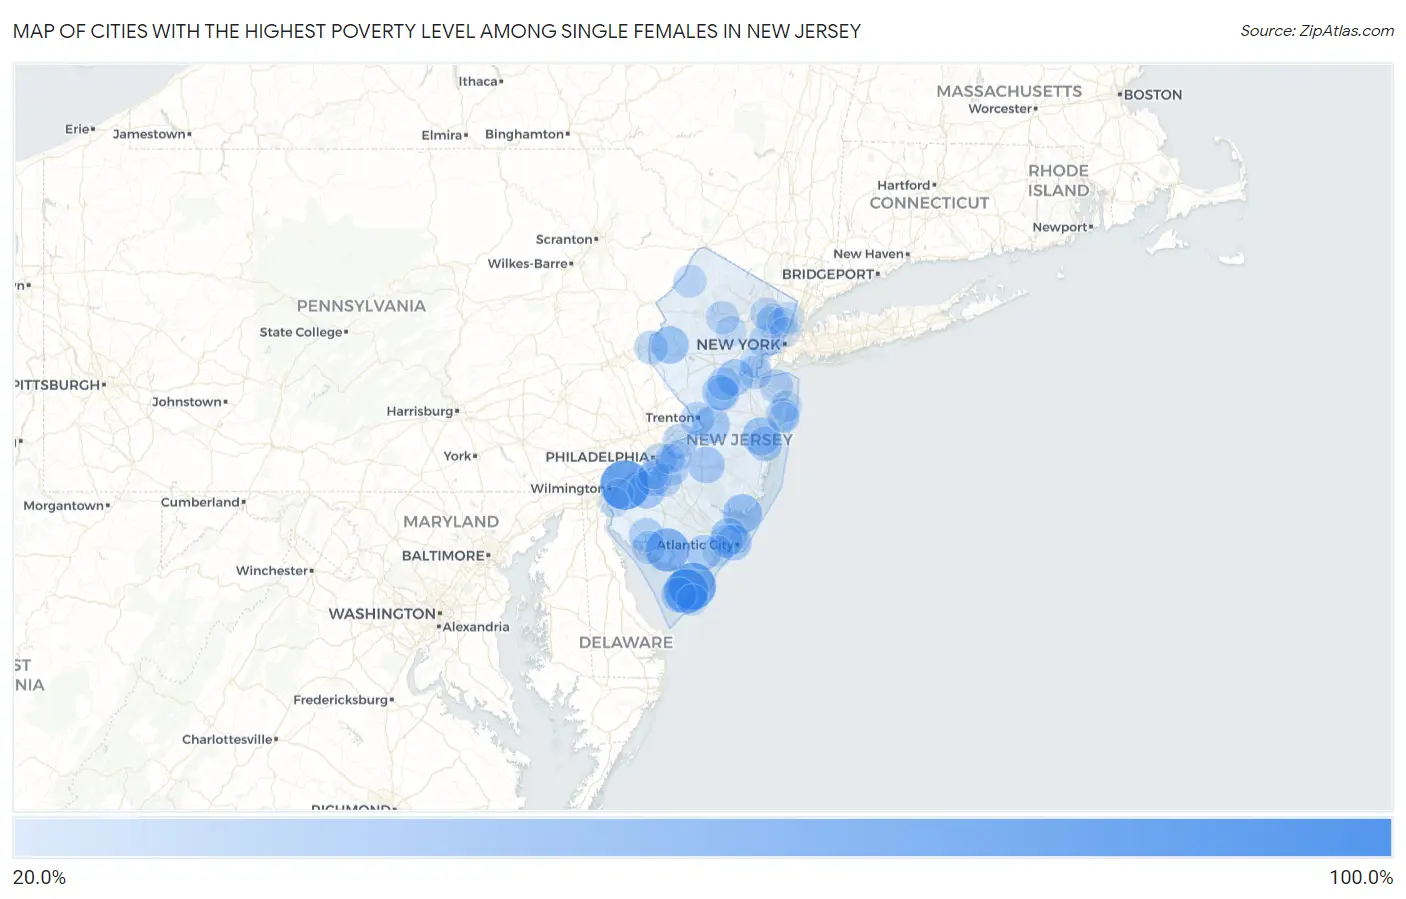
Map of Cities with the Highest Poverty Level Among Single Females in New Jersey
0.0%
100.0%
Cities with the Highest Poverty Level Among Single Females in New Jersey
| City | Single Female Poverty | vs State | vs National | |
| 1. | Forsgate | 100.0% | 19.6%(+80.4)#1 | 24.1%(+75.9)#20 |
| 2. | Port Morris | 100.0% | 19.6%(+80.4)#2 | 24.1%(+75.9)#111 |
| 3. | Delmont | 100.0% | 19.6%(+80.4)#3 | 24.1%(+75.9)#341 |
| 4. | Pluckemin | 90.7% | 19.6%(+71.1)#4 | 24.1%(+66.7)#1,025 |
| 5. | Pedricktown | 86.1% | 19.6%(+66.5)#5 | 24.1%(+62.0)#1,131 |
| 6. | Rutgers University-Busch Campus | 83.9% | 19.6%(+64.2)#6 | 24.1%(+59.8)#1,191 |
| 7. | Cape May Court House | 78.3% | 19.6%(+58.6)#7 | 24.1%(+54.2)#1,399 |
| 8. | Keasbey | 78.2% | 19.6%(+58.6)#8 | 24.1%(+54.2)#1,404 |
| 9. | Neptune City Borough | 73.7% | 19.6%(+54.1)#9 | 24.1%(+49.6)#1,635 |
| 10. | Whitesboro | 70.1% | 19.6%(+50.5)#10 | 24.1%(+46.1)#1,844 |
| 11. | Laurel Lake | 67.0% | 19.6%(+47.4)#11 | 24.1%(+42.9)#2,073 |
| 12. | Silver Lake Cdp Essex County | 63.8% | 19.6%(+44.2)#12 | 24.1%(+39.7)#2,414 |
| 13. | New Gretna | 60.0% | 19.6%(+40.4)#13 | 24.1%(+35.9)#2,847 |
| 14. | Penns Grove Borough | 59.3% | 19.6%(+39.7)#14 | 24.1%(+35.3)#2,927 |
| 15. | Mystic Island | 53.9% | 19.6%(+34.3)#15 | 24.1%(+29.8)#3,630 |
| 16. | High Bridge Borough | 53.7% | 19.6%(+34.0)#16 | 24.1%(+29.6)#3,669 |
| 17. | Lakewood | 50.7% | 19.6%(+31.1)#17 | 24.1%(+26.7)#4,065 |
| 18. | Asbury | 50.0% | 19.6%(+30.4)#18 | 24.1%(+25.9)#4,354 |
| 19. | Mullica Hill | 48.6% | 19.6%(+29.0)#19 | 24.1%(+24.6)#4,598 |
| 20. | Groveville | 48.4% | 19.6%(+28.8)#20 | 24.1%(+24.3)#4,632 |
| 21. | Leisuretowne | 46.8% | 19.6%(+27.1)#21 | 24.1%(+22.7)#4,943 |
| 22. | Absecon | 46.8% | 19.6%(+27.1)#22 | 24.1%(+22.7)#4,947 |
| 23. | East Newark Borough | 46.7% | 19.6%(+27.1)#23 | 24.1%(+22.6)#4,953 |
| 24. | New Brunswick | 46.2% | 19.6%(+26.6)#24 | 24.1%(+22.1)#5,029 |
| 25. | Atlantic City | 44.7% | 19.6%(+25.1)#25 | 24.1%(+20.6)#5,306 |
| 26. | Heathcote | 44.0% | 19.6%(+24.4)#26 | 24.1%(+20.0)#5,454 |
| 27. | Closter Borough | 43.2% | 19.6%(+23.5)#27 | 24.1%(+19.1)#5,631 |
| 28. | Corbin City | 43.1% | 19.6%(+23.5)#28 | 24.1%(+19.0)#5,643 |
| 29. | Villas | 42.7% | 19.6%(+23.1)#29 | 24.1%(+18.6)#5,764 |
| 30. | Leisure Village | 41.8% | 19.6%(+22.1)#30 | 24.1%(+17.7)#5,973 |
| 31. | Oak Valley | 41.7% | 19.6%(+22.1)#31 | 24.1%(+17.6)#5,979 |
| 32. | Beverly | 41.5% | 19.6%(+21.9)#32 | 24.1%(+17.5)#6,047 |
| 33. | Interlaken Borough | 41.2% | 19.6%(+21.5)#33 | 24.1%(+17.1)#6,127 |
| 34. | Westville Borough | 40.8% | 19.6%(+21.2)#34 | 24.1%(+16.7)#6,206 |
| 35. | Prospect Park Borough | 40.5% | 19.6%(+20.9)#35 | 24.1%(+16.5)#6,263 |
| 36. | Beach Haven Borough | 40.0% | 19.6%(+20.4)#36 | 24.1%(+15.9)#6,385 |
| 37. | Stone Harbor Borough | 40.0% | 19.6%(+20.4)#37 | 24.1%(+15.9)#6,395 |
| 38. | Bridgeton | 39.9% | 19.6%(+20.3)#38 | 24.1%(+15.8)#6,521 |
| 39. | Monmouth Junction | 39.5% | 19.6%(+19.8)#39 | 24.1%(+15.4)#6,604 |
| 40. | Ashland | 39.4% | 19.6%(+19.8)#40 | 24.1%(+15.4)#6,608 |
| 41. | Trenton | 38.8% | 19.6%(+19.2)#41 | 24.1%(+14.8)#6,736 |
| 42. | South River Borough | 38.7% | 19.6%(+19.1)#42 | 24.1%(+14.7)#6,760 |
| 43. | Phillipsburg | 38.6% | 19.6%(+18.9)#43 | 24.1%(+14.5)#6,793 |
| 44. | Belford | 37.9% | 19.6%(+18.3)#44 | 24.1%(+13.9)#6,990 |
| 45. | Laurel Heights | 37.9% | 19.6%(+18.3)#45 | 24.1%(+13.9)#6,996 |
| 46. | Victory Gardens Borough | 37.9% | 19.6%(+18.3)#46 | 24.1%(+13.8)#7,005 |
| 47. | Wanamassa | 37.6% | 19.6%(+18.0)#47 | 24.1%(+13.5)#7,052 |
| 48. | Oradell Borough | 37.4% | 19.6%(+17.8)#48 | 24.1%(+13.3)#7,163 |
| 49. | Robbinsville Center | 37.3% | 19.6%(+17.7)#49 | 24.1%(+13.3)#7,180 |
| 50. | Perth Amboy | 37.2% | 19.6%(+17.5)#50 | 24.1%(+13.1)#7,210 |
| 51. | Cedarville | 37.1% | 19.6%(+17.5)#51 | 24.1%(+13.1)#7,224 |
| 52. | Pleasantville | 36.8% | 19.6%(+17.2)#52 | 24.1%(+12.7)#7,319 |
| 53. | Camden | 36.6% | 19.6%(+17.0)#53 | 24.1%(+12.5)#7,364 |
| 54. | Dover | 36.3% | 19.6%(+16.7)#54 | 24.1%(+12.3)#7,461 |
| 55. | Newark | 35.8% | 19.6%(+16.1)#55 | 24.1%(+11.7)#7,577 |
| 56. | Crandon Lakes | 35.6% | 19.6%(+16.0)#56 | 24.1%(+11.5)#7,644 |
| 57. | Blackwood | 35.5% | 19.6%(+15.9)#57 | 24.1%(+11.5)#7,655 |
| 58. | Crosswicks | 35.5% | 19.6%(+15.9)#58 | 24.1%(+11.4)#7,663 |
| 59. | Franklin Park | 35.4% | 19.6%(+15.8)#59 | 24.1%(+11.3)#7,690 |
| 60. | Merchantville Borough | 35.3% | 19.6%(+15.7)#60 | 24.1%(+11.2)#7,718 |
| 61. | Lake Como Borough | 35.0% | 19.6%(+15.4)#61 | 24.1%(+10.9)#7,815 |
| 62. | Pemberton Borough | 34.8% | 19.6%(+15.2)#62 | 24.1%(+10.8)#7,863 |
| 63. | Manville Borough | 34.6% | 19.6%(+15.0)#63 | 24.1%(+10.5)#7,935 |
| 64. | Paterson | 34.5% | 19.6%(+14.9)#64 | 24.1%(+10.5)#7,965 |
| 65. | Mount Ephraim Borough | 34.4% | 19.6%(+14.8)#65 | 24.1%(+10.3)#7,991 |
| 66. | Mckee | 34.2% | 19.6%(+14.6)#66 | 24.1%(+10.1)#8,053 |
| 67. | Bradley Beach Borough | 34.0% | 19.6%(+14.4)#67 | 24.1%(+9.92)#8,117 |
| 68. | Glassboro Borough | 33.7% | 19.6%(+14.1)#68 | 24.1%(+9.64)#8,180 |
| 69. | Woodbine Borough | 33.5% | 19.6%(+13.9)#69 | 24.1%(+9.45)#8,218 |
| 70. | Passaic | 32.8% | 19.6%(+13.2)#70 | 24.1%(+8.77)#8,626 |
| 71. | Moorestown Lenola | 32.1% | 19.6%(+12.5)#71 | 24.1%(+8.07)#8,819 |
| 72. | Collingswood Borough | 32.1% | 19.6%(+12.5)#72 | 24.1%(+8.06)#8,837 |
| 73. | Long Branch | 32.1% | 19.6%(+12.5)#73 | 24.1%(+8.05)#8,840 |
| 74. | Lakehurst Borough | 31.7% | 19.6%(+12.1)#74 | 24.1%(+7.61)#8,976 |
| 75. | Wildwood | 31.5% | 19.6%(+11.9)#75 | 24.1%(+7.46)#9,030 |
| 76. | Somers Point | 31.5% | 19.6%(+11.9)#76 | 24.1%(+7.44)#9,033 |
| 77. | Englewood | 31.3% | 19.6%(+11.7)#77 | 24.1%(+7.25)#9,082 |
| 78. | Asbury Park | 30.6% | 19.6%(+11.0)#78 | 24.1%(+6.57)#9,316 |
| 79. | Avenel | 30.3% | 19.6%(+10.6)#79 | 24.1%(+6.20)#9,438 |
| 80. | Somerdale Borough | 30.2% | 19.6%(+10.6)#80 | 24.1%(+6.17)#9,444 |
| 81. | Morristown | 30.0% | 19.6%(+10.4)#81 | 24.1%(+5.94)#9,508 |
| 82. | Pompton Lakes Borough | 29.8% | 19.6%(+10.2)#82 | 24.1%(+5.76)#9,608 |
| 83. | Shiloh Borough | 29.6% | 19.6%(+10.0)#83 | 24.1%(+5.55)#9,678 |
| 84. | Woodbury | 29.5% | 19.6%(+9.85)#84 | 24.1%(+5.40)#9,720 |
| 85. | Pennsville | 29.4% | 19.6%(+9.82)#85 | 24.1%(+5.37)#9,733 |
| 86. | Longport Borough | 29.4% | 19.6%(+9.78)#86 | 24.1%(+5.34)#9,751 |
| 87. | Garfield | 29.4% | 19.6%(+9.74)#87 | 24.1%(+5.29)#9,769 |
| 88. | Ridgefield Park | 28.8% | 19.6%(+9.19)#88 | 24.1%(+4.74)#9,929 |
| 89. | Wallington Borough | 28.7% | 19.6%(+9.11)#89 | 24.1%(+4.67)#9,949 |
| 90. | Far Hills Borough | 28.6% | 19.6%(+8.94)#90 | 24.1%(+4.49)#10,008 |
| 91. | Stockton Borough | 28.6% | 19.6%(+8.94)#91 | 24.1%(+4.49)#10,043 |
| 92. | West New York | 28.2% | 19.6%(+8.53)#92 | 24.1%(+4.09)#10,197 |
| 93. | Lodi Borough | 28.1% | 19.6%(+8.51)#93 | 24.1%(+4.07)#10,200 |
| 94. | Dunellen Borough | 28.1% | 19.6%(+8.45)#94 | 24.1%(+4.00)#10,228 |
| 95. | Cherry Hill Mall | 27.8% | 19.6%(+8.22)#95 | 24.1%(+3.77)#10,307 |
| 96. | Edgewater Borough | 27.6% | 19.6%(+8.02)#96 | 24.1%(+3.57)#10,378 |
| 97. | Cookstown | 27.3% | 19.6%(+7.64)#97 | 24.1%(+3.20)#10,508 |
| 98. | Carneys Point | 27.1% | 19.6%(+7.51)#98 | 24.1%(+3.07)#10,559 |
| 99. | Fairview Borough | 27.0% | 19.6%(+7.38)#99 | 24.1%(+2.93)#10,611 |
| 100. | Landing | 26.9% | 19.6%(+7.26)#100 | 24.1%(+2.81)#10,657 |
Common Questions
What are the Top 10 Cities with the Highest Poverty Level Among Single Females in New Jersey?
Top 10 Cities with the Highest Poverty Level Among Single Females in New Jersey are:
#1
86.1%
#2
78.3%
#3
70.1%
#4
67.0%
#5
53.9%
#6
50.7%
#7
50.0%
#8
48.6%
#9
48.4%
#10
46.8%
What city has the Highest Poverty Level Among Single Females in New Jersey?
Pedricktown has the Highest Poverty Level Among Single Females in New Jersey with 86.1%.
What is the Poverty Level Among Single Females in the State of New Jersey?
Poverty Level Among Single Females in New Jersey is 19.6%.
What is the Poverty Level Among Single Females in the United States?
Poverty Level Among Single Females in the United States is 24.1%.