Cities with the Most Immigrants from Peru in New Jersey
RELATED REPORTS & OPTIONS
Peru
New Jersey
Compare Cities
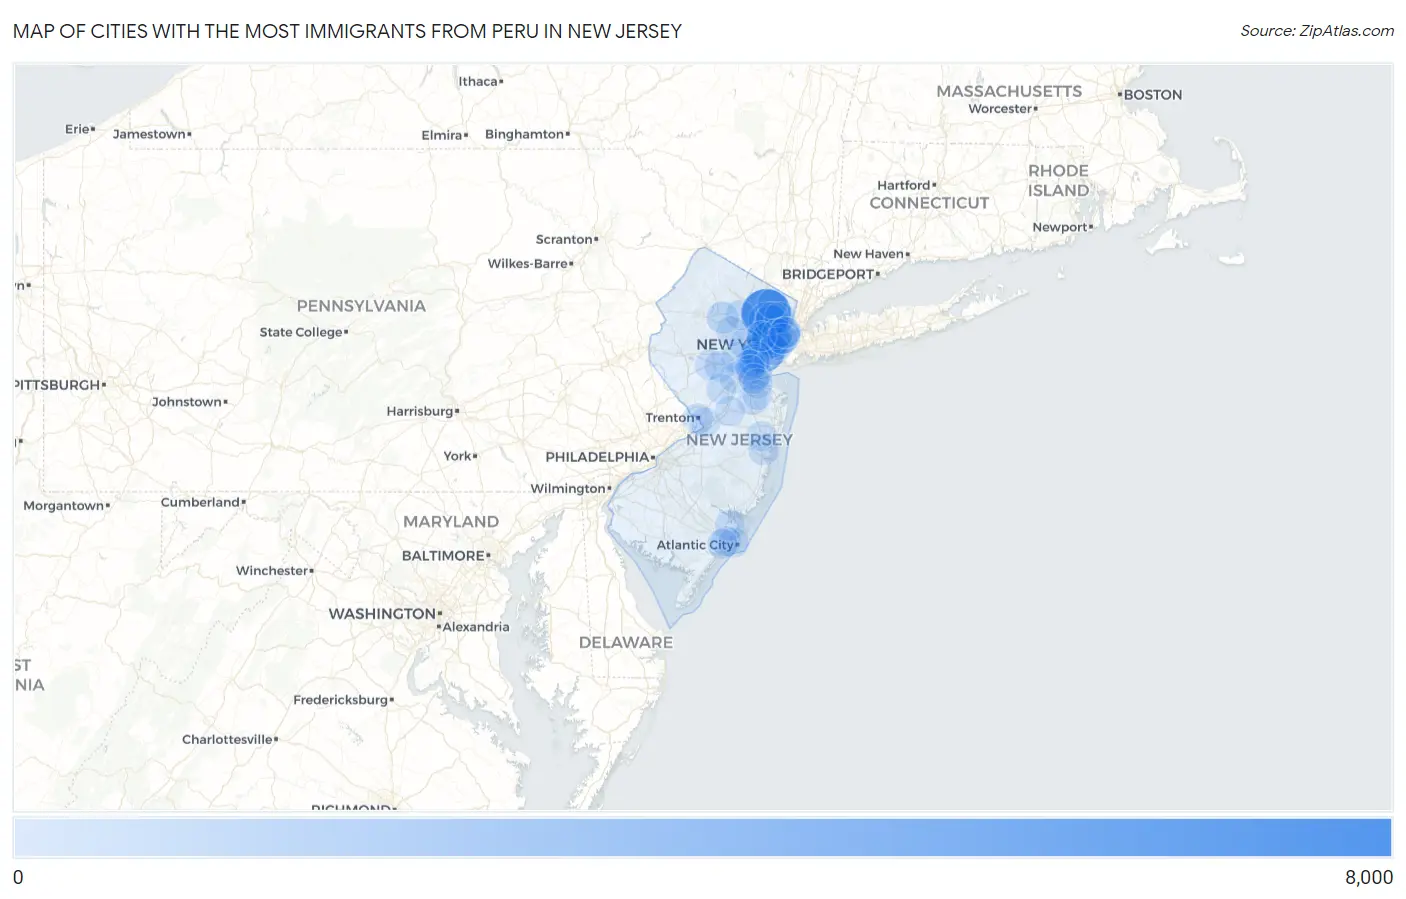
Map of Cities with the Most Immigrants from Peru in New Jersey
0
8,000
Cities with the Most Immigrants from Peru in New Jersey
| City | Peru | vs State | vs National | |
| 1. | Paterson | 6,756 | 58,563(11.54%)#1 | 461,322(1.46%)#3 |
| 2. | Elizabeth | 4,015 | 58,563(6.86%)#2 | 461,322(0.87%)#4 |
| 3. | Kearny | 2,906 | 58,563(4.96%)#3 | 461,322(0.63%)#7 |
| 4. | Clifton | 2,832 | 58,563(4.84%)#4 | 461,322(0.61%)#8 |
| 5. | Newark | 2,560 | 58,563(4.37%)#5 | 461,322(0.55%)#11 |
| 6. | Union City | 1,765 | 58,563(3.01%)#6 | 461,322(0.38%)#19 |
| 7. | Passaic | 1,551 | 58,563(2.65%)#7 | 461,322(0.34%)#27 |
| 8. | Perth Amboy | 1,306 | 58,563(2.23%)#8 | 461,322(0.28%)#40 |
| 9. | Harrison | 1,193 | 58,563(2.04%)#9 | 461,322(0.26%)#44 |
| 10. | Garfield | 1,119 | 58,563(1.91%)#10 | 461,322(0.24%)#51 |
| 11. | Jersey City | 779 | 58,563(1.33%)#11 | 461,322(0.17%)#80 |
| 12. | Roselle Park Borough | 622 | 58,563(1.06%)#12 | 461,322(0.13%)#113 |
| 13. | Dover | 618 | 58,563(1.06%)#13 | 461,322(0.13%)#114 |
| 14. | West New York | 614 | 58,563(1.05%)#14 | 461,322(0.13%)#116 |
| 15. | Lodi Borough | 573 | 58,563(0.98%)#15 | 461,322(0.12%)#126 |
| 16. | Linden | 534 | 58,563(0.91%)#16 | 461,322(0.12%)#139 |
| 17. | Rahway | 530 | 58,563(0.91%)#17 | 461,322(0.11%)#141 |
| 18. | Prospect Park Borough | 425 | 58,563(0.73%)#18 | 461,322(0.09%)#188 |
| 19. | Plainfield | 422 | 58,563(0.72%)#19 | 461,322(0.09%)#192 |
| 20. | North Plainfield Borough | 406 | 58,563(0.69%)#20 | 461,322(0.09%)#200 |
| 21. | Highland Park Borough | 400 | 58,563(0.68%)#21 | 461,322(0.09%)#206 |
| 22. | Elmwood Park Borough | 381 | 58,563(0.65%)#22 | 461,322(0.08%)#216 |
| 23. | Hawthorne Borough | 379 | 58,563(0.65%)#23 | 461,322(0.08%)#219 |
| 24. | Dunellen Borough | 369 | 58,563(0.63%)#24 | 461,322(0.08%)#227 |
| 25. | Haledon Borough | 346 | 58,563(0.59%)#25 | 461,322(0.08%)#240 |
| 26. | Carteret Borough | 312 | 58,563(0.53%)#26 | 461,322(0.07%)#267 |
| 27. | Finderne | 281 | 58,563(0.48%)#27 | 461,322(0.06%)#301 |
| 28. | Avenel | 270 | 58,563(0.46%)#28 | 461,322(0.06%)#317 |
| 29. | Bound Brook Borough | 270 | 58,563(0.46%)#29 | 461,322(0.06%)#318 |
| 30. | New Brunswick | 267 | 58,563(0.46%)#30 | 461,322(0.06%)#320 |
| 31. | Wallington Borough | 267 | 58,563(0.46%)#31 | 461,322(0.06%)#321 |
| 32. | Freehold Borough | 260 | 58,563(0.44%)#32 | 461,322(0.06%)#326 |
| 33. | Trenton | 259 | 58,563(0.44%)#33 | 461,322(0.06%)#329 |
| 34. | Woodland Park Borough | 259 | 58,563(0.44%)#34 | 461,322(0.06%)#331 |
| 35. | Hackensack | 253 | 58,563(0.43%)#35 | 461,322(0.05%)#334 |
| 36. | Watsessing | 253 | 58,563(0.43%)#36 | 461,322(0.05%)#335 |
| 37. | Bayonne | 249 | 58,563(0.43%)#37 | 461,322(0.05%)#339 |
| 38. | Somerville Borough | 237 | 58,563(0.40%)#38 | 461,322(0.05%)#355 |
| 39. | Hopelawn | 231 | 58,563(0.39%)#39 | 461,322(0.05%)#364 |
| 40. | Summit | 228 | 58,563(0.39%)#40 | 461,322(0.05%)#367 |
| 41. | Iselin | 221 | 58,563(0.38%)#41 | 461,322(0.05%)#378 |
| 42. | Fairview Borough | 220 | 58,563(0.38%)#42 | 461,322(0.05%)#380 |
| 43. | North Arlington Borough | 207 | 58,563(0.35%)#43 | 461,322(0.04%)#403 |
| 44. | Washington Borough | 206 | 58,563(0.35%)#44 | 461,322(0.04%)#406 |
| 45. | Roselle Borough | 204 | 58,563(0.35%)#45 | 461,322(0.04%)#411 |
| 46. | Toms River | 203 | 58,563(0.35%)#46 | 461,322(0.04%)#413 |
| 47. | Smithville | 179 | 58,563(0.31%)#47 | 461,322(0.04%)#474 |
| 48. | Lindenwold Borough | 176 | 58,563(0.30%)#48 | 461,322(0.04%)#481 |
| 49. | Paramus Borough | 171 | 58,563(0.29%)#49 | 461,322(0.04%)#497 |
| 50. | East Newark Borough | 167 | 58,563(0.29%)#50 | 461,322(0.04%)#511 |
| 51. | Secaucus | 164 | 58,563(0.28%)#51 | 461,322(0.04%)#519 |
| 52. | Fair Lawn Borough | 163 | 58,563(0.28%)#52 | 461,322(0.04%)#521 |
| 53. | Guttenberg | 160 | 58,563(0.27%)#53 | 461,322(0.03%)#530 |
| 54. | Park Ridge Borough | 153 | 58,563(0.26%)#54 | 461,322(0.03%)#549 |
| 55. | Sayreville Borough | 145 | 58,563(0.25%)#55 | 461,322(0.03%)#575 |
| 56. | Robertsville | 144 | 58,563(0.25%)#56 | 461,322(0.03%)#583 |
| 57. | Dumont Borough | 140 | 58,563(0.24%)#57 | 461,322(0.03%)#592 |
| 58. | Leonia Borough | 140 | 58,563(0.24%)#58 | 461,322(0.03%)#593 |
| 59. | Wharton Borough | 137 | 58,563(0.23%)#59 | 461,322(0.03%)#601 |
| 60. | Kendall Park | 132 | 58,563(0.23%)#60 | 461,322(0.03%)#620 |
| 61. | Atlantic City | 131 | 58,563(0.22%)#61 | 461,322(0.03%)#622 |
| 62. | Garwood Borough | 131 | 58,563(0.22%)#62 | 461,322(0.03%)#624 |
| 63. | Cliffside Park Borough | 128 | 58,563(0.22%)#63 | 461,322(0.03%)#633 |
| 64. | South Plainfield Borough | 126 | 58,563(0.22%)#64 | 461,322(0.03%)#639 |
| 65. | Fords | 122 | 58,563(0.21%)#65 | 461,322(0.03%)#654 |
| 66. | Bergenfield Borough | 120 | 58,563(0.20%)#66 | 461,322(0.03%)#662 |
| 67. | Bradley Gardens | 119 | 58,563(0.20%)#67 | 461,322(0.03%)#665 |
| 68. | Little Ferry Borough | 117 | 58,563(0.20%)#68 | 461,322(0.03%)#673 |
| 69. | Wanaque Borough | 115 | 58,563(0.20%)#69 | 461,322(0.02%)#682 |
| 70. | Lincoln Park Borough | 114 | 58,563(0.19%)#70 | 461,322(0.02%)#689 |
| 71. | Rutherford Borough | 113 | 58,563(0.19%)#71 | 461,322(0.02%)#694 |
| 72. | Morganville | 113 | 58,563(0.19%)#72 | 461,322(0.02%)#695 |
| 73. | Menlo Park Terrace | 110 | 58,563(0.19%)#73 | 461,322(0.02%)#709 |
| 74. | East Rutherford Borough | 107 | 58,563(0.18%)#74 | 461,322(0.02%)#723 |
| 75. | Pleasantville | 105 | 58,563(0.18%)#75 | 461,322(0.02%)#733 |
| 76. | Totowa Borough | 101 | 58,563(0.17%)#76 | 461,322(0.02%)#759 |
| 77. | Lakewood | 100 | 58,563(0.17%)#77 | 461,322(0.02%)#765 |
| 78. | Mountainside Borough | 100 | 58,563(0.17%)#78 | 461,322(0.02%)#768 |
| 79. | Hoboken | 99 | 58,563(0.17%)#79 | 461,322(0.02%)#771 |
| 80. | White Horse | 99 | 58,563(0.17%)#80 | 461,322(0.02%)#774 |
| 81. | Bloomingdale Borough | 99 | 58,563(0.17%)#81 | 461,322(0.02%)#775 |
| 82. | Twin Rivers | 97 | 58,563(0.17%)#82 | 461,322(0.02%)#791 |
| 83. | Boonton | 95 | 58,563(0.16%)#83 | 461,322(0.02%)#807 |
| 84. | South Amboy | 94 | 58,563(0.16%)#84 | 461,322(0.02%)#813 |
| 85. | Hopatcong Borough | 92 | 58,563(0.16%)#85 | 461,322(0.02%)#819 |
| 86. | East Orange | 91 | 58,563(0.16%)#86 | 461,322(0.02%)#822 |
| 87. | Middlesex Borough | 89 | 58,563(0.15%)#87 | 461,322(0.02%)#840 |
| 88. | Laurence Harbor | 88 | 58,563(0.15%)#88 | 461,322(0.02%)#848 |
| 89. | Ridgewood | 85 | 58,563(0.15%)#89 | 461,322(0.02%)#862 |
| 90. | Northfield | 85 | 58,563(0.15%)#90 | 461,322(0.02%)#866 |
| 91. | Tinton Falls Borough | 83 | 58,563(0.14%)#91 | 461,322(0.02%)#882 |
| 92. | Lake Hiawatha | 81 | 58,563(0.14%)#92 | 461,322(0.02%)#895 |
| 93. | Matawan Borough | 78 | 58,563(0.13%)#93 | 461,322(0.02%)#921 |
| 94. | Vauxhall | 77 | 58,563(0.13%)#94 | 461,322(0.02%)#930 |
| 95. | Ampere North | 74 | 58,563(0.13%)#95 | 461,322(0.02%)#954 |
| 96. | Silver Lake Cdp Essex County | 74 | 58,563(0.13%)#96 | 461,322(0.02%)#955 |
| 97. | Westwood Borough | 72 | 58,563(0.12%)#97 | 461,322(0.02%)#980 |
| 98. | Morristown | 70 | 58,563(0.12%)#98 | 461,322(0.02%)#996 |
| 99. | New Milford Borough | 70 | 58,563(0.12%)#99 | 461,322(0.02%)#997 |
| 100. | Parsippany | 68 | 58,563(0.12%)#100 | 461,322(0.01%)#1,017 |
Common Questions
What are the Top 10 Cities with the Most Immigrants from Peru in New Jersey?
Top 10 Cities with the Most Immigrants from Peru in New Jersey are:
#1
6,756
#2
4,015
#3
2,906
#4
2,832
#5
2,560
#6
1,765
#7
1,551
#8
1,306
#9
1,193
#10
1,119
What city has the Most Immigrants from Peru in New Jersey?
Paterson has the Most Immigrants from Peru in New Jersey with 6,756.
What is the Total Immigrants from Peru in the State of New Jersey?
Total Immigrants from Peru in New Jersey is 58,563.
What is the Total Immigrants from Peru in the United States?
Total Immigrants from Peru in the United States is 461,322.