Cities with the Largest Greek Community in New Jersey
RELATED REPORTS & OPTIONS
Greek
New Jersey
Compare Cities
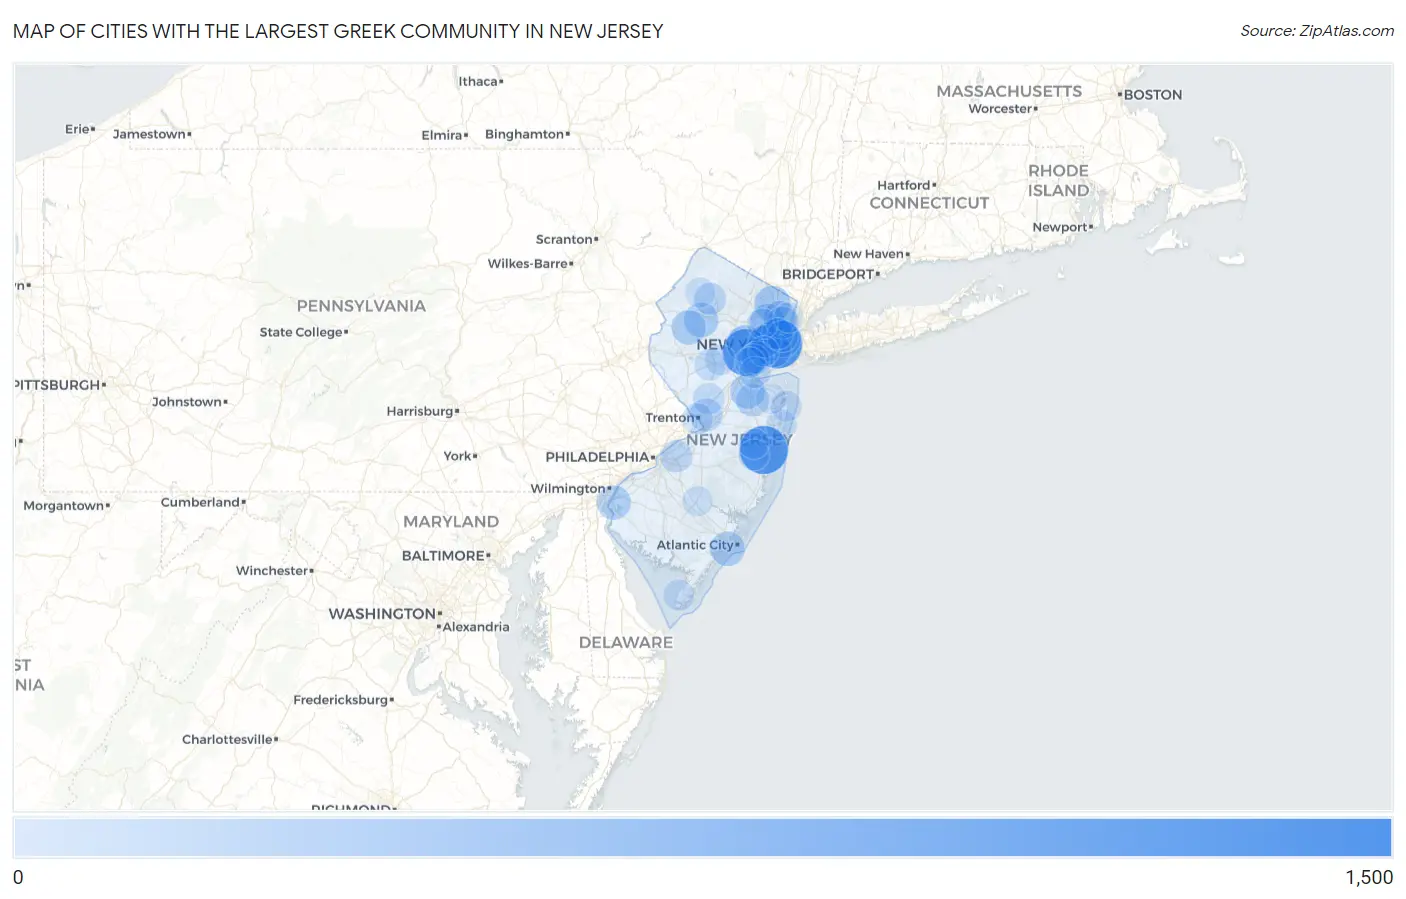
Map of Cities with the Largest Greek Community in New Jersey
0
1,500
Cities with the Largest Greek Community in New Jersey
| City | Greek | vs State | vs National | |
| 1. | Jersey City | 1,076 | 59,285(1.81%)#1 | 1,230,319(0.09%)#87 |
| 2. | Toms River | 1,004 | 59,285(1.69%)#2 | 1,230,319(0.08%)#96 |
| 3. | Westfield | 946 | 59,285(1.60%)#3 | 1,230,319(0.08%)#105 |
| 4. | Fort Lee Borough | 693 | 59,285(1.17%)#4 | 1,230,319(0.06%)#184 |
| 5. | South River Borough | 561 | 59,285(0.95%)#5 | 1,230,319(0.05%)#264 |
| 6. | Glen Ridge Borough | 467 | 59,285(0.79%)#6 | 1,230,319(0.04%)#341 |
| 7. | Hoboken | 439 | 59,285(0.74%)#7 | 1,230,319(0.04%)#370 |
| 8. | Summit | 433 | 59,285(0.73%)#8 | 1,230,319(0.04%)#380 |
| 9. | Fair Lawn Borough | 424 | 59,285(0.72%)#9 | 1,230,319(0.03%)#396 |
| 10. | Ridgewood | 399 | 59,285(0.67%)#10 | 1,230,319(0.03%)#446 |
| 11. | Tinton Falls Borough | 395 | 59,285(0.67%)#11 | 1,230,319(0.03%)#450 |
| 12. | New Milford Borough | 364 | 59,285(0.61%)#12 | 1,230,319(0.03%)#496 |
| 13. | Clifton | 354 | 59,285(0.60%)#13 | 1,230,319(0.03%)#515 |
| 14. | Flanders | 348 | 59,285(0.59%)#14 | 1,230,319(0.03%)#530 |
| 15. | Saddle River Borough | 342 | 59,285(0.58%)#15 | 1,230,319(0.03%)#541 |
| 16. | Margate City | 332 | 59,285(0.56%)#16 | 1,230,319(0.03%)#561 |
| 17. | Old Bridge | 331 | 59,285(0.56%)#17 | 1,230,319(0.03%)#564 |
| 18. | Budd Lake | 330 | 59,285(0.56%)#18 | 1,230,319(0.03%)#569 |
| 19. | Emerson Borough | 328 | 59,285(0.55%)#19 | 1,230,319(0.03%)#578 |
| 20. | Bayonne | 323 | 59,285(0.54%)#20 | 1,230,319(0.03%)#591 |
| 21. | Sayreville Borough | 323 | 59,285(0.54%)#21 | 1,230,319(0.03%)#593 |
| 22. | Beattystown | 323 | 59,285(0.54%)#22 | 1,230,319(0.03%)#594 |
| 23. | Pennsville | 316 | 59,285(0.53%)#23 | 1,230,319(0.03%)#607 |
| 24. | Ramsey Borough | 303 | 59,285(0.51%)#24 | 1,230,319(0.02%)#637 |
| 25. | Franklin Lakes Borough | 293 | 59,285(0.49%)#25 | 1,230,319(0.02%)#662 |
| 26. | Cliffside Park Borough | 292 | 59,285(0.49%)#26 | 1,230,319(0.02%)#670 |
| 27. | Maywood Borough | 290 | 59,285(0.49%)#27 | 1,230,319(0.02%)#675 |
| 28. | Hackensack | 278 | 59,285(0.47%)#28 | 1,230,319(0.02%)#721 |
| 29. | Oceanport Borough | 266 | 59,285(0.45%)#29 | 1,230,319(0.02%)#761 |
| 30. | Mercerville | 256 | 59,285(0.43%)#30 | 1,230,319(0.02%)#803 |
| 31. | Whippany | 255 | 59,285(0.43%)#31 | 1,230,319(0.02%)#807 |
| 32. | Robertsville | 253 | 59,285(0.43%)#32 | 1,230,319(0.02%)#814 |
| 33. | New Providence Borough | 251 | 59,285(0.42%)#33 | 1,230,319(0.02%)#819 |
| 34. | Allendale Borough | 250 | 59,285(0.42%)#34 | 1,230,319(0.02%)#823 |
| 35. | Englewood Cliffs Borough | 238 | 59,285(0.40%)#35 | 1,230,319(0.02%)#869 |
| 36. | Ridgefield Borough | 229 | 59,285(0.39%)#36 | 1,230,319(0.02%)#905 |
| 37. | Totowa Borough | 224 | 59,285(0.38%)#37 | 1,230,319(0.02%)#929 |
| 38. | Spotswood Borough | 222 | 59,285(0.37%)#38 | 1,230,319(0.02%)#939 |
| 39. | Newark | 220 | 59,285(0.37%)#39 | 1,230,319(0.02%)#942 |
| 40. | Linden | 219 | 59,285(0.37%)#40 | 1,230,319(0.02%)#952 |
| 41. | Moorestown Lenola | 219 | 59,285(0.37%)#41 | 1,230,319(0.02%)#955 |
| 42. | Preakness | 218 | 59,285(0.37%)#42 | 1,230,319(0.02%)#960 |
| 43. | Milltown Borough | 218 | 59,285(0.37%)#43 | 1,230,319(0.02%)#962 |
| 44. | Oakland Borough | 214 | 59,285(0.36%)#44 | 1,230,319(0.02%)#983 |
| 45. | Ridgefield Park | 213 | 59,285(0.36%)#45 | 1,230,319(0.02%)#987 |
| 46. | Lake Mohawk | 213 | 59,285(0.36%)#46 | 1,230,319(0.02%)#988 |
| 47. | Little Silver Borough | 211 | 59,285(0.36%)#47 | 1,230,319(0.02%)#997 |
| 48. | Paramus Borough | 205 | 59,285(0.35%)#48 | 1,230,319(0.02%)#1,030 |
| 49. | Palisades Park Borough | 201 | 59,285(0.34%)#49 | 1,230,319(0.02%)#1,054 |
| 50. | Hopatcong Borough | 194 | 59,285(0.33%)#50 | 1,230,319(0.02%)#1,107 |
| 51. | Middlesex Borough | 193 | 59,285(0.33%)#51 | 1,230,319(0.02%)#1,116 |
| 52. | Princeton | 187 | 59,285(0.32%)#52 | 1,230,319(0.02%)#1,138 |
| 53. | Bernardsville Borough | 185 | 59,285(0.31%)#53 | 1,230,319(0.02%)#1,151 |
| 54. | Rahway | 184 | 59,285(0.31%)#54 | 1,230,319(0.01%)#1,154 |
| 55. | Roselle Park Borough | 180 | 59,285(0.30%)#55 | 1,230,319(0.01%)#1,171 |
| 56. | Union City | 179 | 59,285(0.30%)#56 | 1,230,319(0.01%)#1,175 |
| 57. | Secaucus | 179 | 59,285(0.30%)#57 | 1,230,319(0.01%)#1,176 |
| 58. | Point Pleasant Borough | 178 | 59,285(0.30%)#58 | 1,230,319(0.01%)#1,185 |
| 59. | Perth Amboy | 176 | 59,285(0.30%)#59 | 1,230,319(0.01%)#1,197 |
| 60. | Madison Borough | 176 | 59,285(0.30%)#60 | 1,230,319(0.01%)#1,202 |
| 61. | Bradley Gardens | 169 | 59,285(0.29%)#61 | 1,230,319(0.01%)#1,255 |
| 62. | Trenton | 168 | 59,285(0.28%)#62 | 1,230,319(0.01%)#1,259 |
| 63. | Parsippany | 168 | 59,285(0.28%)#63 | 1,230,319(0.01%)#1,265 |
| 64. | Park Ridge Borough | 167 | 59,285(0.28%)#64 | 1,230,319(0.01%)#1,273 |
| 65. | South Plainfield Borough | 160 | 59,285(0.27%)#65 | 1,230,319(0.01%)#1,334 |
| 66. | West Belmar | 159 | 59,285(0.27%)#66 | 1,230,319(0.01%)#1,342 |
| 67. | Glassboro Borough | 157 | 59,285(0.26%)#67 | 1,230,319(0.01%)#1,349 |
| 68. | Eatontown Borough | 155 | 59,285(0.26%)#68 | 1,230,319(0.01%)#1,365 |
| 69. | Villas | 154 | 59,285(0.26%)#69 | 1,230,319(0.01%)#1,374 |
| 70. | Long Branch | 152 | 59,285(0.26%)#70 | 1,230,319(0.01%)#1,387 |
| 71. | Holiday City Berkeley | 149 | 59,285(0.25%)#71 | 1,230,319(0.01%)#1,421 |
| 72. | Bellmawr Borough | 147 | 59,285(0.25%)#72 | 1,230,319(0.01%)#1,447 |
| 73. | Martinsville | 146 | 59,285(0.25%)#73 | 1,230,319(0.01%)#1,454 |
| 74. | Harrington Park Borough | 146 | 59,285(0.25%)#74 | 1,230,319(0.01%)#1,459 |
| 75. | Seaside Heights Borough | 146 | 59,285(0.25%)#75 | 1,230,319(0.01%)#1,460 |
| 76. | Old Tappan Borough | 145 | 59,285(0.24%)#76 | 1,230,319(0.01%)#1,471 |
| 77. | Glen Rock Borough | 142 | 59,285(0.24%)#77 | 1,230,319(0.01%)#1,497 |
| 78. | Pompton Lakes Borough | 142 | 59,285(0.24%)#78 | 1,230,319(0.01%)#1,498 |
| 79. | Oradell Borough | 142 | 59,285(0.24%)#79 | 1,230,319(0.01%)#1,501 |
| 80. | Roseland Borough | 141 | 59,285(0.24%)#80 | 1,230,319(0.01%)#1,510 |
| 81. | Edgewater Borough | 140 | 59,285(0.24%)#81 | 1,230,319(0.01%)#1,516 |
| 82. | Keansburg Borough | 139 | 59,285(0.23%)#82 | 1,230,319(0.01%)#1,520 |
| 83. | Pitman Borough | 137 | 59,285(0.23%)#83 | 1,230,319(0.01%)#1,536 |
| 84. | Brielle Borough | 135 | 59,285(0.23%)#84 | 1,230,319(0.01%)#1,557 |
| 85. | Clearbrook | 133 | 59,285(0.22%)#85 | 1,230,319(0.01%)#1,577 |
| 86. | Cedar Glen West | 131 | 59,285(0.22%)#86 | 1,230,319(0.01%)#1,597 |
| 87. | Upper Montclair | 129 | 59,285(0.22%)#87 | 1,230,319(0.01%)#1,615 |
| 88. | Newton | 127 | 59,285(0.21%)#88 | 1,230,319(0.01%)#1,639 |
| 89. | Haddon Heights Borough | 127 | 59,285(0.21%)#89 | 1,230,319(0.01%)#1,640 |
| 90. | Lincroft | 127 | 59,285(0.21%)#90 | 1,230,319(0.01%)#1,641 |
| 91. | Elizabeth | 126 | 59,285(0.21%)#91 | 1,230,319(0.01%)#1,644 |
| 92. | Hillsdale Borough | 126 | 59,285(0.21%)#92 | 1,230,319(0.01%)#1,656 |
| 93. | Englewood | 125 | 59,285(0.21%)#93 | 1,230,319(0.01%)#1,660 |
| 94. | Colonia | 125 | 59,285(0.21%)#94 | 1,230,319(0.01%)#1,663 |
| 95. | River Edge Borough | 125 | 59,285(0.21%)#95 | 1,230,319(0.01%)#1,664 |
| 96. | Beachwood Borough | 124 | 59,285(0.21%)#96 | 1,230,319(0.01%)#1,673 |
| 97. | Florham Park Borough | 123 | 59,285(0.21%)#97 | 1,230,319(0.01%)#1,681 |
| 98. | Pompton Plains | 123 | 59,285(0.21%)#98 | 1,230,319(0.01%)#1,682 |
| 99. | The Hills | 122 | 59,285(0.21%)#99 | 1,230,319(0.01%)#1,689 |
| 100. | Hammonton | 121 | 59,285(0.20%)#100 | 1,230,319(0.01%)#1,698 |
Common Questions
What are the Top 10 Cities with the Largest Greek Community in New Jersey?
Top 10 Cities with the Largest Greek Community in New Jersey are:
#1
1,076
#2
1,004
#3
946
#4
439
#5
433
#6
399
#7
354
#8
332
#9
331
#10
330
What city has the Largest Greek Community in New Jersey?
Jersey City has the Largest Greek Community in New Jersey with 1,076.
What is the Total Greek Population in the State of New Jersey?
Total Greek Population in New Jersey is 59,285.
What is the Total Greek Population in the United States?
Total Greek Population in the United States is 1,230,319.