Cities with the Highest Percentage of Births to Unmarried Women in New Jersey
RELATED REPORTS & OPTIONS
Highest Illegitimacy | All Women
New Jersey
Compare Cities
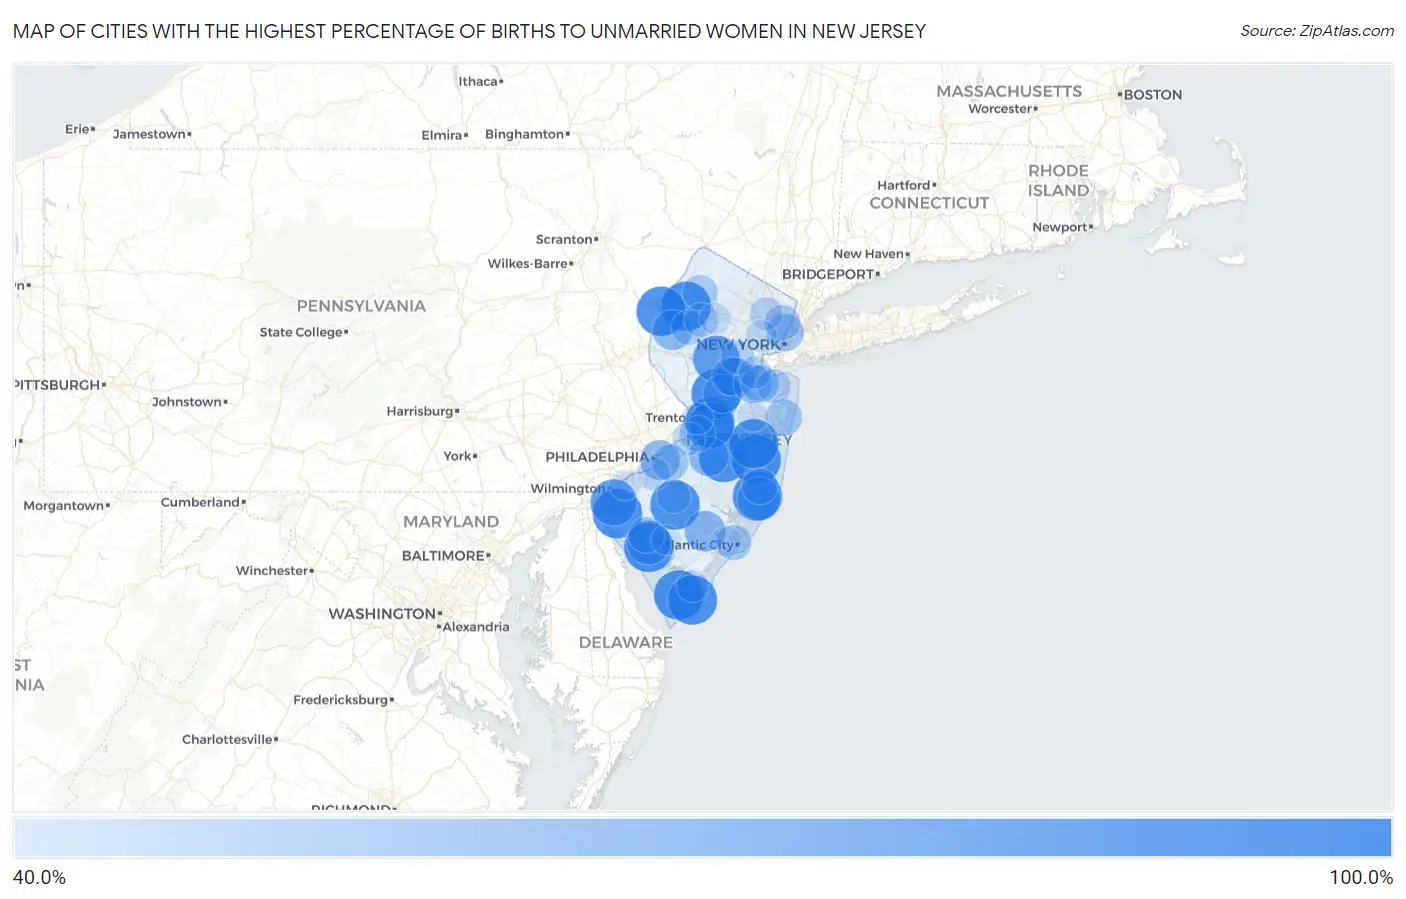
Map of Cities with the Highest Percentage of Births to Unmarried Women in New Jersey
0.0%
100.0%
Cities with the Highest Percentage of Births to Unmarried Women in New Jersey
| City | % Unmarried | vs State | vs National | |
| 1. | Villas | 100.0% | 26.4%(+73.6)#1 | 32.1%(+67.9)#24 |
| 2. | Washington Borough | 100.0% | 26.4%(+73.6)#2 | 32.1%(+67.9)#73 |
| 3. | Yardville | 100.0% | 26.4%(+73.6)#3 | 32.1%(+67.9)#94 |
| 4. | Salem | 100.0% | 26.4%(+73.6)#4 | 32.1%(+67.9)#154 |
| 5. | Bargaintown | 100.0% | 26.4%(+73.6)#5 | 32.1%(+67.9)#158 |
| 6. | Wildwood | 100.0% | 26.4%(+73.6)#6 | 32.1%(+67.9)#163 |
| 7. | Franklin Borough | 100.0% | 26.4%(+73.6)#7 | 32.1%(+67.9)#189 |
| 8. | Bradley Beach Borough | 100.0% | 26.4%(+73.6)#8 | 32.1%(+67.9)#248 |
| 9. | Country Lake Estates | 100.0% | 26.4%(+73.6)#9 | 32.1%(+67.9)#261 |
| 10. | Woodstown Borough | 100.0% | 26.4%(+73.6)#10 | 32.1%(+67.9)#310 |
| 11. | Monmouth Beach Borough | 100.0% | 26.4%(+73.6)#11 | 32.1%(+67.9)#383 |
| 12. | Hopelawn | 100.0% | 26.4%(+73.6)#12 | 32.1%(+67.9)#434 |
| 13. | Stockton University | 100.0% | 26.4%(+73.6)#13 | 32.1%(+67.9)#452 |
| 14. | Manahawkin | 100.0% | 26.4%(+73.6)#14 | 32.1%(+67.9)#607 |
| 15. | Holiday Heights | 100.0% | 26.4%(+73.6)#15 | 32.1%(+67.9)#652 |
| 16. | Cedar Glen West | 100.0% | 26.4%(+73.6)#16 | 32.1%(+67.9)#675 |
| 17. | Folsom Borough | 100.0% | 26.4%(+73.6)#18 | 32.1%(+67.9)#754 |
| 18. | Victory Gardens Borough | 100.0% | 26.4%(+73.6)#19 | 32.1%(+67.9)#755 |
| 19. | Victory Lakes | 100.0% | 26.4%(+73.6)#20 | 32.1%(+67.9)#946 |
| 20. | Kingston | 100.0% | 26.4%(+73.6)#21 | 32.1%(+67.9)#969 |
| 21. | Green | 100.0% | 26.4%(+73.6)#22 | 32.1%(+67.9)#993 |
| 22. | Deal Borough | 100.0% | 26.4%(+73.6)#23 | 32.1%(+67.9)#1,556 |
| 23. | Cedarville | 100.0% | 26.4%(+73.6)#24 | 32.1%(+67.9)#1,731 |
| 24. | Johnsonburg | 100.0% | 26.4%(+73.6)#25 | 32.1%(+67.9)#1,818 |
| 25. | Wrightstown Borough | 100.0% | 26.4%(+73.6)#26 | 32.1%(+67.9)#1,823 |
| 26. | West Wildwood Borough | 100.0% | 26.4%(+73.6)#27 | 32.1%(+67.9)#1,881 |
| 27. | Allenhurst Borough | 100.0% | 26.4%(+73.6)#28 | 32.1%(+67.9)#1,908 |
| 28. | New Gretna | 100.0% | 26.4%(+73.6)#29 | 32.1%(+67.9)#2,320 |
| 29. | Columbia | 100.0% | 26.4%(+73.6)#30 | 32.1%(+67.9)#2,379 |
| 30. | Green Knoll | 92.3% | 26.4%(+65.9)#31 | 32.1%(+60.2)#2,832 |
| 31. | Pennsville | 92.0% | 26.4%(+65.6)#32 | 32.1%(+59.9)#2,839 |
| 32. | Groveville | 89.8% | 26.4%(+63.4)#33 | 32.1%(+57.7)#2,919 |
| 33. | Audubon Park Borough | 88.9% | 26.4%(+62.5)#34 | 32.1%(+56.8)#2,940 |
| 34. | Fairton | 85.7% | 26.4%(+59.3)#35 | 32.1%(+53.6)#3,084 |
| 35. | Vauxhall | 85.4% | 26.4%(+59.0)#36 | 32.1%(+53.3)#3,103 |
| 36. | Penns Grove Borough | 84.7% | 26.4%(+58.3)#37 | 32.1%(+52.6)#3,128 |
| 37. | Beach Haven West | 82.7% | 26.4%(+56.3)#38 | 32.1%(+50.6)#3,248 |
| 38. | Magnolia Borough | 77.1% | 26.4%(+50.7)#39 | 32.1%(+45.0)#3,589 |
| 39. | Mays Landing | 76.6% | 26.4%(+50.2)#40 | 32.1%(+44.5)#3,626 |
| 40. | Northvale Borough | 75.8% | 26.4%(+49.4)#41 | 32.1%(+43.7)#3,663 |
| 41. | Oxford | 75.0% | 26.4%(+48.6)#42 | 32.1%(+42.9)#3,724 |
| 42. | Camden | 74.6% | 26.4%(+48.2)#43 | 32.1%(+42.5)#3,790 |
| 43. | Pemberton Heights | 74.2% | 26.4%(+47.8)#44 | 32.1%(+42.1)#3,809 |
| 44. | New Brunswick | 73.6% | 26.4%(+47.2)#45 | 32.1%(+41.5)#3,839 |
| 45. | Monmouth Junction | 71.3% | 26.4%(+44.9)#46 | 32.1%(+39.2)#4,019 |
| 46. | Clementon Borough | 71.3% | 26.4%(+44.9)#47 | 32.1%(+39.2)#4,022 |
| 47. | Alpha Borough | 71.1% | 26.4%(+44.7)#48 | 32.1%(+39.0)#4,033 |
| 48. | Bellmawr Borough | 70.4% | 26.4%(+44.0)#49 | 32.1%(+38.3)#4,087 |
| 49. | South Toms River Borough | 70.4% | 26.4%(+44.0)#50 | 32.1%(+38.3)#4,089 |
| 50. | East Franklin | 70.2% | 26.4%(+43.8)#51 | 32.1%(+38.1)#4,097 |
| 51. | Madison Park | 70.2% | 26.4%(+43.8)#52 | 32.1%(+38.1)#4,098 |
| 52. | Buena Borough | 69.0% | 26.4%(+42.6)#53 | 32.1%(+36.9)#4,202 |
| 53. | Newfield Borough | 68.8% | 26.4%(+42.4)#54 | 32.1%(+36.7)#4,215 |
| 54. | Guttenberg | 68.2% | 26.4%(+41.8)#55 | 32.1%(+36.1)#4,248 |
| 55. | Brooklawn Borough | 68.2% | 26.4%(+41.8)#56 | 32.1%(+36.1)#4,257 |
| 56. | Cliffwood Beach | 67.9% | 26.4%(+41.5)#57 | 32.1%(+35.8)#4,287 |
| 57. | Bound Brook Borough | 67.2% | 26.4%(+40.8)#58 | 32.1%(+35.1)#4,320 |
| 58. | Oaklyn Borough | 66.7% | 26.4%(+40.3)#59 | 32.1%(+34.6)#4,346 |
| 59. | Lake Como Borough | 66.7% | 26.4%(+40.3)#60 | 32.1%(+34.6)#4,361 |
| 60. | Arrowhead Lake | 66.7% | 26.4%(+40.3)#61 | 32.1%(+34.6)#4,466 |
| 61. | Asbury Park | 65.6% | 26.4%(+39.2)#62 | 32.1%(+33.5)#4,516 |
| 62. | Ellisburg | 65.3% | 26.4%(+38.9)#63 | 32.1%(+33.2)#4,543 |
| 63. | Haledon Borough | 65.0% | 26.4%(+38.6)#64 | 32.1%(+32.9)#4,565 |
| 64. | Barnegat | 64.1% | 26.4%(+37.7)#65 | 32.1%(+32.0)#4,660 |
| 65. | Bridgeton | 63.9% | 26.4%(+37.5)#66 | 32.1%(+31.8)#4,667 |
| 66. | Roebling | 63.6% | 26.4%(+37.2)#67 | 32.1%(+31.5)#4,688 |
| 67. | Ridgefield Park | 62.6% | 26.4%(+36.2)#68 | 32.1%(+30.5)#4,760 |
| 68. | Atlantic City | 62.5% | 26.4%(+36.1)#69 | 32.1%(+30.4)#4,762 |
| 69. | Newton | 62.1% | 26.4%(+35.7)#70 | 32.1%(+30.0)#4,823 |
| 70. | Beattystown | 61.2% | 26.4%(+34.8)#71 | 32.1%(+29.1)#4,906 |
| 71. | Kenilworth Borough | 59.8% | 26.4%(+33.4)#72 | 32.1%(+27.7)#5,102 |
| 72. | Budd Lake | 59.5% | 26.4%(+33.1)#73 | 32.1%(+27.4)#5,121 |
| 73. | Cresskill Borough | 59.4% | 26.4%(+33.0)#74 | 32.1%(+27.3)#5,128 |
| 74. | Port Monmouth | 59.1% | 26.4%(+32.7)#75 | 32.1%(+27.0)#5,165 |
| 75. | Plainfield | 59.0% | 26.4%(+32.6)#76 | 32.1%(+26.9)#5,174 |
| 76. | Williamstown | 58.4% | 26.4%(+32.0)#77 | 32.1%(+26.3)#5,238 |
| 77. | Manville Borough | 57.9% | 26.4%(+31.5)#78 | 32.1%(+25.8)#5,293 |
| 78. | Mendham Borough | 57.8% | 26.4%(+31.4)#79 | 32.1%(+25.7)#5,304 |
| 79. | Paterson | 56.8% | 26.4%(+30.4)#80 | 32.1%(+24.7)#5,425 |
| 80. | Point Pleasant Beach Borough | 56.5% | 26.4%(+30.1)#81 | 32.1%(+24.4)#5,445 |
| 81. | East Newark Borough | 56.3% | 26.4%(+29.9)#82 | 32.1%(+24.2)#5,465 |
| 82. | Woodbury | 56.2% | 26.4%(+29.8)#83 | 32.1%(+24.1)#5,472 |
| 83. | Burlington | 56.0% | 26.4%(+29.6)#84 | 32.1%(+23.9)#5,483 |
| 84. | Perth Amboy | 55.2% | 26.4%(+28.8)#85 | 32.1%(+23.1)#5,555 |
| 85. | East Orange | 53.8% | 26.4%(+27.4)#86 | 32.1%(+21.7)#5,672 |
| 86. | Trenton | 53.5% | 26.4%(+27.1)#87 | 32.1%(+21.4)#5,714 |
| 87. | Cape May Court House | 53.3% | 26.4%(+26.9)#88 | 32.1%(+21.2)#5,728 |
| 88. | Kenvil | 52.9% | 26.4%(+26.5)#89 | 32.1%(+20.8)#5,776 |
| 89. | Woodland Park Borough | 52.6% | 26.4%(+26.2)#90 | 32.1%(+20.5)#5,802 |
| 90. | West Freehold | 51.1% | 26.4%(+24.7)#91 | 32.1%(+19.0)#5,946 |
| 91. | Pine Hill Borough | 51.1% | 26.4%(+24.7)#92 | 32.1%(+19.0)#5,948 |
| 92. | Westville Borough | 50.3% | 26.4%(+23.9)#93 | 32.1%(+18.2)#6,009 |
| 93. | Keansburg Borough | 50.0% | 26.4%(+23.6)#94 | 32.1%(+17.9)#6,030 |
| 94. | Lawnside Borough | 50.0% | 26.4%(+23.6)#95 | 32.1%(+17.9)#6,049 |
| 95. | Gouldtown | 50.0% | 26.4%(+23.6)#96 | 32.1%(+17.9)#6,096 |
| 96. | Pedricktown | 50.0% | 26.4%(+23.6)#97 | 32.1%(+17.9)#6,229 |
| 97. | Pleasantville | 49.6% | 26.4%(+23.2)#98 | 32.1%(+17.5)#6,324 |
| 98. | Millville | 49.2% | 26.4%(+22.8)#99 | 32.1%(+17.1)#6,347 |
| 99. | Cliffside Park Borough | 49.2% | 26.4%(+22.8)#100 | 32.1%(+17.1)#6,348 |
| 100. | Hopatcong Borough | 49.2% | 26.4%(+22.8)#101 | 32.1%(+17.1)#6,350 |
Common Questions
What are the Top 10 Cities with the Highest Percentage of Births to Unmarried Women in New Jersey?
Top 10 Cities with the Highest Percentage of Births to Unmarried Women in New Jersey are:
#1
100.0%
#2
100.0%
#3
100.0%
#4
100.0%
#5
100.0%
#6
100.0%
#7
100.0%
#8
100.0%
#9
100.0%
#10
100.0%
What city has the Highest Percentage of Births to Unmarried Women in New Jersey?
Villas has the Highest Percentage of Births to Unmarried Women in New Jersey with 100.0%.
What is the Percentage of Births to Unmarried Women in the State of New Jersey?
Percentage of Births to Unmarried Women in New Jersey is 26.4%.
What is the Percentage of Births to Unmarried Women in the United States?
Percentage of Births to Unmarried Women in the United States is 32.1%.