Bound Brook borough, NJ Map & Demographics
Bound Brook borough Overview
$42,456
PER CAPITA INCOME
$81,618
AVG FAMILY INCOME
$78,776
AVG HOUSEHOLD INCOME
24.2%
WAGE / INCOME GAP [ % ]
75.8¢/ $1
WAGE / INCOME GAP [ $ ]
0.45
INEQUALITY / GINI INDEX
11,906
TOTAL POPULATION
5,851
MALE POPULATION
6,055
FEMALE POPULATION
96.63
MALES / 100 FEMALES
103.49
FEMALES / 100 MALES
36.2
MEDIAN AGE
3.2
AVG FAMILY SIZE
2.6
AVG HOUSEHOLD SIZE
7,092
LABOR FORCE [ PEOPLE ]
74.5%
PERCENT IN LABOR FORCE
6.6%
UNEMPLOYMENT RATE
Income in Bound Brook borough
Income Overview in Bound Brook borough
Per Capita Income in Bound Brook borough is $42,456, while median incomes of families and households are $81,618 and $78,776 respectively.
| Characteristic | Number | Measure |
| Per Capita Income | 11,906 | $42,456 |
| Median Family Income | 2,986 | $81,618 |
| Mean Family Income | 2,986 | $104,739 |
| Median Household Income | 4,567 | $78,776 |
| Mean Household Income | 4,567 | $104,486 |
| Income Deficit | 2,986 | $0 |
| Wage / Income Gap (%) | 11,906 | 24.16% |
| Wage / Income Gap ($) | 11,906 | 75.84¢ per $1 |
| Gini / Inequality Index | 11,906 | 0.45 |
Earnings by Sex in Bound Brook borough
Average Earnings in Bound Brook borough are $42,697, $46,768 for men and $35,469 for women, a difference of 24.2%.
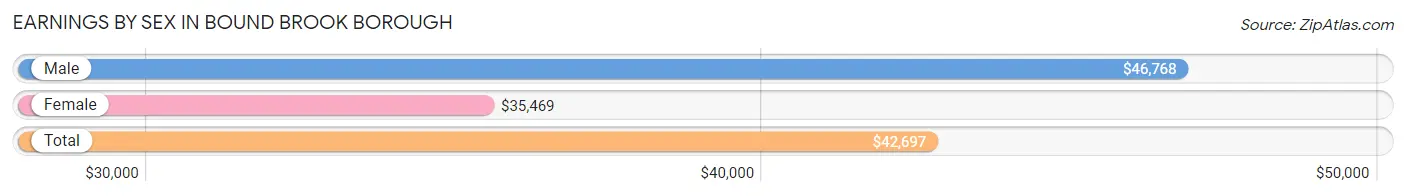
| Sex | Number | Average Earnings |
| Male | 3,823 (54.2%) | $46,768 |
| Female | 3,235 (45.8%) | $35,469 |
| Total | 7,058 (100.0%) | $42,697 |
Earnings by Sex by Income Bracket in Bound Brook borough
The most common earnings brackets in Bound Brook borough are $100,000+ for men (785 | 20.5%) and $100,000+ for women (381 | 11.8%).
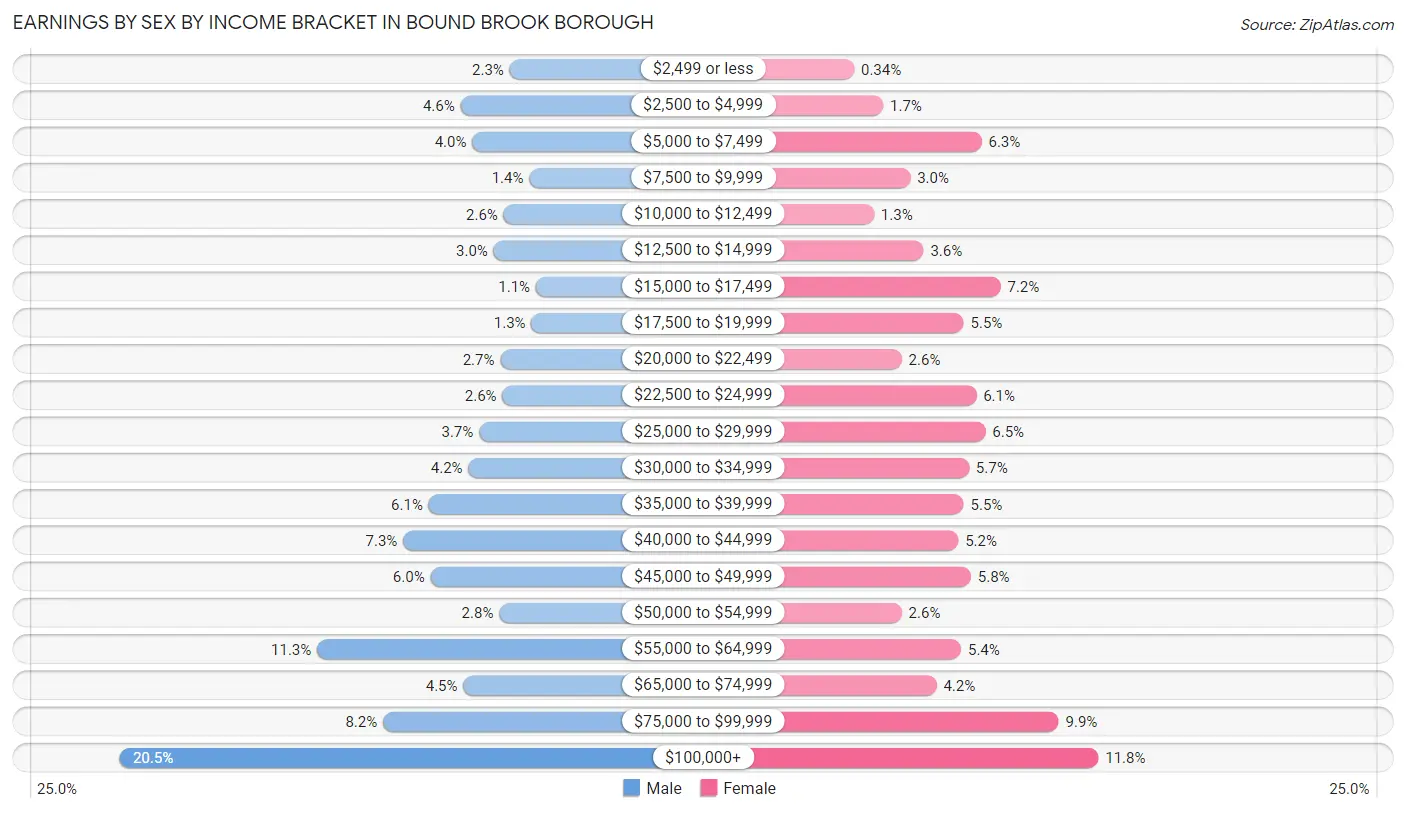
| Income | Male | Female |
| $2,499 or less | 87 (2.3%) | 11 (0.3%) |
| $2,500 to $4,999 | 175 (4.6%) | 55 (1.7%) |
| $5,000 to $7,499 | 154 (4.0%) | 204 (6.3%) |
| $7,500 to $9,999 | 52 (1.4%) | 96 (3.0%) |
| $10,000 to $12,499 | 98 (2.6%) | 41 (1.3%) |
| $12,500 to $14,999 | 116 (3.0%) | 116 (3.6%) |
| $15,000 to $17,499 | 40 (1.1%) | 233 (7.2%) |
| $17,500 to $19,999 | 48 (1.3%) | 177 (5.5%) |
| $20,000 to $22,499 | 104 (2.7%) | 83 (2.6%) |
| $22,500 to $24,999 | 100 (2.6%) | 196 (6.1%) |
| $25,000 to $29,999 | 142 (3.7%) | 210 (6.5%) |
| $30,000 to $34,999 | 161 (4.2%) | 185 (5.7%) |
| $35,000 to $39,999 | 232 (6.1%) | 177 (5.5%) |
| $40,000 to $44,999 | 278 (7.3%) | 169 (5.2%) |
| $45,000 to $49,999 | 229 (6.0%) | 188 (5.8%) |
| $50,000 to $54,999 | 106 (2.8%) | 83 (2.6%) |
| $55,000 to $64,999 | 432 (11.3%) | 173 (5.3%) |
| $65,000 to $74,999 | 170 (4.4%) | 136 (4.2%) |
| $75,000 to $99,999 | 314 (8.2%) | 321 (9.9%) |
| $100,000+ | 785 (20.5%) | 381 (11.8%) |
| Total | 3,823 (100.0%) | 3,235 (100.0%) |
Earnings by Sex by Educational Attainment in Bound Brook borough
Average earnings in Bound Brook borough are $50,598 for men and $38,657 for women, a difference of 23.6%. Men with an educational attainment of graduate degree enjoy the highest average annual earnings of $73,514, while those with less than high school education earn the least with $23,750. Women with an educational attainment of graduate degree earn the most with the average annual earnings of $79,681, while those with less than high school education have the smallest earnings of $19,120.
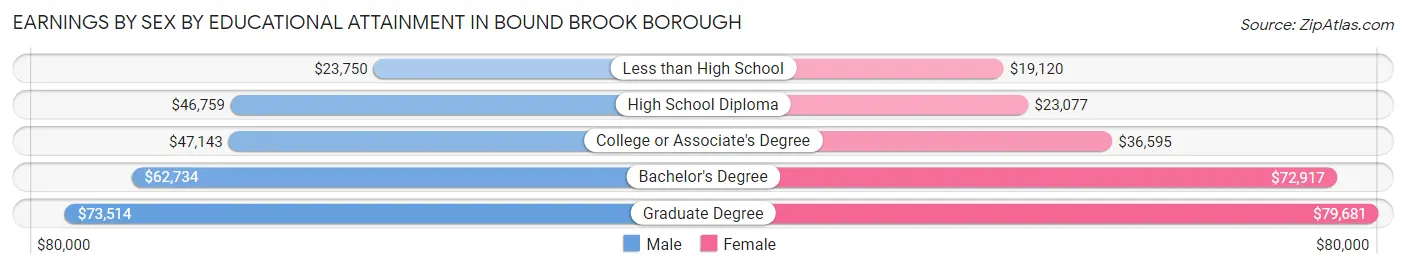
| Educational Attainment | Male Income | Female Income |
| Less than High School | $23,750 | $19,120 |
| High School Diploma | $46,759 | $23,077 |
| College or Associate's Degree | $47,143 | $36,595 |
| Bachelor's Degree | $62,734 | $72,917 |
| Graduate Degree | $73,514 | $79,681 |
| Total | $50,598 | $38,657 |
Family Income in Bound Brook borough
Family Income Brackets in Bound Brook borough
According to the Bound Brook borough family income data, there are 588 families falling into the $100,000 to $149,999 income range, which is the most common income bracket and makes up 19.7% of all families. Conversely, the less than $10,000 income bracket is the least frequent group with only 66 families (2.2%) belonging to this category.
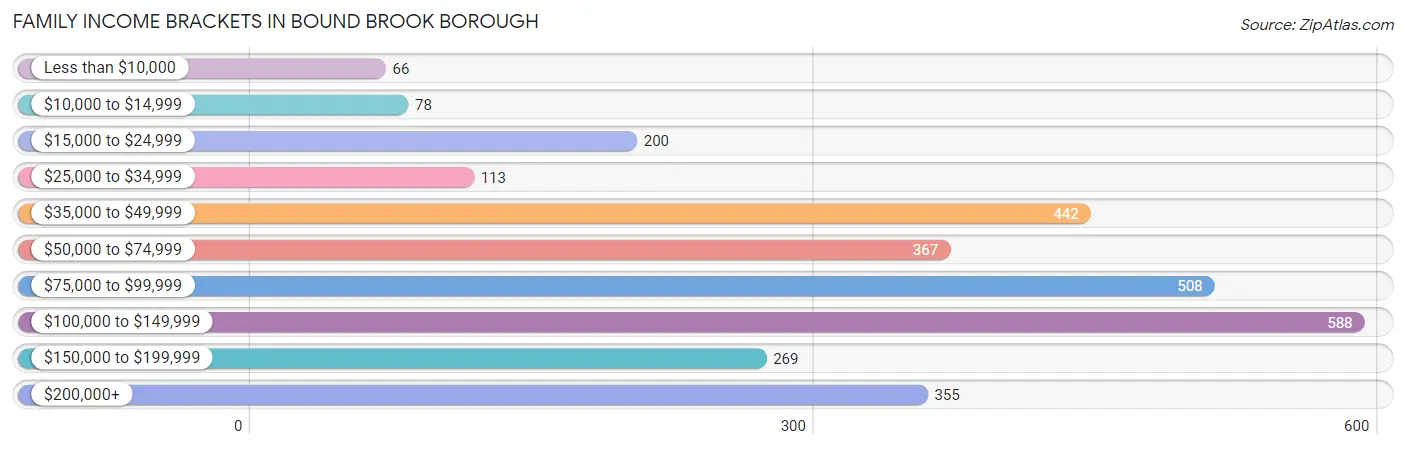
| Income Bracket | # Families | % Families |
| Less than $10,000 | 66 | 2.2% |
| $10,000 to $14,999 | 78 | 2.6% |
| $15,000 to $24,999 | 200 | 6.7% |
| $25,000 to $34,999 | 113 | 3.8% |
| $35,000 to $49,999 | 442 | 14.8% |
| $50,000 to $74,999 | 367 | 12.3% |
| $75,000 to $99,999 | 508 | 17.0% |
| $100,000 to $149,999 | 588 | 19.7% |
| $150,000 to $199,999 | 269 | 9.0% |
| $200,000+ | 355 | 11.9% |
Family Income by Famaliy Size in Bound Brook borough
7+ person families (49 | 1.6%) account for the highest median family income in Bound Brook borough with $202,639 per family, while 2-person families (1,224 | 41.0%) have the highest median income of $37,341 per family member.
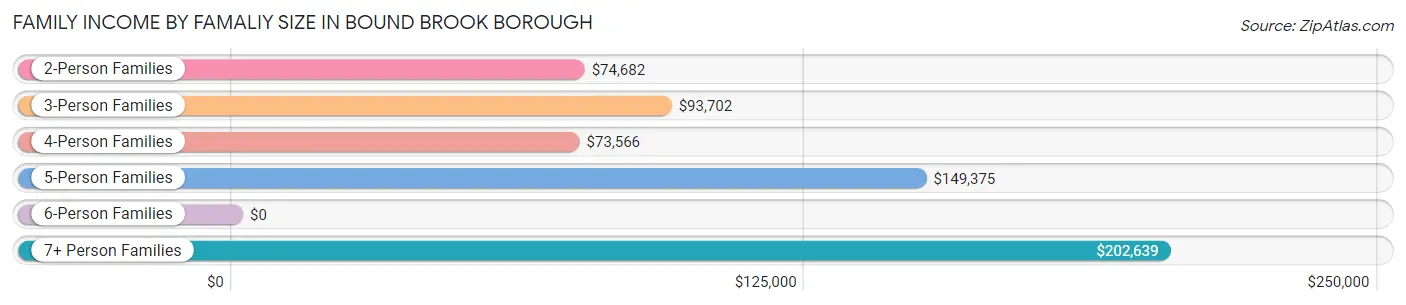
| Income Bracket | # Families | Median Income |
| 2-Person Families | 1,224 (41.0%) | $74,682 |
| 3-Person Families | 699 (23.4%) | $93,702 |
| 4-Person Families | 723 (24.2%) | $73,566 |
| 5-Person Families | 278 (9.3%) | $149,375 |
| 6-Person Families | 13 (0.4%) | $0 |
| 7+ Person Families | 49 (1.6%) | $202,639 |
| Total | 2,986 (100.0%) | $81,618 |
Family Income by Number of Earners in Bound Brook borough
The median family income in Bound Brook borough is $81,618, with families comprising 3+ earners (466) having the highest median family income of $136,250, while families with 1 earner (1,166) have the lowest median family income of $57,500, accounting for 15.6% and 39.1% of families, respectively.
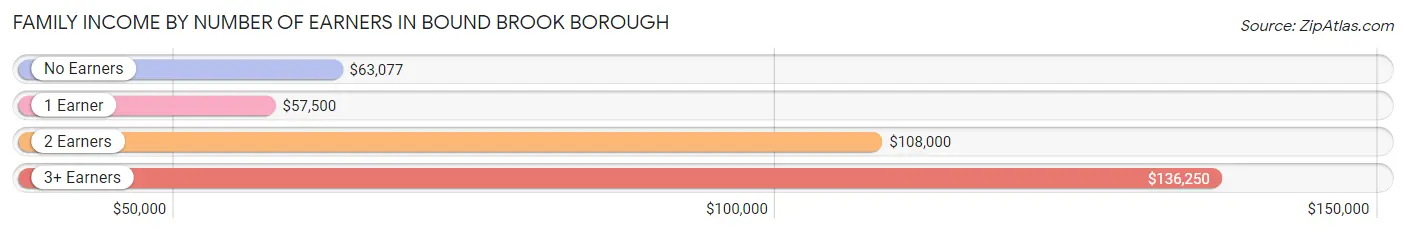
| Number of Earners | # Families | Median Income |
| No Earners | 164 (5.5%) | $63,077 |
| 1 Earner | 1,166 (39.1%) | $57,500 |
| 2 Earners | 1,190 (39.9%) | $108,000 |
| 3+ Earners | 466 (15.6%) | $136,250 |
| Total | 2,986 (100.0%) | $81,618 |
Household Income in Bound Brook borough
Household Income Brackets in Bound Brook borough
With 854 households falling in the category, the $100,000 to $149,999 income range is the most frequent in Bound Brook borough, accounting for 18.7% of all households. In contrast, only 132 households (2.9%) fall into the less than $10,000 income bracket, making it the least populous group.
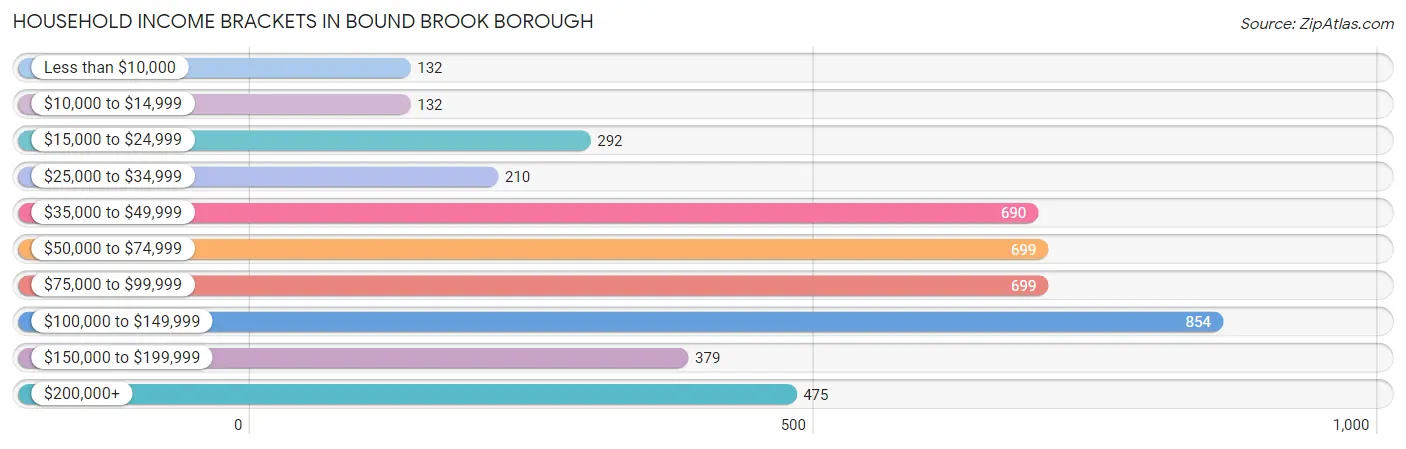
| Income Bracket | # Households | % Households |
| Less than $10,000 | 132 | 2.9% |
| $10,000 to $14,999 | 132 | 2.9% |
| $15,000 to $24,999 | 292 | 6.4% |
| $25,000 to $34,999 | 210 | 4.6% |
| $35,000 to $49,999 | 690 | 15.1% |
| $50,000 to $74,999 | 699 | 15.3% |
| $75,000 to $99,999 | 699 | 15.3% |
| $100,000 to $149,999 | 854 | 18.7% |
| $150,000 to $199,999 | 379 | 8.3% |
| $200,000+ | 475 | 10.4% |
Household Income by Householder Age in Bound Brook borough
The median household income in Bound Brook borough is $78,776, with the highest median household income of $117,527 found in the 45 to 64 years age bracket for the primary householder. A total of 1,371 households (30.0%) fall into this category. Meanwhile, the 15 to 24 years age bracket for the primary householder has the lowest median household income of $46,413, with 66 households (1.5%) in this group.
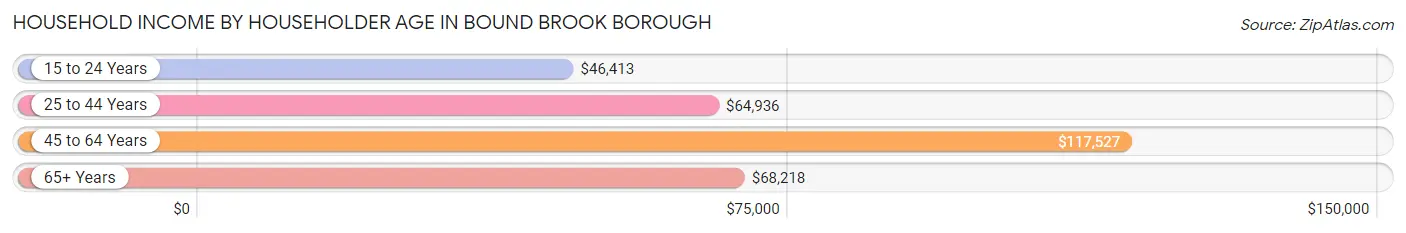
| Income Bracket | # Households | Median Income |
| 15 to 24 Years | 66 (1.5%) | $46,413 |
| 25 to 44 Years | 2,077 (45.5%) | $64,936 |
| 45 to 64 Years | 1,371 (30.0%) | $117,527 |
| 65+ Years | 1,053 (23.1%) | $68,218 |
| Total | 4,567 (100.0%) | $78,776 |
Poverty in Bound Brook borough
Income Below Poverty by Sex and Age in Bound Brook borough
With 7.3% poverty level for males and 11.5% for females among the residents of Bound Brook borough, 15 year old males and 16 and 17 year old females are the most vulnerable to poverty, with 32 males (23.2%) and 72 females (61.0%) in their respective age groups living below the poverty level.
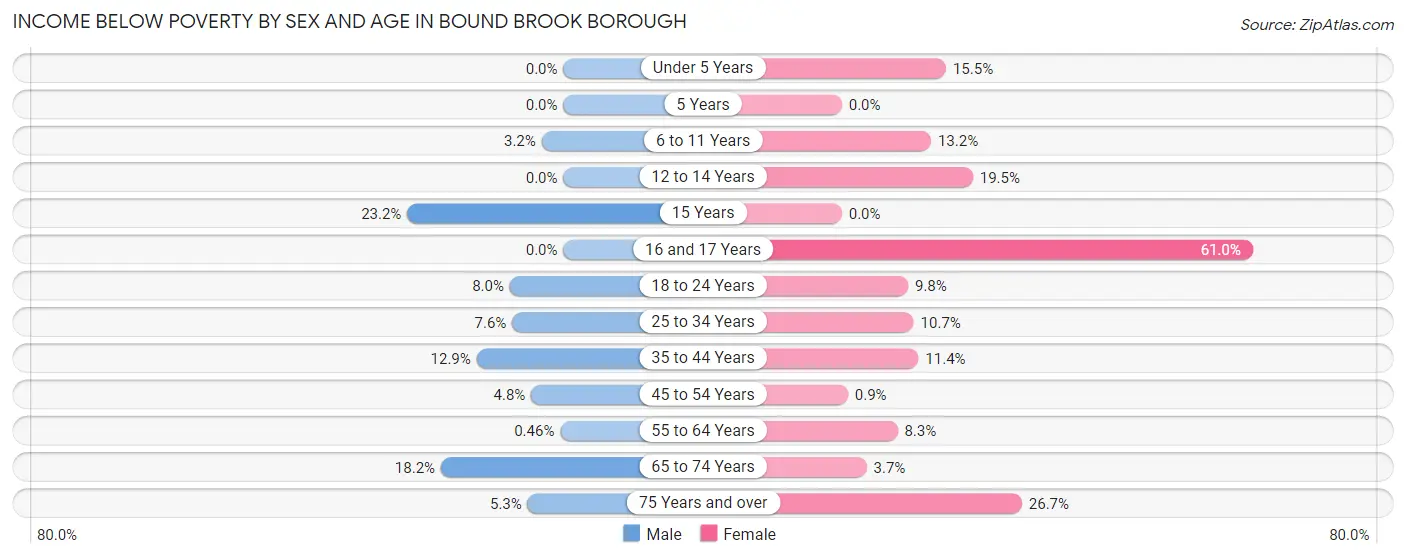
| Age Bracket | Male | Female |
| Under 5 Years | 0 (0.0%) | 69 (15.5%) |
| 5 Years | 0 (0.0%) | 0 (0.0%) |
| 6 to 11 Years | 18 (3.2%) | 49 (13.2%) |
| 12 to 14 Years | 0 (0.0%) | 57 (19.5%) |
| 15 Years | 32 (23.2%) | 0 (0.0%) |
| 16 and 17 Years | 0 (0.0%) | 72 (61.0%) |
| 18 to 24 Years | 28 (8.0%) | 55 (9.8%) |
| 25 to 34 Years | 86 (7.6%) | 113 (10.7%) |
| 35 to 44 Years | 135 (12.9%) | 108 (11.4%) |
| 45 to 54 Years | 36 (4.8%) | 7 (0.9%) |
| 55 to 64 Years | 3 (0.5%) | 43 (8.3%) |
| 65 to 74 Years | 78 (18.2%) | 17 (3.7%) |
| 75 Years and over | 13 (5.3%) | 104 (26.7%) |
| Total | 429 (7.3%) | 694 (11.5%) |
Income Above Poverty by Sex and Age in Bound Brook borough
According to the poverty statistics in Bound Brook borough, males aged under 5 years and females aged 5 years are the age groups that are most secure financially, with 100.0% of males and 100.0% of females in these age groups living above the poverty line.
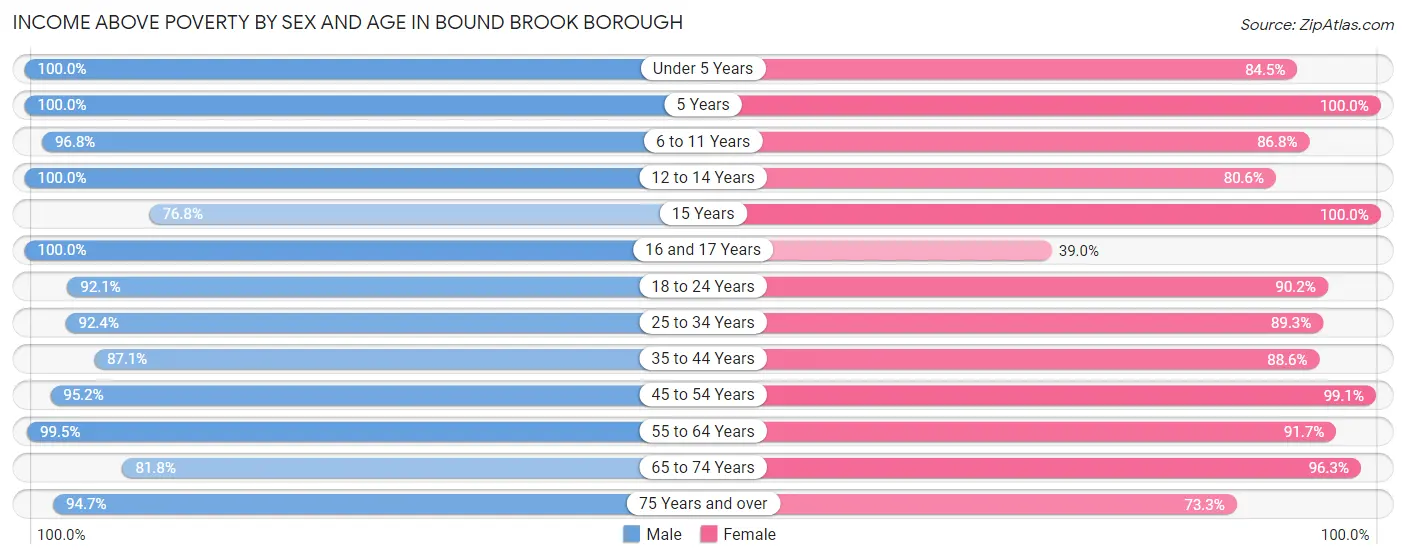
| Age Bracket | Male | Female |
| Under 5 Years | 346 (100.0%) | 377 (84.5%) |
| 5 Years | 23 (100.0%) | 67 (100.0%) |
| 6 to 11 Years | 539 (96.8%) | 321 (86.8%) |
| 12 to 14 Years | 102 (100.0%) | 236 (80.5%) |
| 15 Years | 106 (76.8%) | 42 (100.0%) |
| 16 and 17 Years | 80 (100.0%) | 46 (39.0%) |
| 18 to 24 Years | 324 (92.0%) | 504 (90.2%) |
| 25 to 34 Years | 1,046 (92.4%) | 946 (89.3%) |
| 35 to 44 Years | 913 (87.1%) | 841 (88.6%) |
| 45 to 54 Years | 717 (95.2%) | 772 (99.1%) |
| 55 to 64 Years | 643 (99.5%) | 477 (91.7%) |
| 65 to 74 Years | 351 (81.8%) | 445 (96.3%) |
| 75 Years and over | 232 (94.7%) | 285 (73.3%) |
| Total | 5,422 (92.7%) | 5,359 (88.5%) |
Income Below Poverty Among Married-Couple Families in Bound Brook borough
The poverty statistics for married-couple families in Bound Brook borough show that 0.7% or 13 of the total 1,936 families live below the poverty line. Families with no children have the highest poverty rate of 1.3%, comprising of 13 families. On the other hand, families with 1 or 2 children have the lowest poverty rate of 0.0%, which includes 0 families.
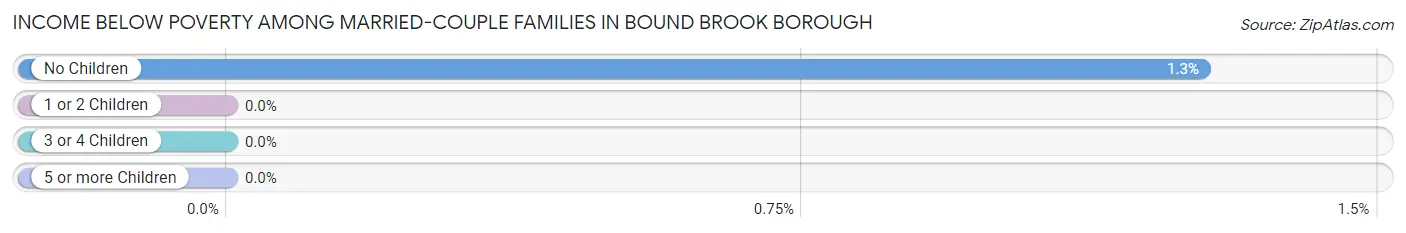
| Children | Above Poverty | Below Poverty |
| No Children | 1,013 (98.7%) | 13 (1.3%) |
| 1 or 2 Children | 830 (100.0%) | 0 (0.0%) |
| 3 or 4 Children | 80 (100.0%) | 0 (0.0%) |
| 5 or more Children | 0 (0.0%) | 0 (0.0%) |
| Total | 1,923 (99.3%) | 13 (0.7%) |
Income Below Poverty Among Single-Parent Households in Bound Brook borough
According to the poverty data in Bound Brook borough, 33.3% or 156 single-father households and 18.4% or 107 single-mother households are living below the poverty line. Among single-father households, those with 3 or 4 children have the highest poverty rate, with 76 households (71.0%) experiencing poverty. Likewise, among single-mother households, those with no children have the highest poverty rate, with 71 households (29.2%) falling below the poverty line.
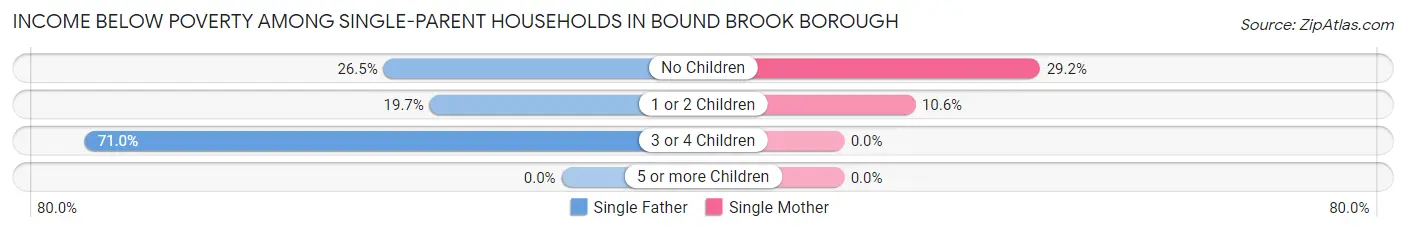
| Children | Single Father | Single Mother |
| No Children | 35 (26.5%) | 71 (29.2%) |
| 1 or 2 Children | 45 (19.7%) | 36 (10.6%) |
| 3 or 4 Children | 76 (71.0%) | 0 (0.0%) |
| 5 or more Children | 0 (0.0%) | 0 (0.0%) |
| Total | 156 (33.3%) | 107 (18.4%) |
Income Below Poverty Among Married-Couple vs Single-Parent Households in Bound Brook borough
The poverty data for Bound Brook borough shows that 13 of the married-couple family households (0.7%) and 263 of the single-parent households (25.1%) are living below the poverty level. Within the married-couple family households, those with no children have the highest poverty rate, with 13 households (1.3%) falling below the poverty line. Among the single-parent households, those with 3 or 4 children have the highest poverty rate, with 76 household (71.0%) living below poverty.
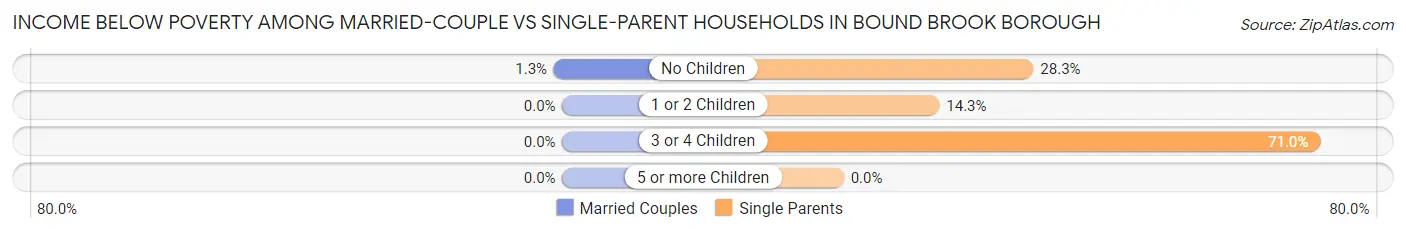
| Children | Married-Couple Families | Single-Parent Households |
| No Children | 13 (1.3%) | 106 (28.3%) |
| 1 or 2 Children | 0 (0.0%) | 81 (14.3%) |
| 3 or 4 Children | 0 (0.0%) | 76 (71.0%) |
| 5 or more Children | 0 (0.0%) | 0 (0.0%) |
| Total | 13 (0.7%) | 263 (25.1%) |
Race in Bound Brook borough
The most populous races in Bound Brook borough are Hispanic or Latino (6,146 | 51.6%), White / Caucasian (5,873 | 49.3%), and Some other Race (3,318 | 27.9%).
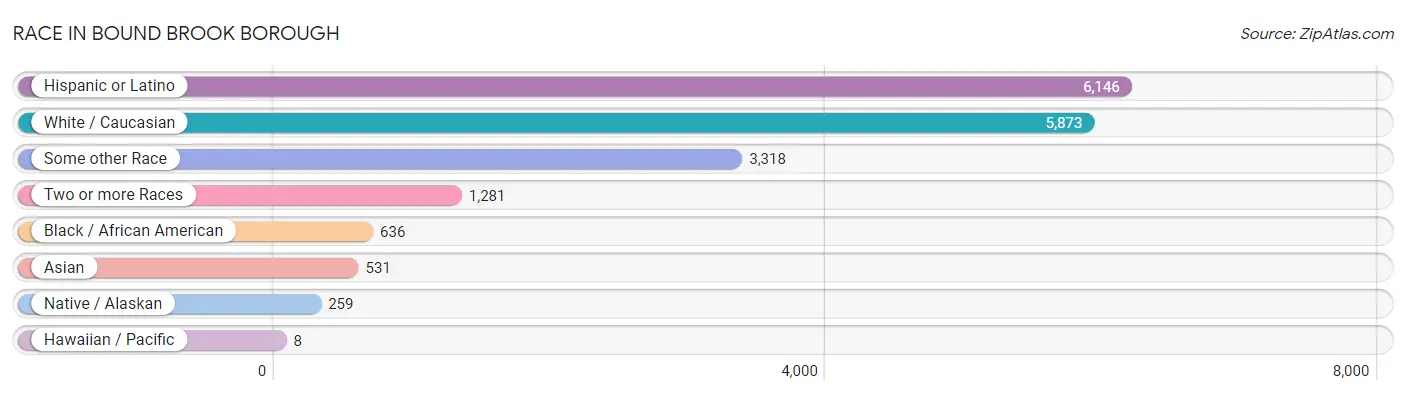
| Race | # Population | % Population |
| Asian | 531 | 4.5% |
| Black / African American | 636 | 5.3% |
| Hawaiian / Pacific | 8 | 0.1% |
| Hispanic or Latino | 6,146 | 51.6% |
| Native / Alaskan | 259 | 2.2% |
| White / Caucasian | 5,873 | 49.3% |
| Two or more Races | 1,281 | 10.8% |
| Some other Race | 3,318 | 27.9% |
| Total | 11,906 | 100.0% |
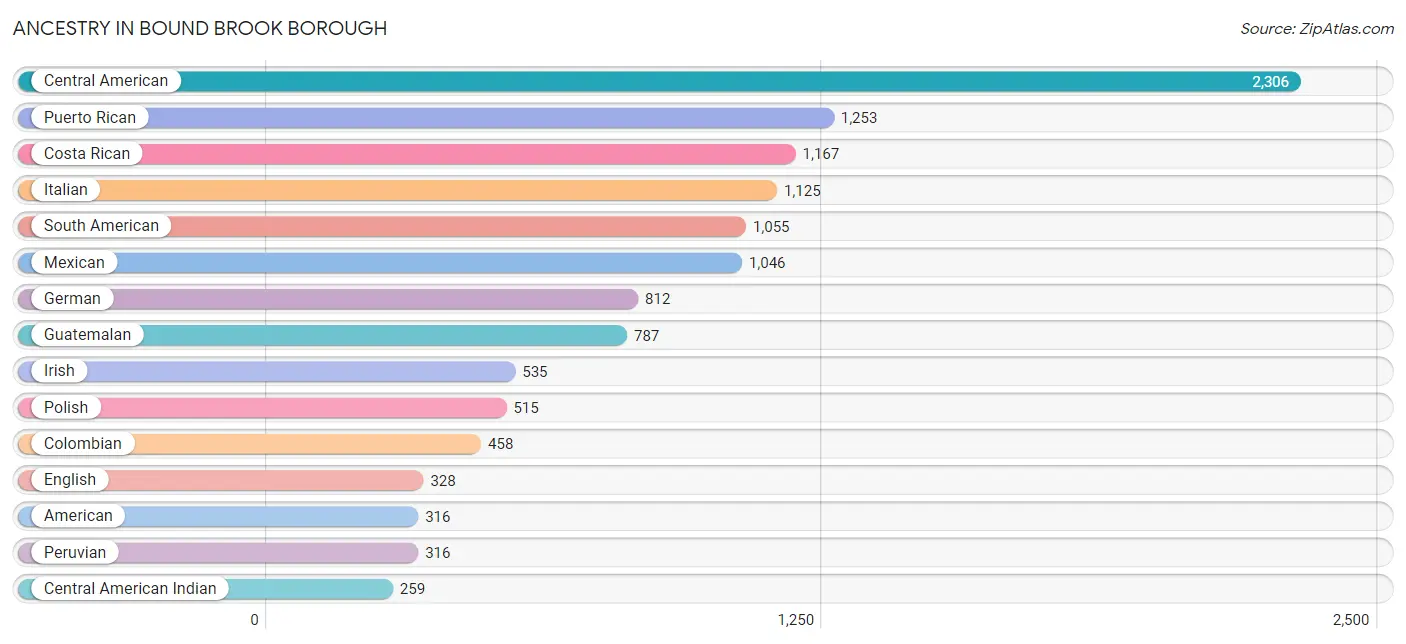
Ancestry in Bound Brook borough
The most populous ancestries reported in Bound Brook borough are Central American (2,306 | 19.4%), Puerto Rican (1,253 | 10.5%), Costa Rican (1,167 | 9.8%), Italian (1,125 | 9.5%), and South American (1,055 | 8.9%), together accounting for 58.0% of all Bound Brook borough residents.
| Ancestry | # Population | % Population |
| African | 15 | 0.1% |
| American | 316 | 2.6% |
| Arab | 33 | 0.3% |
| Argentinean | 19 | 0.2% |
| Armenian | 6 | 0.1% |
| Austrian | 13 | 0.1% |
| Belgian | 13 | 0.1% |
| Bhutanese | 35 | 0.3% |
| Brazilian | 34 | 0.3% |
| British | 14 | 0.1% |
| Burmese | 143 | 1.2% |
| Central American | 2,306 | 19.4% |
| Central American Indian | 259 | 2.2% |
| Cherokee | 27 | 0.2% |
| Colombian | 458 | 3.8% |
| Costa Rican | 1,167 | 9.8% |
| Cuban | 98 | 0.8% |
| Czech | 35 | 0.3% |
| Czechoslovakian | 73 | 0.6% |
| Danish | 9 | 0.1% |
| Dominican | 138 | 1.2% |
| Dutch | 131 | 1.1% |
| Eastern European | 71 | 0.6% |
| Ecuadorian | 222 | 1.9% |
| Egyptian | 17 | 0.1% |
| English | 328 | 2.8% |
| European | 55 | 0.5% |
| Filipino | 54 | 0.4% |
| French | 28 | 0.2% |
| French Canadian | 5 | 0.0% |
| German | 812 | 6.8% |
| Greek | 57 | 0.5% |
| Guatemalan | 787 | 6.6% |
| Guyanese | 14 | 0.1% |
| Honduran | 155 | 1.3% |
| Hungarian | 75 | 0.6% |
| Indian (Asian) | 207 | 1.7% |
| Iranian | 15 | 0.1% |
| Irish | 535 | 4.5% |
| Italian | 1,125 | 9.5% |
| Jamaican | 37 | 0.3% |
| Korean | 96 | 0.8% |
| Laotian | 15 | 0.1% |
| Lebanese | 16 | 0.1% |
| Lithuanian | 7 | 0.1% |
| Mexican | 1,046 | 8.8% |
| Mexican American Indian | 8 | 0.1% |
| Native Hawaiian | 29 | 0.2% |
| New Zealander | 2 | 0.0% |
| Nicaraguan | 32 | 0.3% |
| Norwegian | 77 | 0.6% |
| Panamanian | 26 | 0.2% |
| Paraguayan | 40 | 0.3% |
| Peruvian | 316 | 2.6% |
| Polish | 515 | 4.3% |
| Portuguese | 134 | 1.1% |
| Puerto Rican | 1,253 | 10.5% |
| Romanian | 9 | 0.1% |
| Russian | 52 | 0.4% |
| Salvadoran | 139 | 1.2% |
| Scotch-Irish | 39 | 0.3% |
| Scottish | 35 | 0.3% |
| Serbian | 15 | 0.1% |
| Slavic | 2 | 0.0% |
| Slovak | 34 | 0.3% |
| South American | 1,055 | 8.9% |
| Spanish | 42 | 0.4% |
| Subsaharan African | 15 | 0.1% |
| Swedish | 41 | 0.3% |
| Thai | 221 | 1.9% |
| Trinidadian and Tobagonian | 9 | 0.1% |
| Turkish | 17 | 0.1% |
| Ukrainian | 104 | 0.9% |
| Welsh | 36 | 0.3% |
| Yugoslavian | 23 | 0.2% | View All 75 Rows |
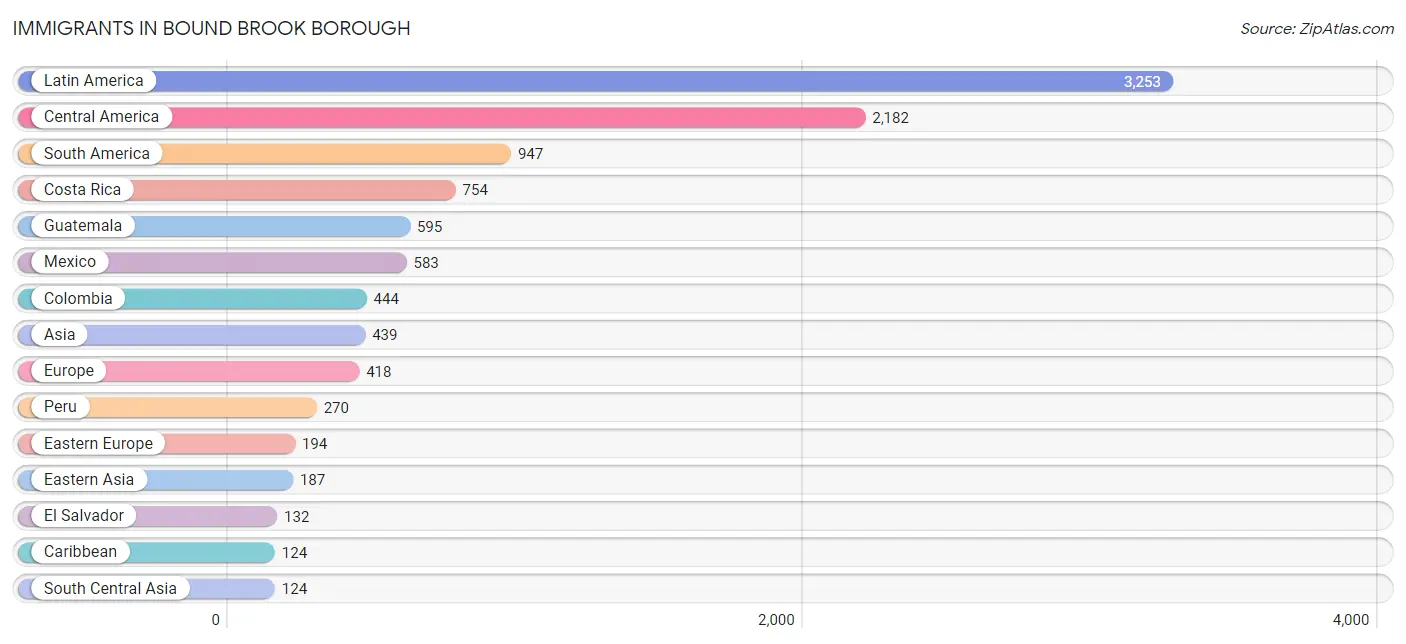
Immigrants in Bound Brook borough
The most numerous immigrant groups reported in Bound Brook borough came from Latin America (3,253 | 27.3%), Central America (2,182 | 18.3%), South America (947 | 8.0%), Costa Rica (754 | 6.3%), and Guatemala (595 | 5.0%), together accounting for 64.9% of all Bound Brook borough residents.
| Immigration Origin | # Population | % Population |
| Africa | 54 | 0.4% |
| Argentina | 33 | 0.3% |
| Asia | 439 | 3.7% |
| Bosnia and Herzegovina | 15 | 0.1% |
| Brazil | 8 | 0.1% |
| Caribbean | 124 | 1.0% |
| Central America | 2,182 | 18.3% |
| China | 101 | 0.9% |
| Colombia | 444 | 3.7% |
| Costa Rica | 754 | 6.3% |
| Cuba | 1 | 0.0% |
| Czechoslovakia | 15 | 0.1% |
| Dominican Republic | 71 | 0.6% |
| Eastern Africa | 22 | 0.2% |
| Eastern Asia | 187 | 1.6% |
| Eastern Europe | 194 | 1.6% |
| Ecuador | 114 | 1.0% |
| Egypt | 20 | 0.2% |
| El Salvador | 132 | 1.1% |
| England | 53 | 0.4% |
| Europe | 418 | 3.5% |
| Greece | 17 | 0.1% |
| Guatemala | 595 | 5.0% |
| Guyana | 14 | 0.1% |
| Honduras | 86 | 0.7% |
| India | 109 | 0.9% |
| Indonesia | 15 | 0.1% |
| Iran | 15 | 0.1% |
| Italy | 36 | 0.3% |
| Japan | 17 | 0.1% |
| Korea | 69 | 0.6% |
| Latin America | 3,253 | 27.3% |
| Mexico | 583 | 4.9% |
| Middle Africa | 12 | 0.1% |
| Nicaragua | 32 | 0.3% |
| Northern Africa | 20 | 0.2% |
| Northern Europe | 106 | 0.9% |
| Norway | 51 | 0.4% |
| Oceania | 9 | 0.1% |
| Peru | 270 | 2.3% |
| Philippines | 80 | 0.7% |
| Poland | 94 | 0.8% |
| Portugal | 65 | 0.5% |
| Romania | 9 | 0.1% |
| Serbia | 23 | 0.2% |
| South America | 947 | 8.0% |
| South Central Asia | 124 | 1.0% |
| South Eastern Asia | 95 | 0.8% |
| Southern Europe | 118 | 1.0% |
| Taiwan | 38 | 0.3% |
| Trinidad and Tobago | 9 | 0.1% |
| Turkey | 17 | 0.1% |
| Ukraine | 38 | 0.3% |
| Venezuela | 51 | 0.4% |
| West Indies | 43 | 0.4% |
| Western Asia | 33 | 0.3% | View All 56 Rows |
Sex and Age in Bound Brook borough
Sex and Age in Bound Brook borough
The most populous age groups in Bound Brook borough are 35 to 39 Years (583 | 10.0%) for men and 25 to 29 Years (612 | 10.1%) for women.
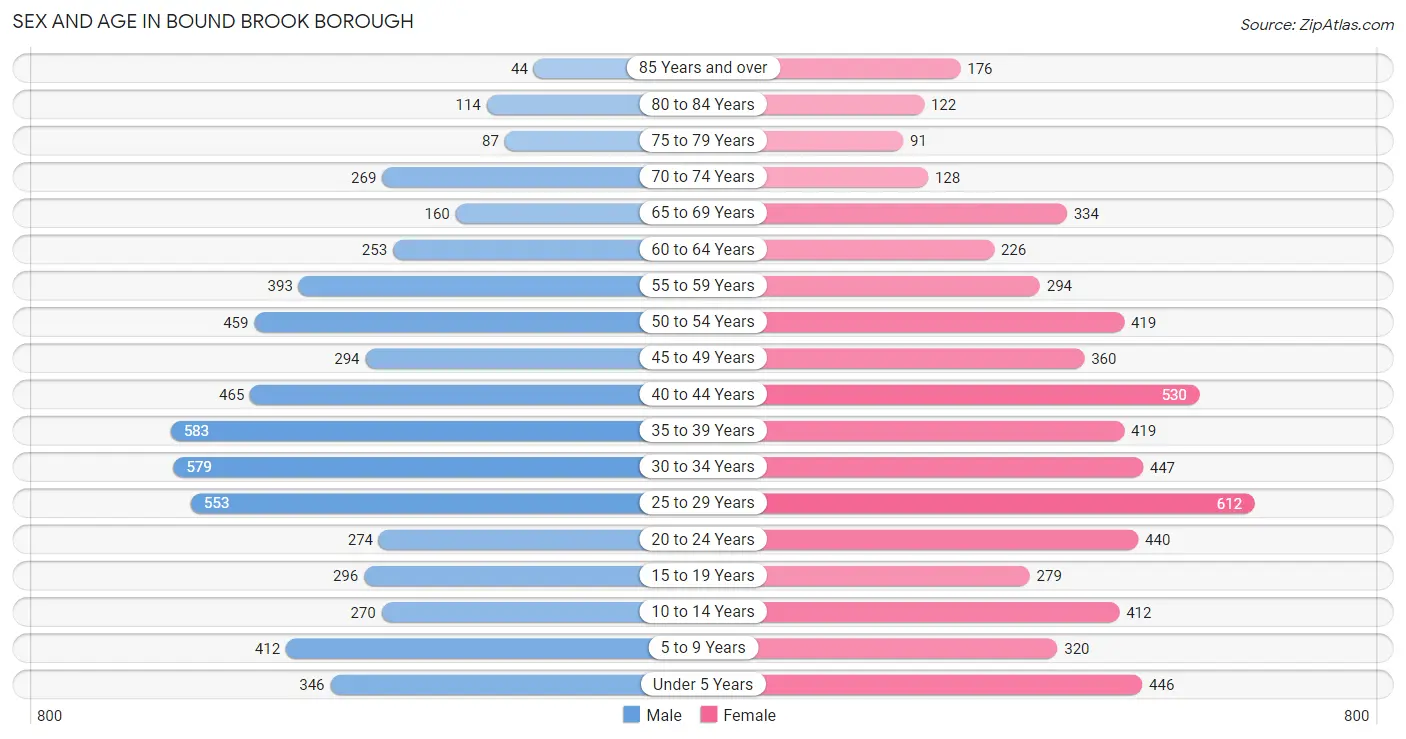
| Age Bracket | Male | Female |
| Under 5 Years | 346 (5.9%) | 446 (7.4%) |
| 5 to 9 Years | 412 (7.0%) | 320 (5.3%) |
| 10 to 14 Years | 270 (4.6%) | 412 (6.8%) |
| 15 to 19 Years | 296 (5.1%) | 279 (4.6%) |
| 20 to 24 Years | 274 (4.7%) | 440 (7.3%) |
| 25 to 29 Years | 553 (9.5%) | 612 (10.1%) |
| 30 to 34 Years | 579 (9.9%) | 447 (7.4%) |
| 35 to 39 Years | 583 (10.0%) | 419 (6.9%) |
| 40 to 44 Years | 465 (8.0%) | 530 (8.7%) |
| 45 to 49 Years | 294 (5.0%) | 360 (5.9%) |
| 50 to 54 Years | 459 (7.8%) | 419 (6.9%) |
| 55 to 59 Years | 393 (6.7%) | 294 (4.9%) |
| 60 to 64 Years | 253 (4.3%) | 226 (3.7%) |
| 65 to 69 Years | 160 (2.7%) | 334 (5.5%) |
| 70 to 74 Years | 269 (4.6%) | 128 (2.1%) |
| 75 to 79 Years | 87 (1.5%) | 91 (1.5%) |
| 80 to 84 Years | 114 (1.9%) | 122 (2.0%) |
| 85 Years and over | 44 (0.7%) | 176 (2.9%) |
| Total | 5,851 (100.0%) | 6,055 (100.0%) |
Families and Households in Bound Brook borough
Median Family Size in Bound Brook borough
The median family size in Bound Brook borough is 3.17 persons per family, with married-couple families (1,936 | 64.8%) accounting for the largest median family size of 3.31 persons per family. On the other hand, single female/mother families (582 | 19.5%) represent the smallest median family size with 2.88 persons per family.
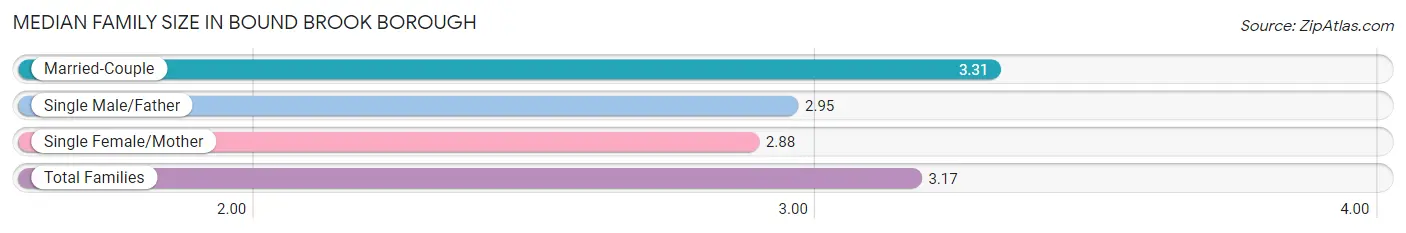
| Family Type | # Families | Family Size |
| Married-Couple | 1,936 (64.8%) | 3.31 |
| Single Male/Father | 468 (15.7%) | 2.95 |
| Single Female/Mother | 582 (19.5%) | 2.88 |
| Total Families | 2,986 (100.0%) | 3.17 |
Median Household Size in Bound Brook borough
The median household size in Bound Brook borough is 2.60 persons per household, with single male/father households (468 | 10.2%) accounting for the largest median household size of 3.49 persons per household. non-family households (1,581 | 34.6%) represent the smallest median household size with 1.20 persons per household.
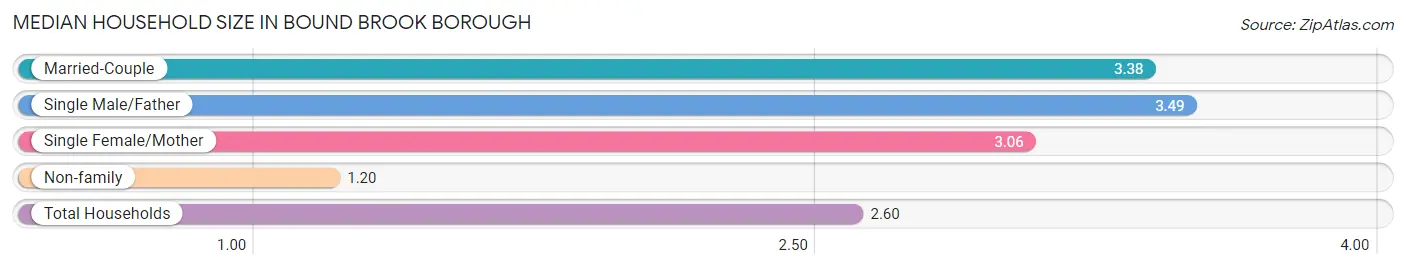
| Household Type | # Households | Household Size |
| Married-Couple | 1,936 (42.4%) | 3.38 |
| Single Male/Father | 468 (10.2%) | 3.49 |
| Single Female/Mother | 582 (12.7%) | 3.06 |
| Non-family | 1,581 (34.6%) | 1.20 |
| Total Households | 4,567 (100.0%) | 2.60 |
Household Size by Marriage Status in Bound Brook borough
Out of a total of 4,567 households in Bound Brook borough, 2,986 (65.4%) are family households, while 1,581 (34.6%) are nonfamily households. The most numerous type of family households are 2-person households, comprising 1,092, and the most common type of nonfamily households are 1-person households, comprising 1,321.
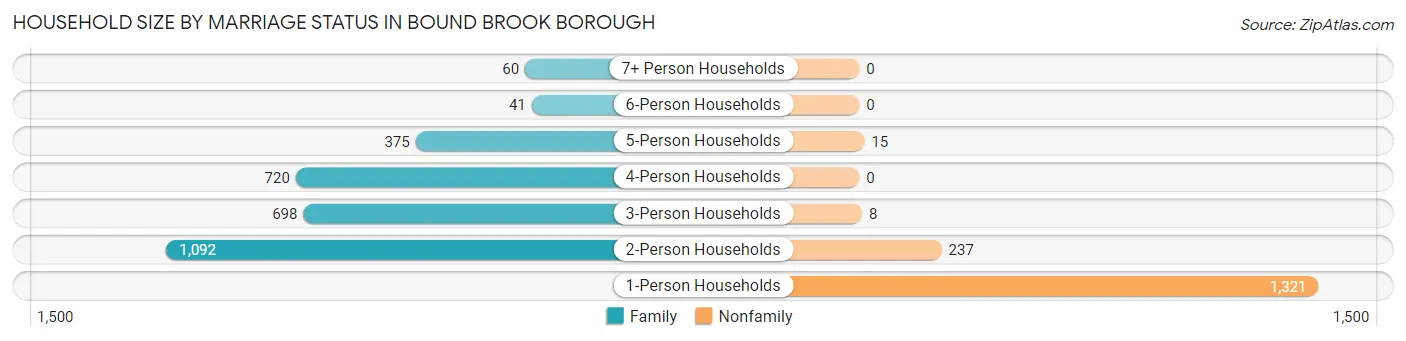
| Household Size | Family Households | Nonfamily Households |
| 1-Person Households | - | 1,321 (28.9%) |
| 2-Person Households | 1,092 (23.9%) | 237 (5.2%) |
| 3-Person Households | 698 (15.3%) | 8 (0.2%) |
| 4-Person Households | 720 (15.8%) | 0 (0.0%) |
| 5-Person Households | 375 (8.2%) | 15 (0.3%) |
| 6-Person Households | 41 (0.9%) | 0 (0.0%) |
| 7+ Person Households | 60 (1.3%) | 0 (0.0%) |
| Total | 2,986 (65.4%) | 1,581 (34.6%) |
Female Fertility in Bound Brook borough
Fertility by Age in Bound Brook borough
Average fertility rate in Bound Brook borough is 56.0 births per 1,000 women. Women in the age bracket of 20 to 34 years have the highest fertility rate with 70.0 births per 1,000 women. Women in the age bracket of 20 to 34 years acount for 58.3% of all women with births.
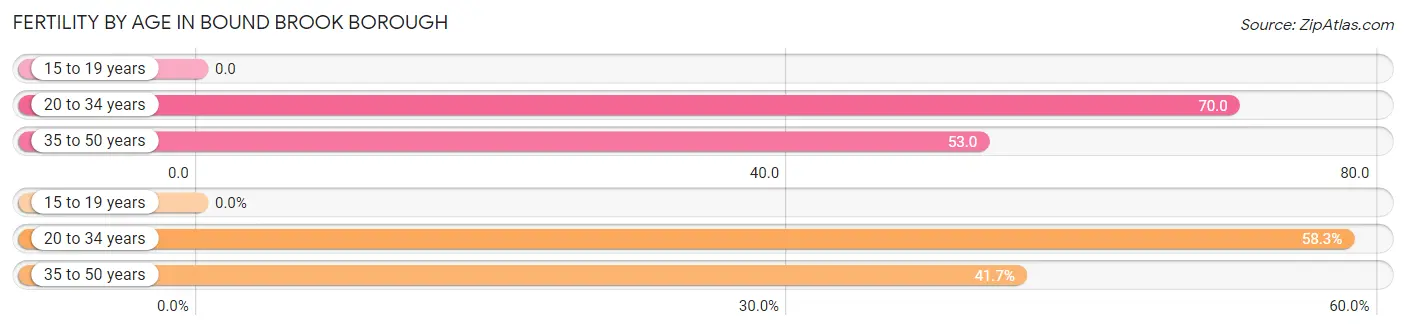
| Age Bracket | Women with Births | Births / 1,000 Women |
| 15 to 19 years | 0 (0.0%) | 0.0 |
| 20 to 34 years | 105 (58.3%) | 70.0 |
| 35 to 50 years | 75 (41.7%) | 53.0 |
| Total | 180 (100.0%) | 56.0 |
Fertility by Age by Marriage Status in Bound Brook borough
32.8% of women with births (180) in Bound Brook borough are married. The highest percentage of unmarried women with births falls into 20 to 34 years age bracket with 70.5% of them unmarried at the time of birth, while the lowest percentage of unmarried women with births belong to 35 to 50 years age bracket with 62.7% of them unmarried.
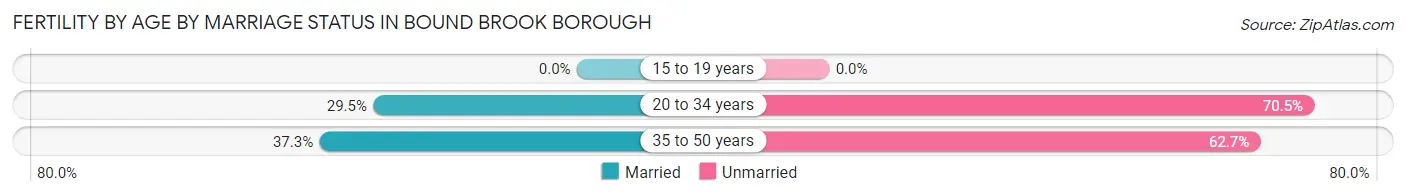
| Age Bracket | Married | Unmarried |
| 15 to 19 years | 0 (0.0%) | 0 (0.0%) |
| 20 to 34 years | 31 (29.5%) | 74 (70.5%) |
| 35 to 50 years | 28 (37.3%) | 47 (62.7%) |
| Total | 59 (32.8%) | 121 (67.2%) |
Fertility by Education in Bound Brook borough
Average fertility rate in Bound Brook borough is 56.0 births per 1,000 women. Women with the education attainment of high school diploma have the highest fertility rate of 89.0 births per 1,000 women, while women with the education attainment of bachelor's degree have the lowest fertility at 12.0 births per 1,000 women. Women with the education attainment of high school diploma represent 33.9% of all women with births.
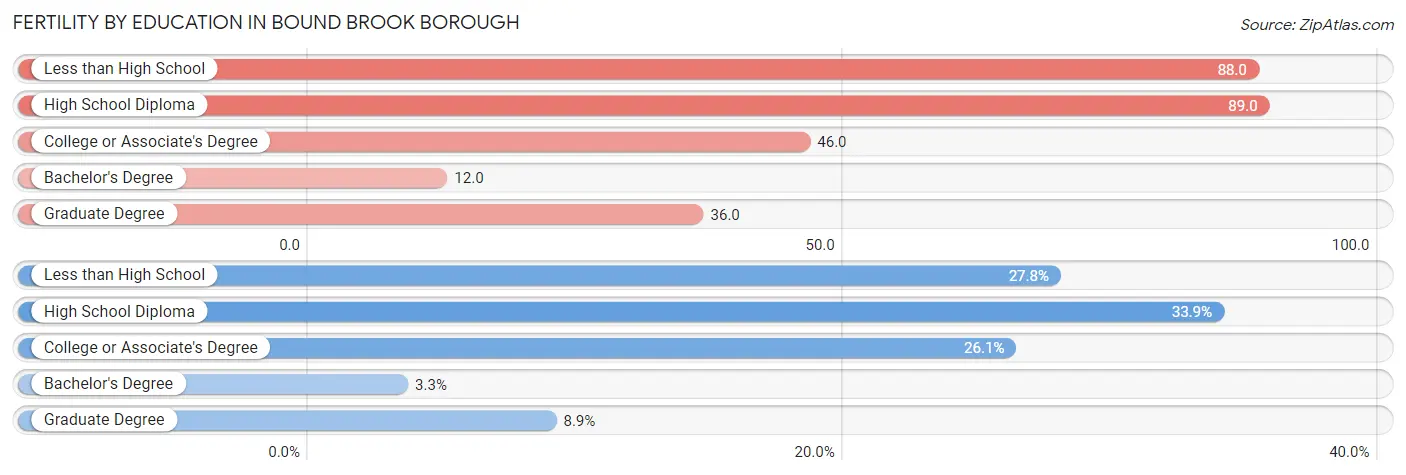
| Educational Attainment | Women with Births | Births / 1,000 Women |
| Less than High School | 50 (27.8%) | 88.0 |
| High School Diploma | 61 (33.9%) | 89.0 |
| College or Associate's Degree | 47 (26.1%) | 46.0 |
| Bachelor's Degree | 6 (3.3%) | 12.0 |
| Graduate Degree | 16 (8.9%) | 36.0 |
| Total | 180 (100.0%) | 56.0 |
Fertility by Education by Marriage Status in Bound Brook borough
67.2% of women with births in Bound Brook borough are unmarried. Women with the educational attainment of bachelor's degree are most likely to be married with 100.0% of them married at childbirth, while women with the educational attainment of less than high school are least likely to be married with 100.0% of them unmarried at childbirth.
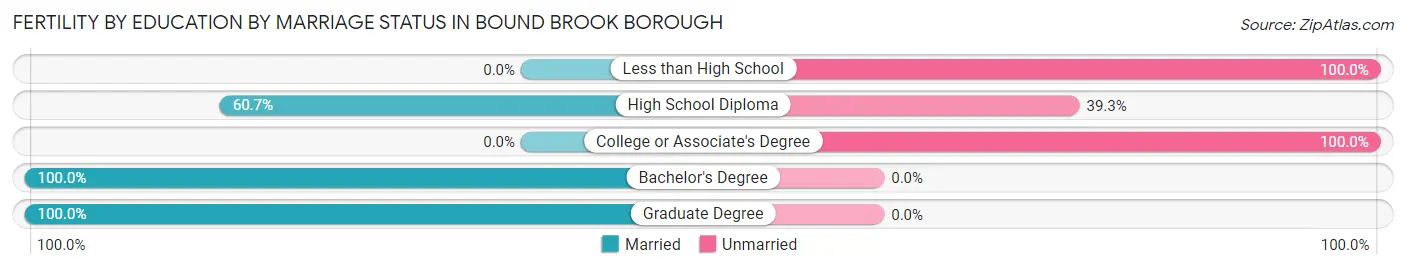
| Educational Attainment | Married | Unmarried |
| Less than High School | 0 (0.0%) | 50 (100.0%) |
| High School Diploma | 37 (60.7%) | 24 (39.3%) |
| College or Associate's Degree | 0 (0.0%) | 47 (100.0%) |
| Bachelor's Degree | 6 (100.0%) | 0 (0.0%) |
| Graduate Degree | 16 (100.0%) | 0 (0.0%) |
| Total | 59 (32.8%) | 121 (67.2%) |
Employment Characteristics in Bound Brook borough
Employment by Class of Employer in Bound Brook borough
Among the 6,402 employed individuals in Bound Brook borough, private company employees (5,003 | 78.1%), not-for-profit organizations (401 | 6.3%), and self-employed (not incorporated) (324 | 5.1%) make up the most common classes of employment.
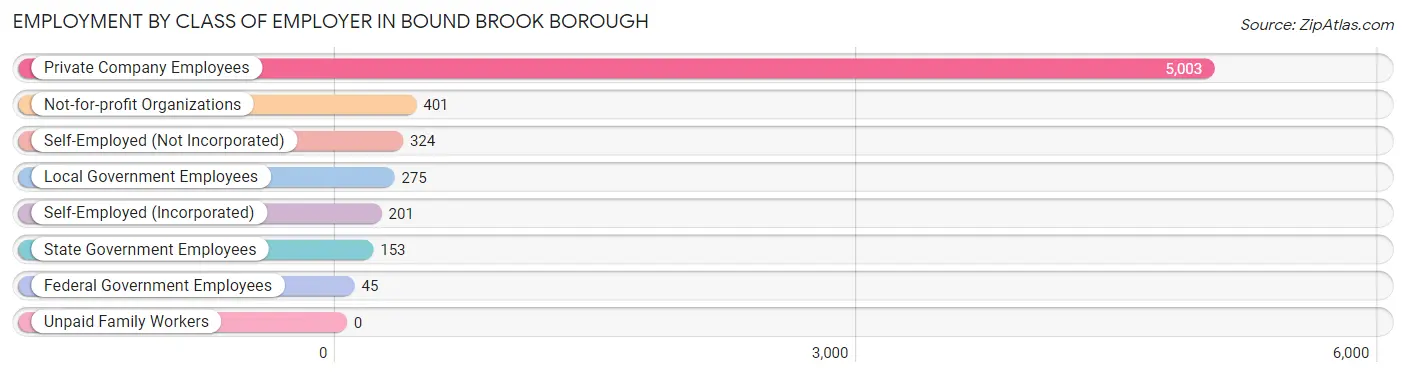
| Employer Class | # Employees | % Employees |
| Private Company Employees | 5,003 | 78.1% |
| Self-Employed (Incorporated) | 201 | 3.1% |
| Self-Employed (Not Incorporated) | 324 | 5.1% |
| Not-for-profit Organizations | 401 | 6.3% |
| Local Government Employees | 275 | 4.3% |
| State Government Employees | 153 | 2.4% |
| Federal Government Employees | 45 | 0.7% |
| Unpaid Family Workers | 0 | 0.0% |
| Total | 6,402 | 100.0% |
Employment Status by Age in Bound Brook borough
According to the labor force statistics for Bound Brook borough, out of the total population over 16 years of age (9,520), 74.5% or 7,092 individuals are in the labor force, with 6.6% or 468 of them unemployed. The age group with the highest labor force participation rate is 25 to 29 years, with 94.3% or 1,099 individuals in the labor force. Within the labor force, the 20 to 24 years age range has the highest percentage of unemployed individuals, with 12.0% or 60 of them being unemployed.
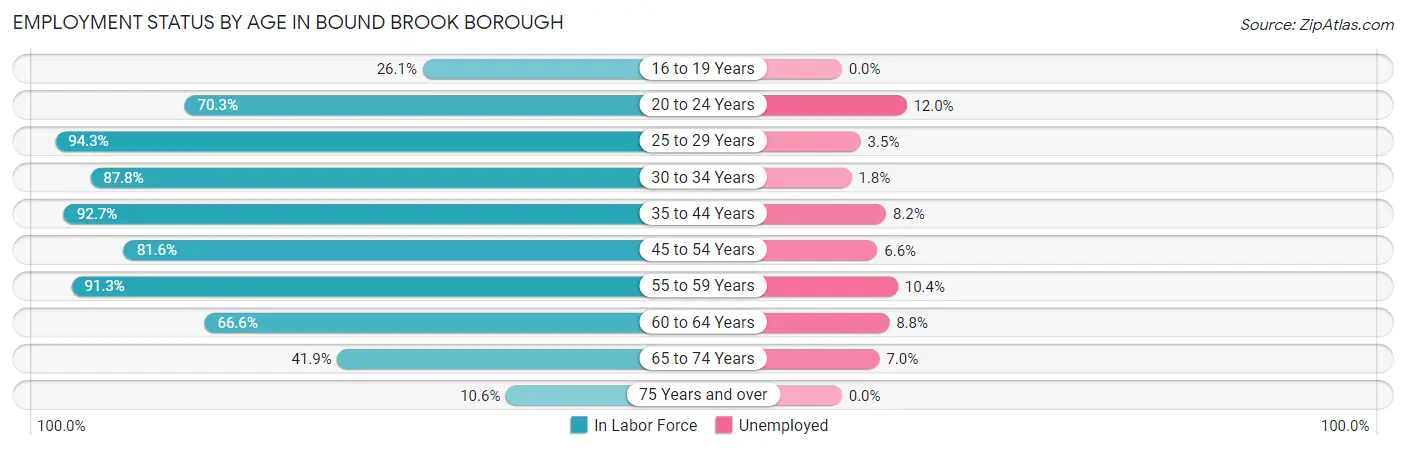
| Age Bracket | In Labor Force | Unemployed |
| 16 to 19 Years | 103 (26.1%) | 0 (0.0%) |
| 20 to 24 Years | 502 (70.3%) | 60 (12.0%) |
| 25 to 29 Years | 1,099 (94.3%) | 38 (3.5%) |
| 30 to 34 Years | 901 (87.8%) | 16 (1.8%) |
| 35 to 44 Years | 1,851 (92.7%) | 152 (8.2%) |
| 45 to 54 Years | 1,250 (81.6%) | 82 (6.6%) |
| 55 to 59 Years | 627 (91.3%) | 65 (10.4%) |
| 60 to 64 Years | 319 (66.6%) | 28 (8.8%) |
| 65 to 74 Years | 373 (41.9%) | 26 (7.0%) |
| 75 Years and over | 67 (10.6%) | 0 (0.0%) |
| Total | 7,092 (74.5%) | 468 (6.6%) |
Employment Status by Educational Attainment in Bound Brook borough
According to labor force statistics for Bound Brook borough, 87.8% of individuals (6,046) out of the total population between 25 and 64 years of age (6,886) are in the labor force, with 6.3% or 381 of them being unemployed. The group with the highest labor force participation rate are those with the educational attainment of bachelor's degree or higher, with 91.8% or 2,020 individuals in the labor force. Within the labor force, individuals with high school diploma education have the highest percentage of unemployment, with 11.3% or 182 of them being unemployed.
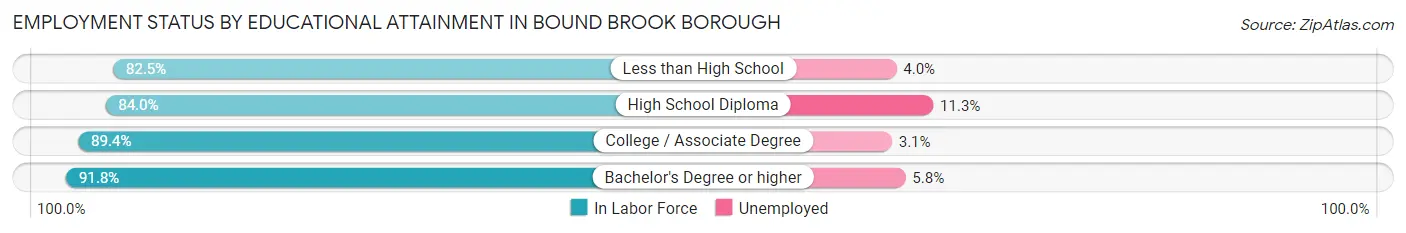
| Educational Attainment | In Labor Force | Unemployed |
| Less than High School | 700 (82.5%) | 34 (4.0%) |
| High School Diploma | 1,609 (84.0%) | 217 (11.3%) |
| College / Associate Degree | 1,718 (89.4%) | 60 (3.1%) |
| Bachelor's Degree or higher | 2,020 (91.8%) | 128 (5.8%) |
| Total | 6,046 (87.8%) | 434 (6.3%) |
Employment Occupations by Sex in Bound Brook borough
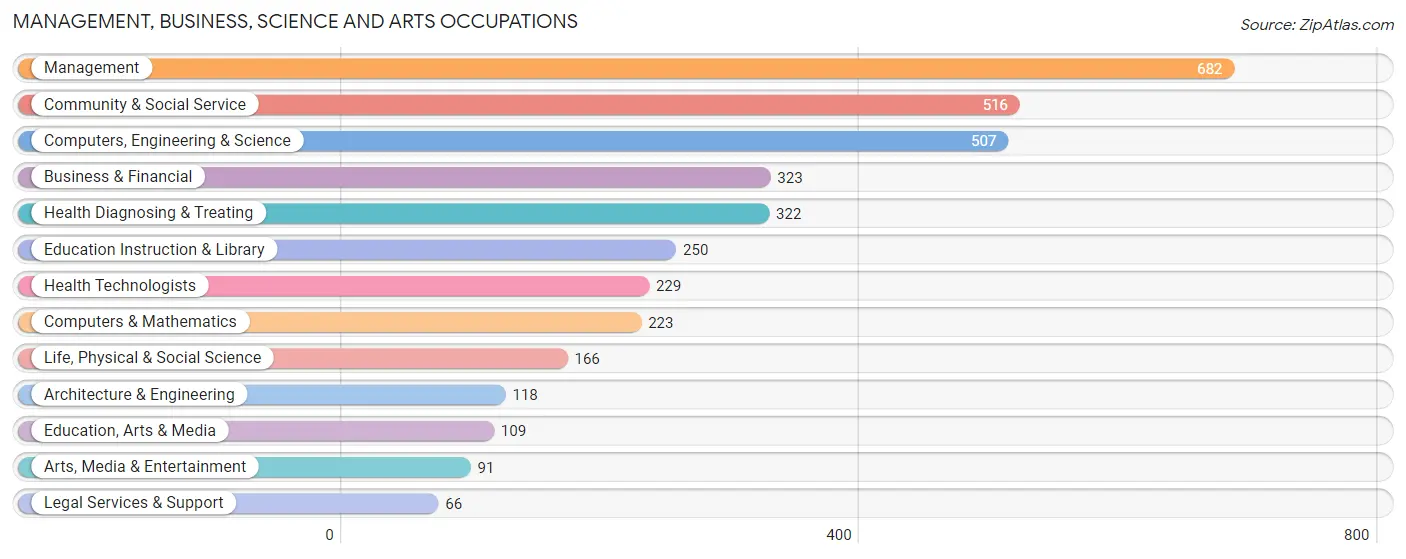
Management, Business, Science and Arts Occupations
The most common Management, Business, Science and Arts occupations in Bound Brook borough are Management (682 | 10.3%), Community & Social Service (516 | 7.8%), Computers, Engineering & Science (507 | 7.6%), Business & Financial (323 | 4.9%), and Health Diagnosing & Treating (322 | 4.9%).
Management, Business, Science and Arts Occupations by Sex
Within the Management, Business, Science and Arts occupations in Bound Brook borough, the most male-oriented occupations are Architecture & Engineering (86.4%), Computers, Engineering & Science (77.1%), and Computers & Mathematics (76.2%), while the most female-oriented occupations are Education Instruction & Library (93.6%), Health Technologists (86.5%), and Health Diagnosing & Treating (84.8%).
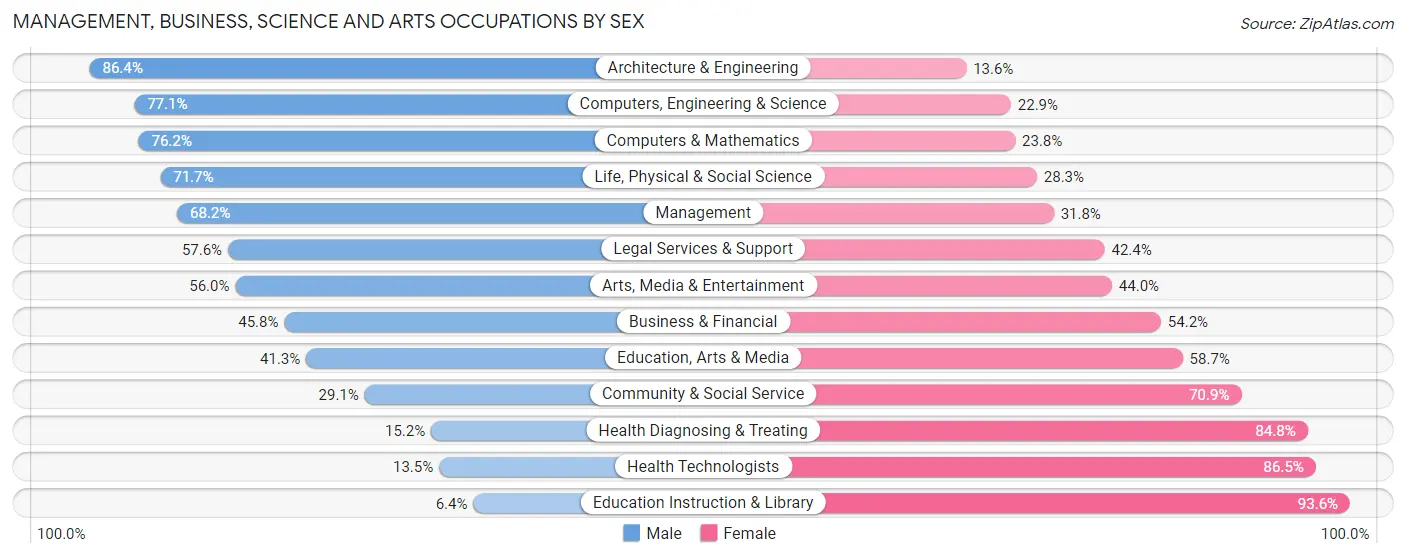
| Occupation | Male | Female |
| Management | 465 (68.2%) | 217 (31.8%) |
| Business & Financial | 148 (45.8%) | 175 (54.2%) |
| Computers, Engineering & Science | 391 (77.1%) | 116 (22.9%) |
| Computers & Mathematics | 170 (76.2%) | 53 (23.8%) |
| Architecture & Engineering | 102 (86.4%) | 16 (13.6%) |
| Life, Physical & Social Science | 119 (71.7%) | 47 (28.3%) |
| Community & Social Service | 150 (29.1%) | 366 (70.9%) |
| Education, Arts & Media | 45 (41.3%) | 64 (58.7%) |
| Legal Services & Support | 38 (57.6%) | 28 (42.4%) |
| Education Instruction & Library | 16 (6.4%) | 234 (93.6%) |
| Arts, Media & Entertainment | 51 (56.0%) | 40 (44.0%) |
| Health Diagnosing & Treating | 49 (15.2%) | 273 (84.8%) |
| Health Technologists | 31 (13.5%) | 198 (86.5%) |
| Total (Category) | 1,203 (51.2%) | 1,147 (48.8%) |
| Total (Overall) | 3,547 (53.5%) | 3,077 (46.5%) |
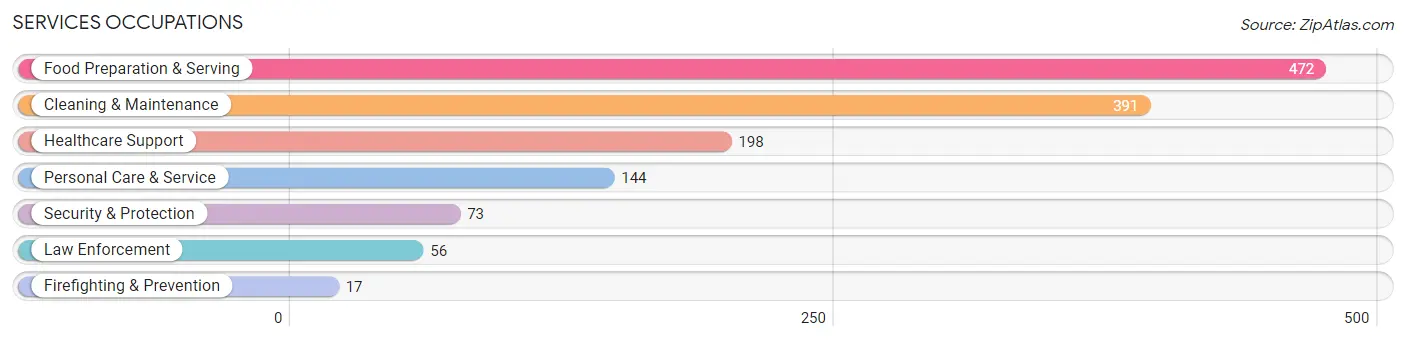
Services Occupations
The most common Services occupations in Bound Brook borough are Food Preparation & Serving (472 | 7.1%), Cleaning & Maintenance (391 | 5.9%), Healthcare Support (198 | 3.0%), Personal Care & Service (144 | 2.2%), and Security & Protection (73 | 1.1%).
Services Occupations by Sex
Within the Services occupations in Bound Brook borough, the most male-oriented occupations are Firefighting & Prevention (100.0%), Security & Protection (76.7%), and Law Enforcement (69.6%), while the most female-oriented occupations are Healthcare Support (86.9%), Personal Care & Service (79.9%), and Cleaning & Maintenance (72.9%).
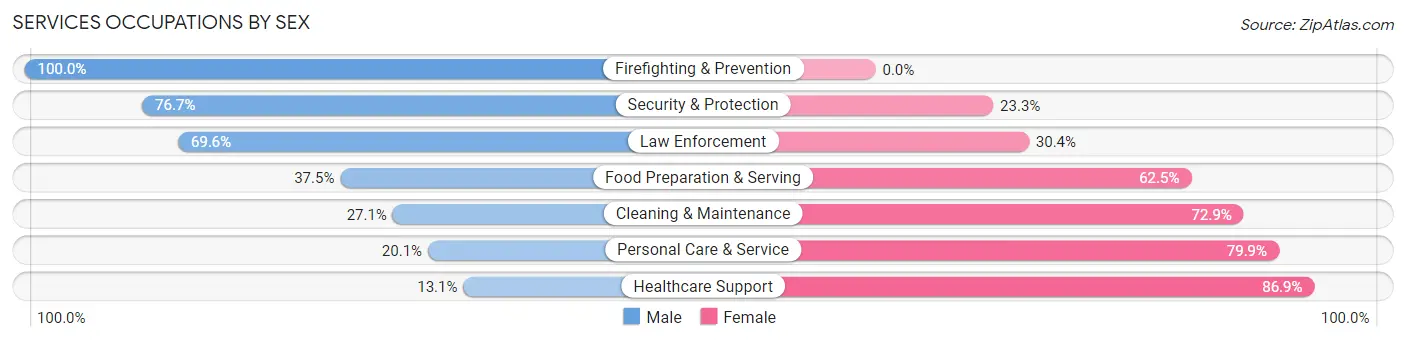
| Occupation | Male | Female |
| Healthcare Support | 26 (13.1%) | 172 (86.9%) |
| Security & Protection | 56 (76.7%) | 17 (23.3%) |
| Firefighting & Prevention | 17 (100.0%) | 0 (0.0%) |
| Law Enforcement | 39 (69.6%) | 17 (30.4%) |
| Food Preparation & Serving | 177 (37.5%) | 295 (62.5%) |
| Cleaning & Maintenance | 106 (27.1%) | 285 (72.9%) |
| Personal Care & Service | 29 (20.1%) | 115 (79.9%) |
| Total (Category) | 394 (30.8%) | 884 (69.2%) |
| Total (Overall) | 3,547 (53.5%) | 3,077 (46.5%) |
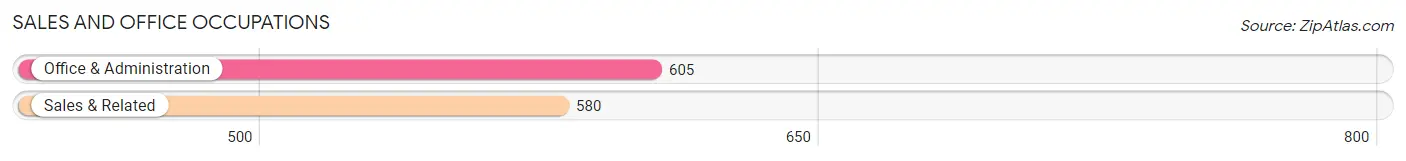
Sales and Office Occupations
The most common Sales and Office occupations in Bound Brook borough are Office & Administration (605 | 9.1%), and Sales & Related (580 | 8.8%).
Sales and Office Occupations by Sex
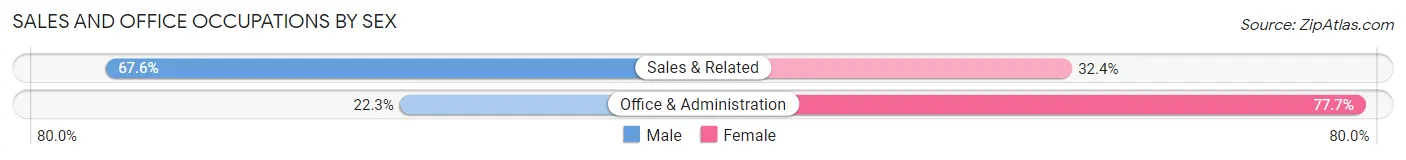
| Occupation | Male | Female |
| Sales & Related | 392 (67.6%) | 188 (32.4%) |
| Office & Administration | 135 (22.3%) | 470 (77.7%) |
| Total (Category) | 527 (44.5%) | 658 (55.5%) |
| Total (Overall) | 3,547 (53.5%) | 3,077 (46.5%) |
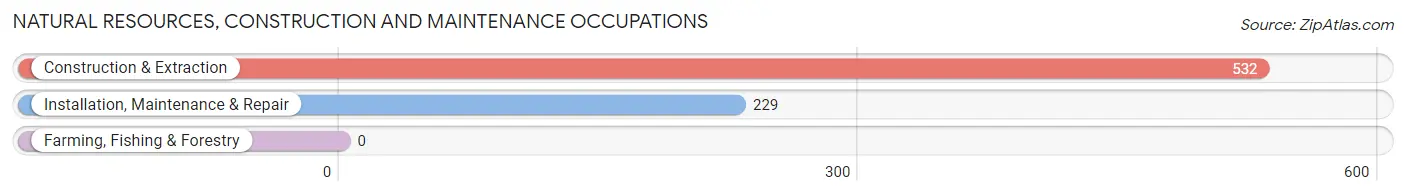
Natural Resources, Construction and Maintenance Occupations
The most common Natural Resources, Construction and Maintenance occupations in Bound Brook borough are Construction & Extraction (532 | 8.0%), and Installation, Maintenance & Repair (229 | 3.5%).
Natural Resources, Construction and Maintenance Occupations by Sex
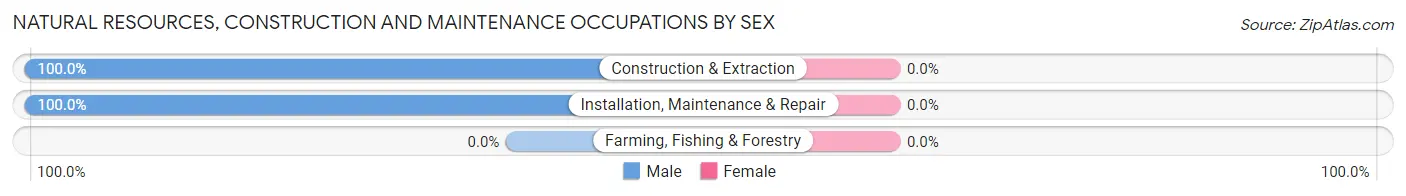
| Occupation | Male | Female |
| Farming, Fishing & Forestry | 0 (0.0%) | 0 (0.0%) |
| Construction & Extraction | 532 (100.0%) | 0 (0.0%) |
| Installation, Maintenance & Repair | 229 (100.0%) | 0 (0.0%) |
| Total (Category) | 761 (100.0%) | 0 (0.0%) |
| Total (Overall) | 3,547 (53.5%) | 3,077 (46.5%) |
Production, Transportation and Moving Occupations
The most common Production, Transportation and Moving occupations in Bound Brook borough are Production (470 | 7.1%), Material Moving (397 | 6.0%), and Transportation (183 | 2.8%).
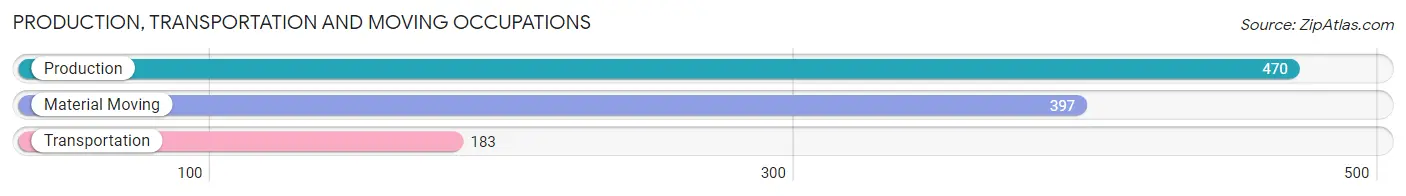
Production, Transportation and Moving Occupations by Sex
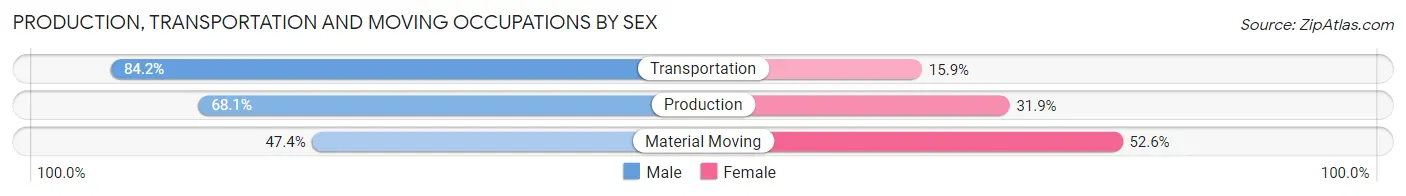
| Occupation | Male | Female |
| Production | 320 (68.1%) | 150 (31.9%) |
| Transportation | 154 (84.2%) | 29 (15.9%) |
| Material Moving | 188 (47.4%) | 209 (52.6%) |
| Total (Category) | 662 (63.0%) | 388 (36.9%) |
| Total (Overall) | 3,547 (53.5%) | 3,077 (46.5%) |
Employment Industries by Sex in Bound Brook borough
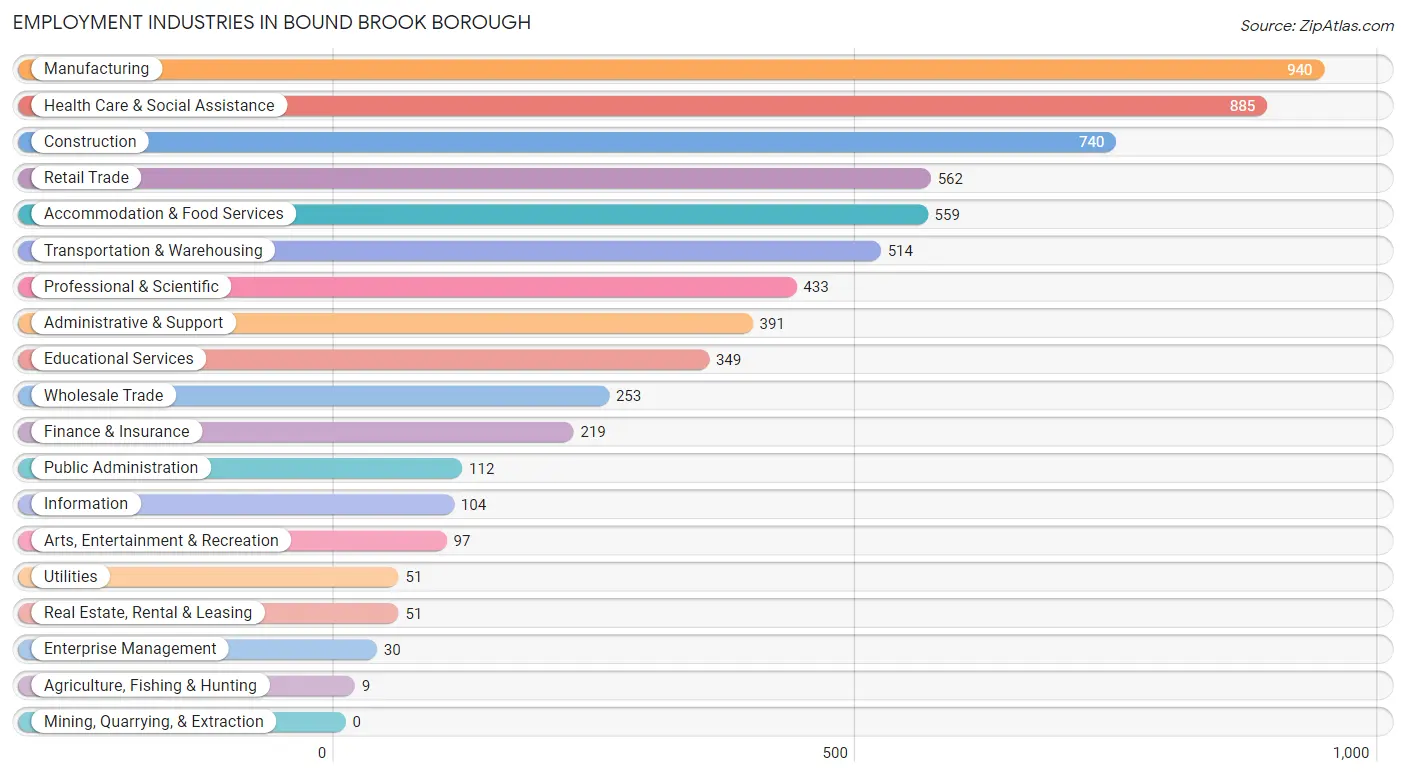
Employment Industries in Bound Brook borough
The major employment industries in Bound Brook borough include Manufacturing (940 | 14.2%), Health Care & Social Assistance (885 | 13.4%), Construction (740 | 11.2%), Retail Trade (562 | 8.5%), and Accommodation & Food Services (559 | 8.4%).
Employment Industries by Sex in Bound Brook borough
The Bound Brook borough industries that see more men than women are Agriculture, Fishing & Hunting (100.0%), Utilities (100.0%), and Construction (99.7%), whereas the industries that tend to have a higher number of women are Health Care & Social Assistance (85.0%), Arts, Entertainment & Recreation (82.5%), and Real Estate, Rental & Leasing (74.5%).
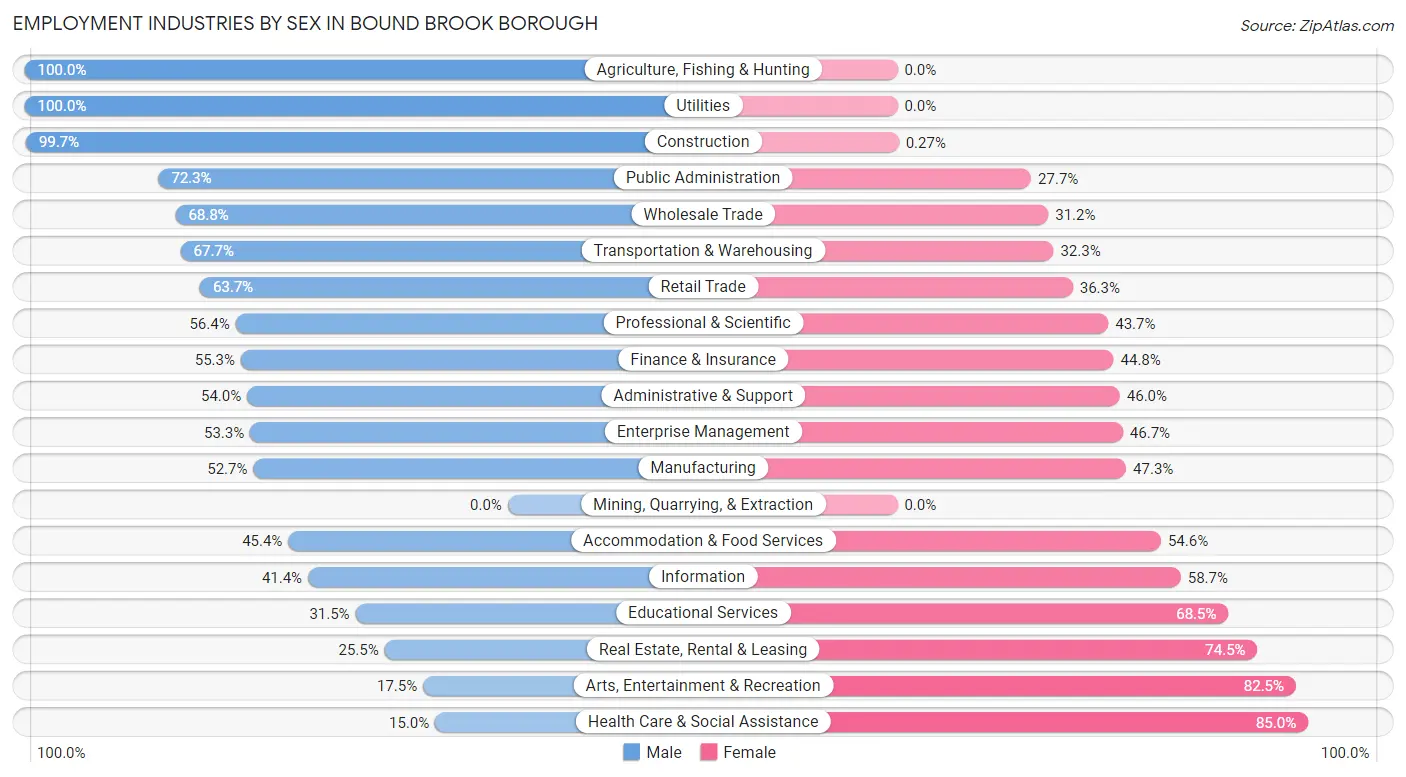
| Industry | Male | Female |
| Agriculture, Fishing & Hunting | 9 (100.0%) | 0 (0.0%) |
| Mining, Quarrying, & Extraction | 0 (0.0%) | 0 (0.0%) |
| Construction | 738 (99.7%) | 2 (0.3%) |
| Manufacturing | 495 (52.7%) | 445 (47.3%) |
| Wholesale Trade | 174 (68.8%) | 79 (31.2%) |
| Retail Trade | 358 (63.7%) | 204 (36.3%) |
| Transportation & Warehousing | 348 (67.7%) | 166 (32.3%) |
| Utilities | 51 (100.0%) | 0 (0.0%) |
| Information | 43 (41.3%) | 61 (58.7%) |
| Finance & Insurance | 121 (55.2%) | 98 (44.8%) |
| Real Estate, Rental & Leasing | 13 (25.5%) | 38 (74.5%) |
| Professional & Scientific | 244 (56.4%) | 189 (43.6%) |
| Enterprise Management | 16 (53.3%) | 14 (46.7%) |
| Administrative & Support | 211 (54.0%) | 180 (46.0%) |
| Educational Services | 110 (31.5%) | 239 (68.5%) |
| Health Care & Social Assistance | 133 (15.0%) | 752 (85.0%) |
| Arts, Entertainment & Recreation | 17 (17.5%) | 80 (82.5%) |
| Accommodation & Food Services | 254 (45.4%) | 305 (54.6%) |
| Public Administration | 81 (72.3%) | 31 (27.7%) |
| Total | 3,547 (53.5%) | 3,077 (46.5%) |
Education in Bound Brook borough
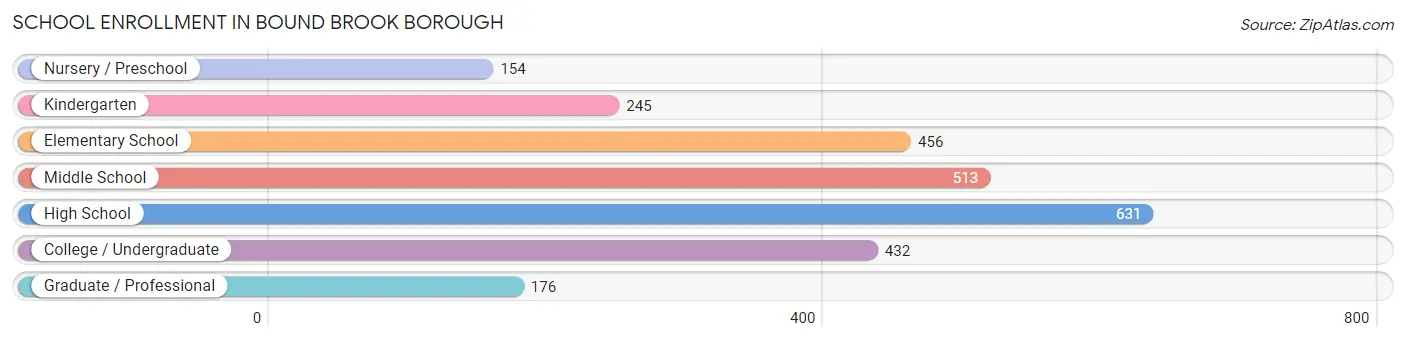
School Enrollment in Bound Brook borough
The most common levels of schooling among the 2,607 students in Bound Brook borough are high school (631 | 24.2%), middle school (513 | 19.7%), and elementary school (456 | 17.5%).
| School Level | # Students | % Students |
| Nursery / Preschool | 154 | 5.9% |
| Kindergarten | 245 | 9.4% |
| Elementary School | 456 | 17.5% |
| Middle School | 513 | 19.7% |
| High School | 631 | 24.2% |
| College / Undergraduate | 432 | 16.6% |
| Graduate / Professional | 176 | 6.8% |
| Total | 2,607 | 100.0% |
School Enrollment by Age by Funding Source in Bound Brook borough
Out of a total of 2,607 students who are enrolled in schools in Bound Brook borough, 177 (6.8%) attend a private institution, while the remaining 2,430 (93.2%) are enrolled in public schools. The age group of 20 to 24 year olds has the highest likelihood of being enrolled in private schools, with 37 (16.5% in the age bracket) enrolled. Conversely, the age group of 3 to 4 year olds has the lowest likelihood of being enrolled in a private school, with 140 (100.0% in the age bracket) attending a public institution.
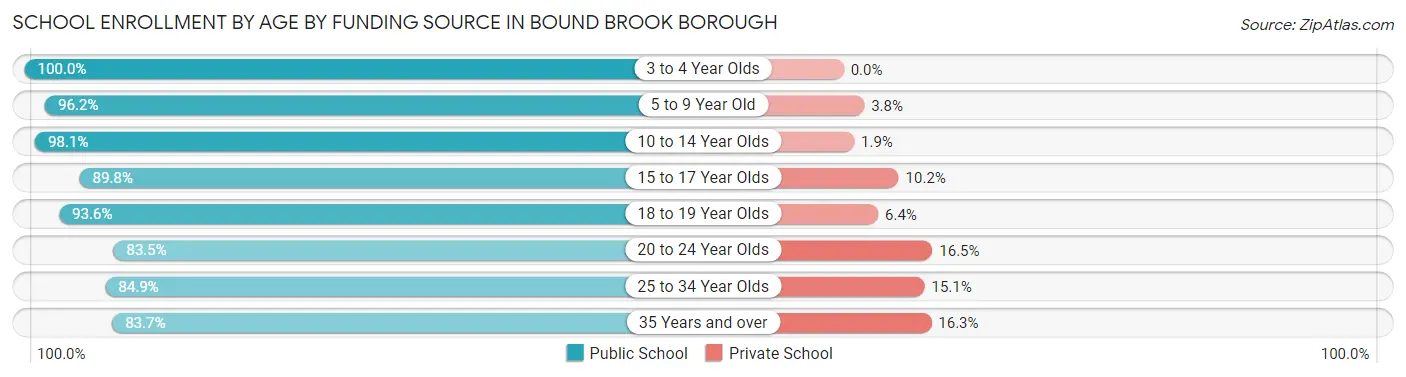
| Age Bracket | Public School | Private School |
| 3 to 4 Year Olds | 140 (100.0%) | 0 (0.0%) |
| 5 to 9 Year Old | 653 (96.2%) | 26 (3.8%) |
| 10 to 14 Year Olds | 656 (98.1%) | 13 (1.9%) |
| 15 to 17 Year Olds | 333 (89.8%) | 38 (10.2%) |
| 18 to 19 Year Olds | 175 (93.6%) | 12 (6.4%) |
| 20 to 24 Year Olds | 187 (83.5%) | 37 (16.5%) |
| 25 to 34 Year Olds | 203 (84.9%) | 36 (15.1%) |
| 35 Years and over | 82 (83.7%) | 16 (16.3%) |
| Total | 2,430 (93.2%) | 177 (6.8%) |
Educational Attainment by Field of Study in Bound Brook borough
Business (697 | 25.7%), engineering (260 | 9.6%), computers & mathematics (209 | 7.7%), social sciences (199 | 7.3%), and arts & humanities (196 | 7.2%) are the most common fields of study among 2,716 individuals in Bound Brook borough who have obtained a bachelor's degree or higher.
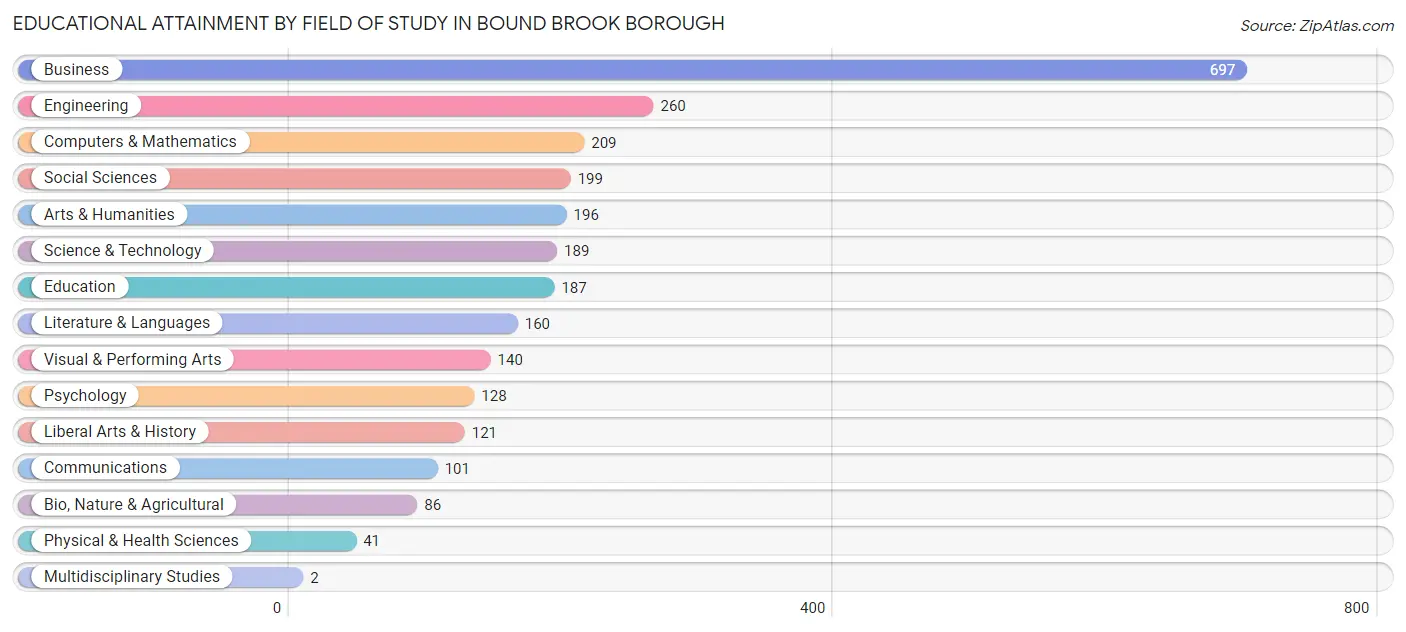
| Field of Study | # Graduates | % Graduates |
| Computers & Mathematics | 209 | 7.7% |
| Bio, Nature & Agricultural | 86 | 3.2% |
| Physical & Health Sciences | 41 | 1.5% |
| Psychology | 128 | 4.7% |
| Social Sciences | 199 | 7.3% |
| Engineering | 260 | 9.6% |
| Multidisciplinary Studies | 2 | 0.1% |
| Science & Technology | 189 | 7.0% |
| Business | 697 | 25.7% |
| Education | 187 | 6.9% |
| Literature & Languages | 160 | 5.9% |
| Liberal Arts & History | 121 | 4.5% |
| Visual & Performing Arts | 140 | 5.1% |
| Communications | 101 | 3.7% |
| Arts & Humanities | 196 | 7.2% |
| Total | 2,716 | 100.0% |
Transportation & Commute in Bound Brook borough
Vehicle Availability by Sex in Bound Brook borough
The most prevalent vehicle ownership categories in Bound Brook borough are males with 2 vehicles (1,188, accounting for 34.6%) and females with 2 vehicles (1,094, making up 40.0%).
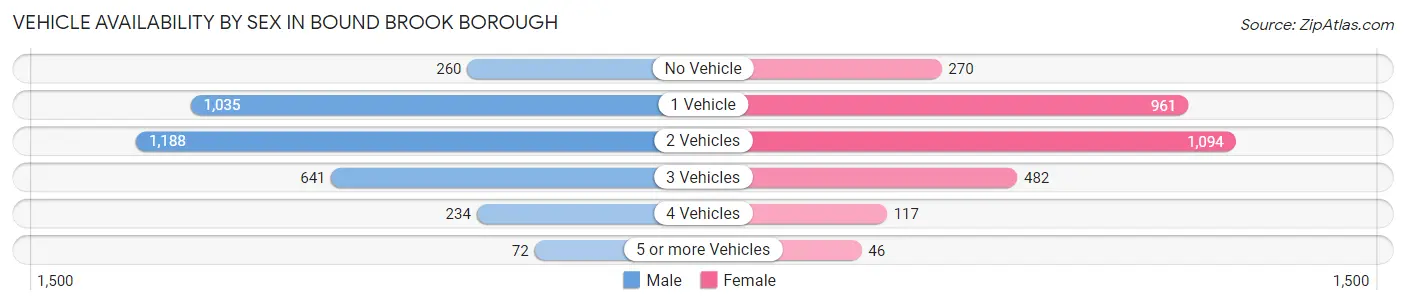
| Vehicles Available | Male | Female |
| No Vehicle | 260 (7.6%) | 270 (9.1%) |
| 1 Vehicle | 1,035 (30.2%) | 961 (32.4%) |
| 2 Vehicles | 1,188 (34.6%) | 1,094 (36.8%) |
| 3 Vehicles | 641 (18.7%) | 482 (16.2%) |
| 4 Vehicles | 234 (6.8%) | 117 (3.9%) |
| 5 or more Vehicles | 72 (2.1%) | 46 (1.5%) |
| Total | 3,430 (100.0%) | 2,970 (100.0%) |
Commute Time in Bound Brook borough
The most frequently occuring commute durations in Bound Brook borough are 15 to 19 minutes (1,450 commuters, 24.5%), 10 to 14 minutes (1,010 commuters, 17.1%), and 20 to 24 minutes (775 commuters, 13.1%).
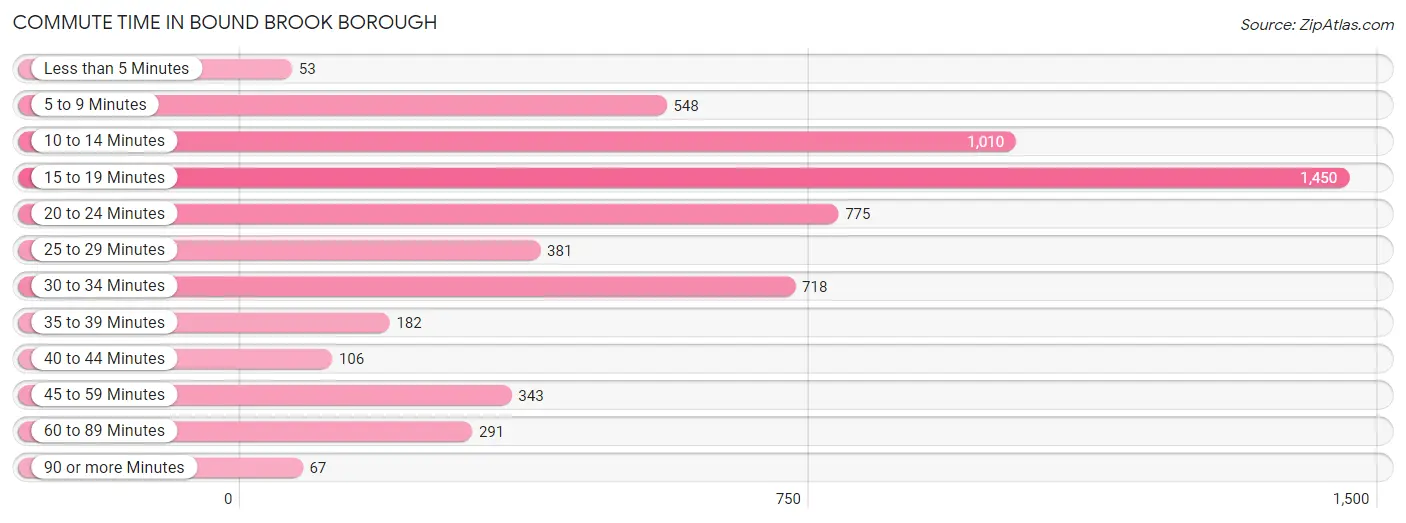
| Commute Time | # Commuters | % Commuters |
| Less than 5 Minutes | 53 | 0.9% |
| 5 to 9 Minutes | 548 | 9.2% |
| 10 to 14 Minutes | 1,010 | 17.1% |
| 15 to 19 Minutes | 1,450 | 24.5% |
| 20 to 24 Minutes | 775 | 13.1% |
| 25 to 29 Minutes | 381 | 6.4% |
| 30 to 34 Minutes | 718 | 12.1% |
| 35 to 39 Minutes | 182 | 3.1% |
| 40 to 44 Minutes | 106 | 1.8% |
| 45 to 59 Minutes | 343 | 5.8% |
| 60 to 89 Minutes | 291 | 4.9% |
| 90 or more Minutes | 67 | 1.1% |
Commute Time by Sex in Bound Brook borough
The most common commute times in Bound Brook borough are 15 to 19 minutes (697 commuters, 22.2%) for males and 15 to 19 minutes (753 commuters, 27.1%) for females.
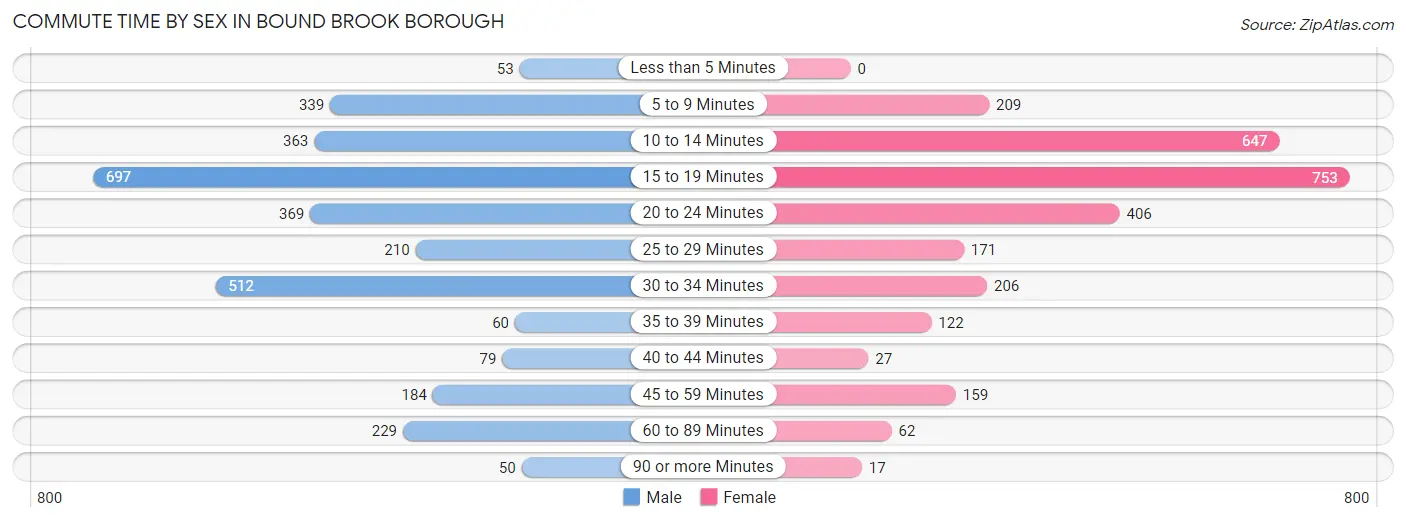
| Commute Time | Male | Female |
| Less than 5 Minutes | 53 (1.7%) | 0 (0.0%) |
| 5 to 9 Minutes | 339 (10.8%) | 209 (7.5%) |
| 10 to 14 Minutes | 363 (11.5%) | 647 (23.3%) |
| 15 to 19 Minutes | 697 (22.2%) | 753 (27.1%) |
| 20 to 24 Minutes | 369 (11.7%) | 406 (14.6%) |
| 25 to 29 Minutes | 210 (6.7%) | 171 (6.1%) |
| 30 to 34 Minutes | 512 (16.3%) | 206 (7.4%) |
| 35 to 39 Minutes | 60 (1.9%) | 122 (4.4%) |
| 40 to 44 Minutes | 79 (2.5%) | 27 (1.0%) |
| 45 to 59 Minutes | 184 (5.9%) | 159 (5.7%) |
| 60 to 89 Minutes | 229 (7.3%) | 62 (2.2%) |
| 90 or more Minutes | 50 (1.6%) | 17 (0.6%) |
Time of Departure to Work by Sex in Bound Brook borough
The most frequent times of departure to work in Bound Brook borough are 7:00 AM to 7:29 AM (518, 16.5%) for males and 7:30 AM to 7:59 AM (476, 17.1%) for females.
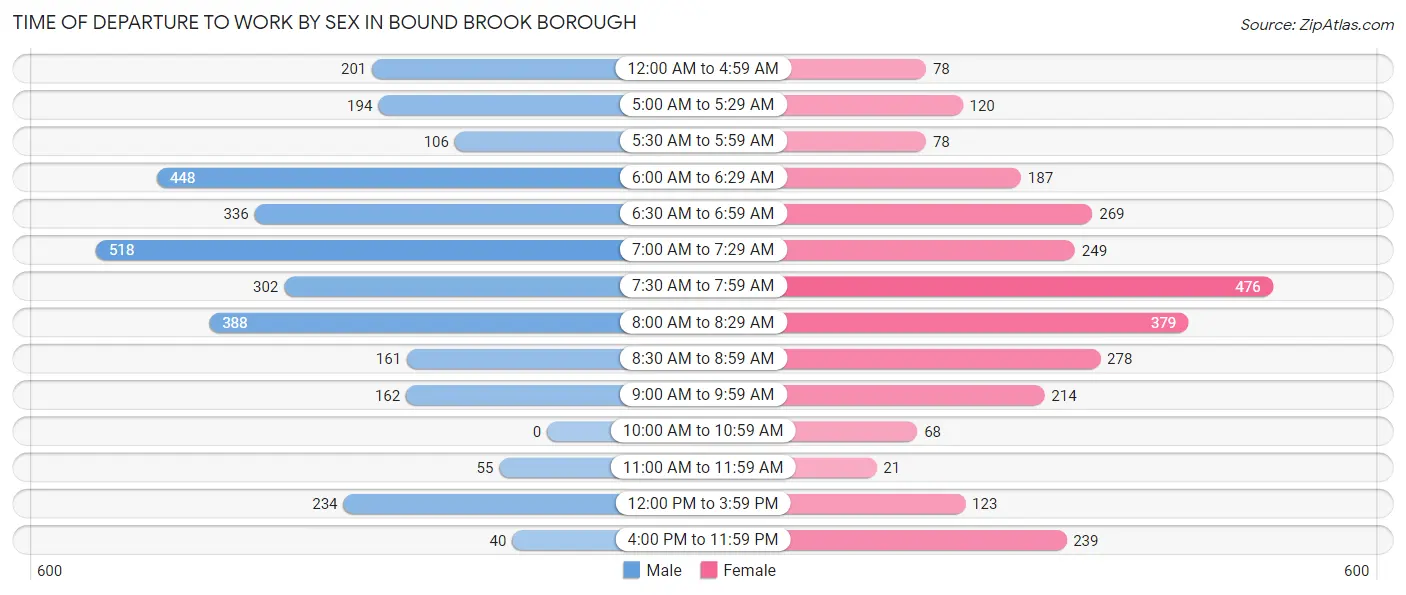
| Time of Departure | Male | Female |
| 12:00 AM to 4:59 AM | 201 (6.4%) | 78 (2.8%) |
| 5:00 AM to 5:29 AM | 194 (6.2%) | 120 (4.3%) |
| 5:30 AM to 5:59 AM | 106 (3.4%) | 78 (2.8%) |
| 6:00 AM to 6:29 AM | 448 (14.2%) | 187 (6.7%) |
| 6:30 AM to 6:59 AM | 336 (10.7%) | 269 (9.7%) |
| 7:00 AM to 7:29 AM | 518 (16.5%) | 249 (9.0%) |
| 7:30 AM to 7:59 AM | 302 (9.6%) | 476 (17.1%) |
| 8:00 AM to 8:29 AM | 388 (12.3%) | 379 (13.6%) |
| 8:30 AM to 8:59 AM | 161 (5.1%) | 278 (10.0%) |
| 9:00 AM to 9:59 AM | 162 (5.1%) | 214 (7.7%) |
| 10:00 AM to 10:59 AM | 0 (0.0%) | 68 (2.5%) |
| 11:00 AM to 11:59 AM | 55 (1.8%) | 21 (0.8%) |
| 12:00 PM to 3:59 PM | 234 (7.4%) | 123 (4.4%) |
| 4:00 PM to 11:59 PM | 40 (1.3%) | 239 (8.6%) |
| Total | 3,145 (100.0%) | 2,779 (100.0%) |
Housing Occupancy in Bound Brook borough
Occupancy by Ownership in Bound Brook borough
Of the total 4,567 dwellings in Bound Brook borough, owner-occupied units account for 2,039 (44.7%), while renter-occupied units make up 2,528 (55.3%).
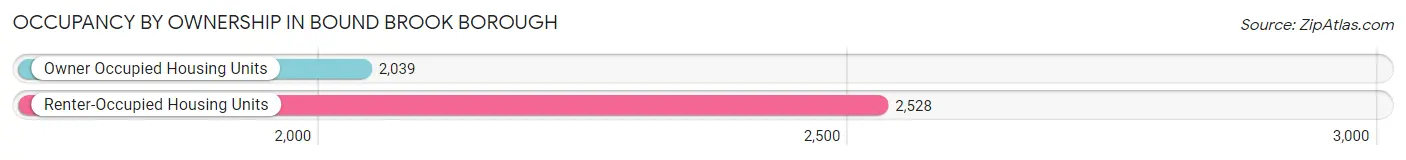
| Occupancy | # Housing Units | % Housing Units |
| Owner Occupied Housing Units | 2,039 | 44.7% |
| Renter-Occupied Housing Units | 2,528 | 55.3% |
| Total Occupied Housing Units | 4,567 | 100.0% |
Occupancy by Household Size in Bound Brook borough
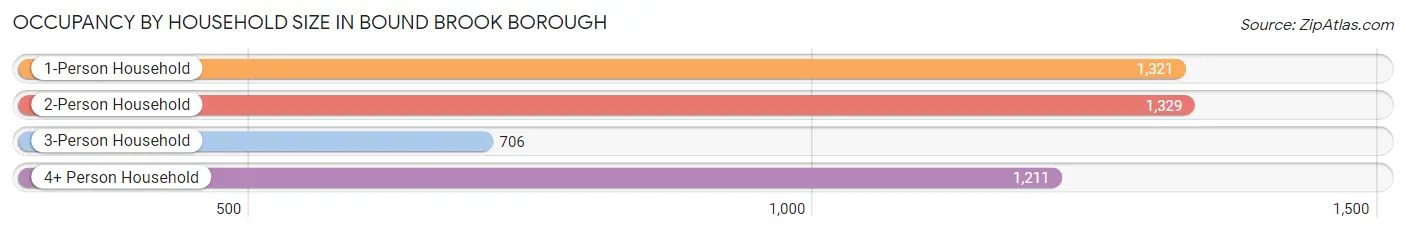
| Household Size | # Housing Units | % Housing Units |
| 1-Person Household | 1,321 | 28.9% |
| 2-Person Household | 1,329 | 29.1% |
| 3-Person Household | 706 | 15.5% |
| 4+ Person Household | 1,211 | 26.5% |
| Total Housing Units | 4,567 | 100.0% |
Occupancy by Ownership by Household Size in Bound Brook borough
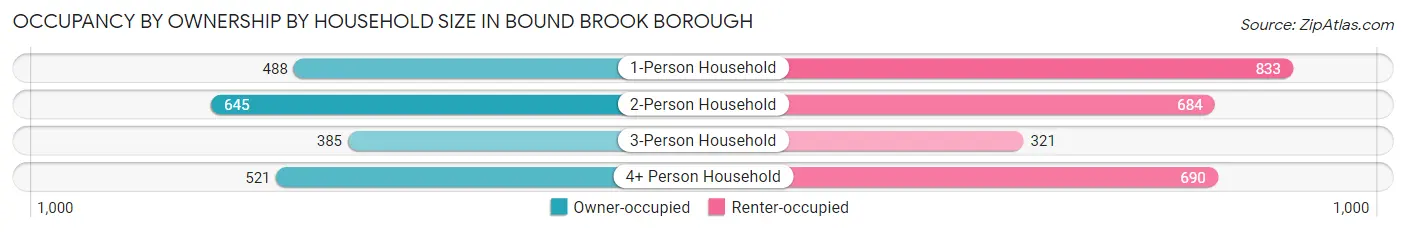
| Household Size | Owner-occupied | Renter-occupied |
| 1-Person Household | 488 (36.9%) | 833 (63.1%) |
| 2-Person Household | 645 (48.5%) | 684 (51.5%) |
| 3-Person Household | 385 (54.5%) | 321 (45.5%) |
| 4+ Person Household | 521 (43.0%) | 690 (57.0%) |
| Total Housing Units | 2,039 (44.7%) | 2,528 (55.3%) |
Occupancy by Educational Attainment in Bound Brook borough
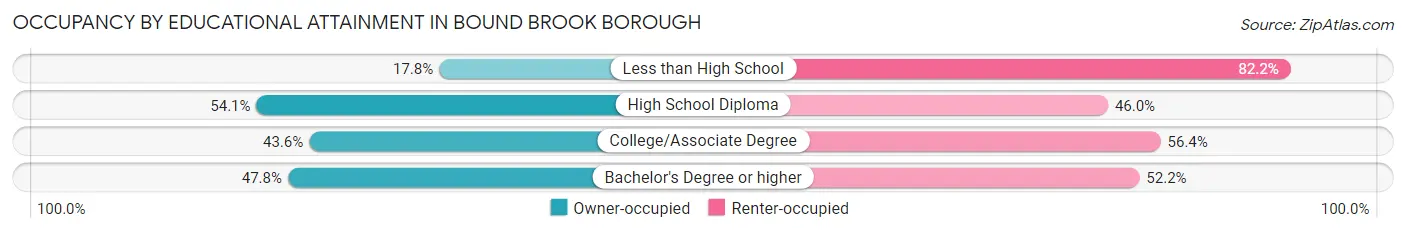
| Household Size | Owner-occupied | Renter-occupied |
| Less than High School | 102 (17.8%) | 470 (82.2%) |
| High School Diploma | 641 (54.0%) | 545 (46.0%) |
| College/Associate Degree | 487 (43.6%) | 630 (56.4%) |
| Bachelor's Degree or higher | 809 (47.8%) | 883 (52.2%) |
Occupancy by Age of Householder in Bound Brook borough
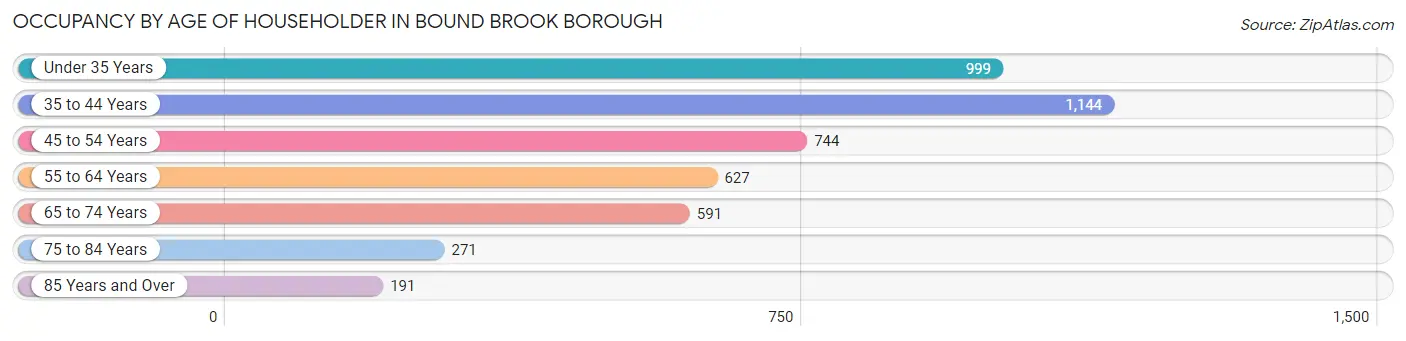
| Age Bracket | # Households | % Households |
| Under 35 Years | 999 | 21.9% |
| 35 to 44 Years | 1,144 | 25.1% |
| 45 to 54 Years | 744 | 16.3% |
| 55 to 64 Years | 627 | 13.7% |
| 65 to 74 Years | 591 | 12.9% |
| 75 to 84 Years | 271 | 5.9% |
| 85 Years and Over | 191 | 4.2% |
| Total | 4,567 | 100.0% |
Housing Finances in Bound Brook borough
Median Income by Occupancy in Bound Brook borough
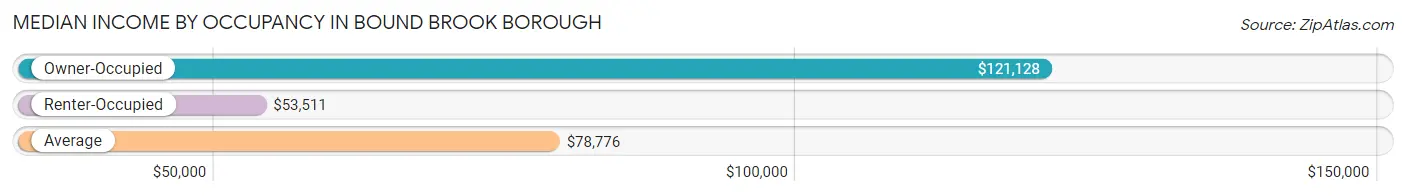
| Occupancy Type | # Households | Median Income |
| Owner-Occupied | 2,039 (44.7%) | $121,128 |
| Renter-Occupied | 2,528 (55.3%) | $53,511 |
| Average | 4,567 (100.0%) | $78,776 |
Occupancy by Householder Income Bracket in Bound Brook borough
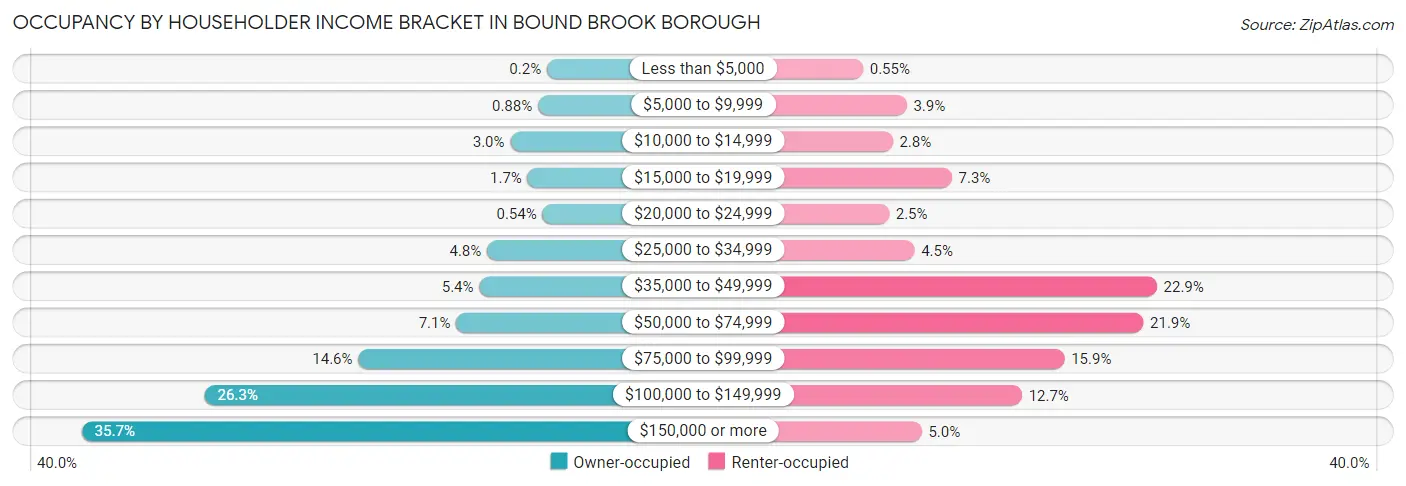
| Income Bracket | Owner-occupied | Renter-occupied |
| Less than $5,000 | 4 (0.2%) | 14 (0.5%) |
| $5,000 to $9,999 | 18 (0.9%) | 98 (3.9%) |
| $10,000 to $14,999 | 61 (3.0%) | 71 (2.8%) |
| $15,000 to $19,999 | 34 (1.7%) | 185 (7.3%) |
| $20,000 to $24,999 | 11 (0.5%) | 64 (2.5%) |
| $25,000 to $34,999 | 97 (4.8%) | 113 (4.5%) |
| $35,000 to $49,999 | 109 (5.3%) | 580 (22.9%) |
| $50,000 to $74,999 | 145 (7.1%) | 554 (21.9%) |
| $75,000 to $99,999 | 297 (14.6%) | 402 (15.9%) |
| $100,000 to $149,999 | 536 (26.3%) | 320 (12.7%) |
| $150,000 or more | 727 (35.6%) | 127 (5.0%) |
| Total | 2,039 (100.0%) | 2,528 (100.0%) |
Monthly Housing Cost Tiers in Bound Brook borough
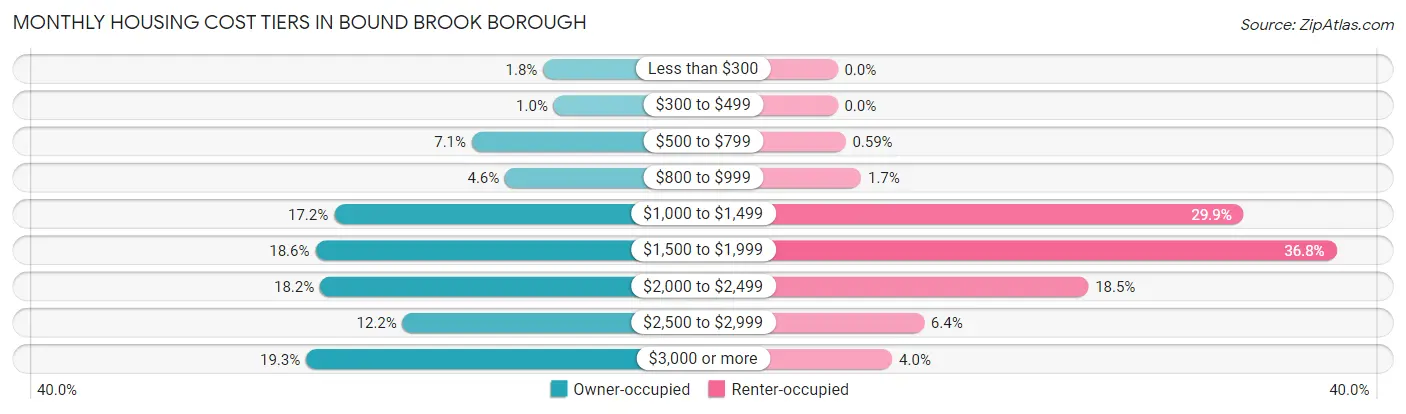
| Monthly Cost | Owner-occupied | Renter-occupied |
| Less than $300 | 37 (1.8%) | 0 (0.0%) |
| $300 to $499 | 21 (1.0%) | 0 (0.0%) |
| $500 to $799 | 144 (7.1%) | 15 (0.6%) |
| $800 to $999 | 94 (4.6%) | 44 (1.7%) |
| $1,000 to $1,499 | 351 (17.2%) | 756 (29.9%) |
| $1,500 to $1,999 | 379 (18.6%) | 929 (36.7%) |
| $2,000 to $2,499 | 372 (18.2%) | 467 (18.5%) |
| $2,500 to $2,999 | 248 (12.2%) | 161 (6.4%) |
| $3,000 or more | 393 (19.3%) | 102 (4.0%) |
| Total | 2,039 (100.0%) | 2,528 (100.0%) |
Physical Housing Characteristics in Bound Brook borough
Housing Structures in Bound Brook borough
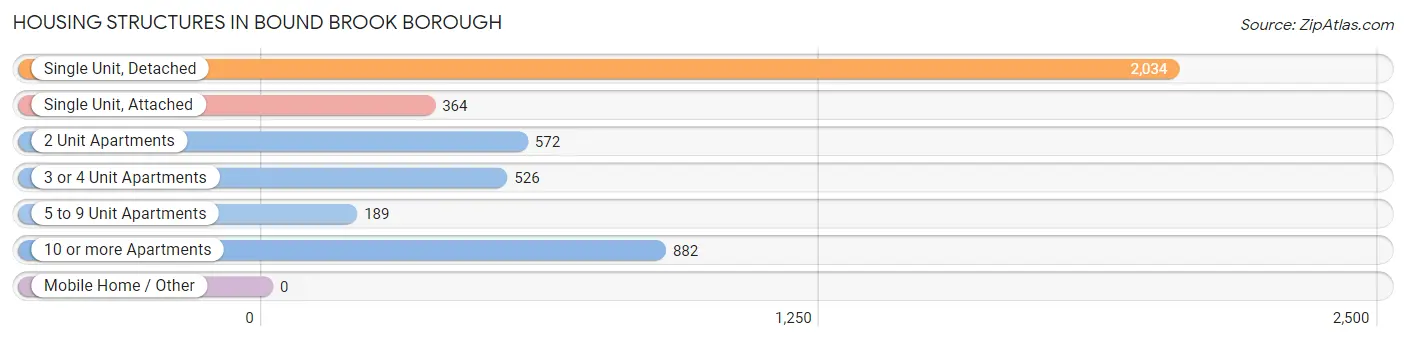
| Structure Type | # Housing Units | % Housing Units |
| Single Unit, Detached | 2,034 | 44.5% |
| Single Unit, Attached | 364 | 8.0% |
| 2 Unit Apartments | 572 | 12.5% |
| 3 or 4 Unit Apartments | 526 | 11.5% |
| 5 to 9 Unit Apartments | 189 | 4.1% |
| 10 or more Apartments | 882 | 19.3% |
| Mobile Home / Other | 0 | 0.0% |
| Total | 4,567 | 100.0% |
Housing Structures by Occupancy in Bound Brook borough
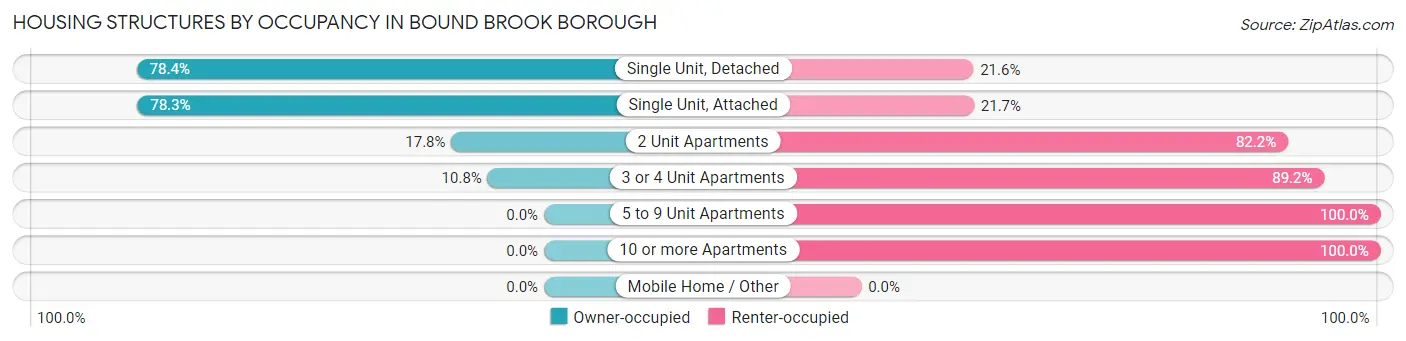
| Structure Type | Owner-occupied | Renter-occupied |
| Single Unit, Detached | 1,595 (78.4%) | 439 (21.6%) |
| Single Unit, Attached | 285 (78.3%) | 79 (21.7%) |
| 2 Unit Apartments | 102 (17.8%) | 470 (82.2%) |
| 3 or 4 Unit Apartments | 57 (10.8%) | 469 (89.2%) |
| 5 to 9 Unit Apartments | 0 (0.0%) | 189 (100.0%) |
| 10 or more Apartments | 0 (0.0%) | 882 (100.0%) |
| Mobile Home / Other | 0 (0.0%) | 0 (0.0%) |
| Total | 2,039 (44.7%) | 2,528 (55.3%) |
Housing Structures by Number of Rooms in Bound Brook borough
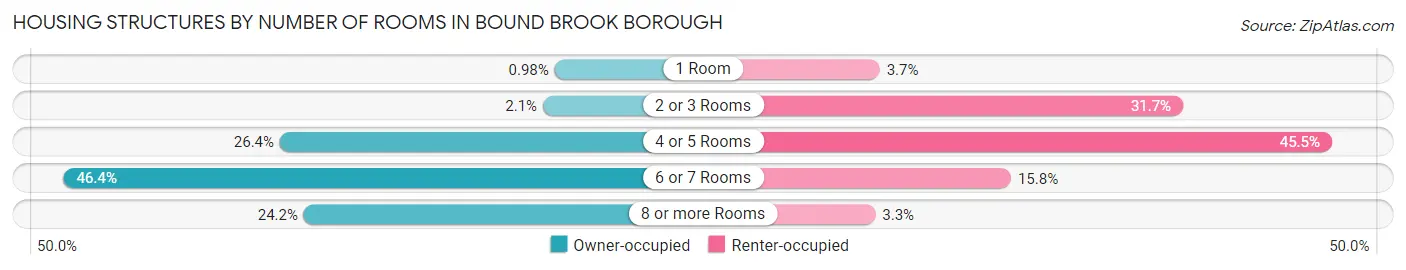
| Number of Rooms | Owner-occupied | Renter-occupied |
| 1 Room | 20 (1.0%) | 93 (3.7%) |
| 2 or 3 Rooms | 42 (2.1%) | 802 (31.7%) |
| 4 or 5 Rooms | 538 (26.4%) | 1,150 (45.5%) |
| 6 or 7 Rooms | 946 (46.4%) | 400 (15.8%) |
| 8 or more Rooms | 493 (24.2%) | 83 (3.3%) |
| Total | 2,039 (100.0%) | 2,528 (100.0%) |
Housing Structure by Heating Type in Bound Brook borough
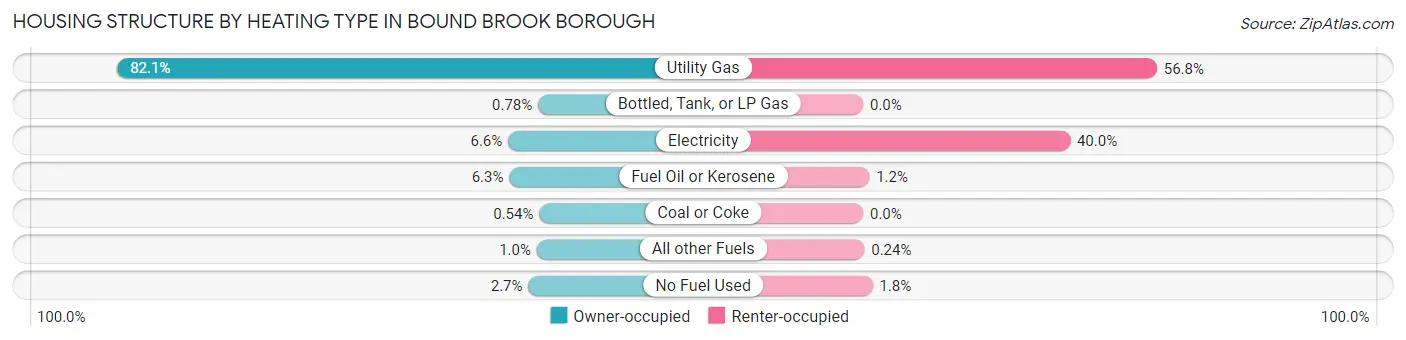
| Heating Type | Owner-occupied | Renter-occupied |
| Utility Gas | 1,674 (82.1%) | 1,435 (56.8%) |
| Bottled, Tank, or LP Gas | 16 (0.8%) | 0 (0.0%) |
| Electricity | 134 (6.6%) | 1,011 (40.0%) |
| Fuel Oil or Kerosene | 129 (6.3%) | 30 (1.2%) |
| Coal or Coke | 11 (0.5%) | 0 (0.0%) |
| All other Fuels | 21 (1.0%) | 6 (0.2%) |
| No Fuel Used | 54 (2.6%) | 46 (1.8%) |
| Total | 2,039 (100.0%) | 2,528 (100.0%) |
Household Vehicle Usage in Bound Brook borough
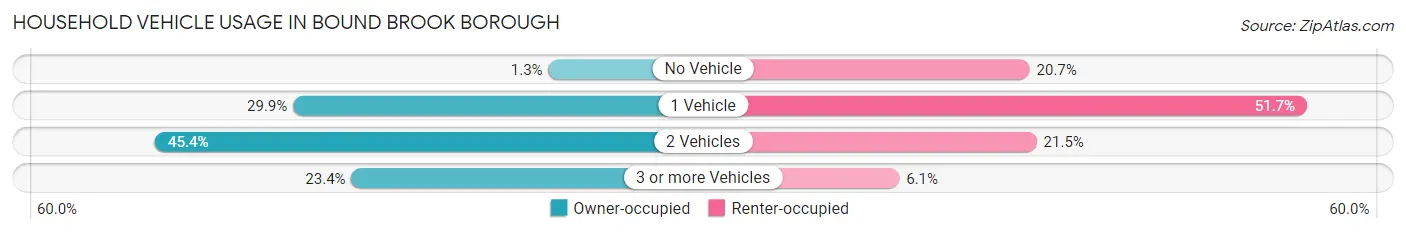
| Vehicles per Household | Owner-occupied | Renter-occupied |
| No Vehicle | 27 (1.3%) | 523 (20.7%) |
| 1 Vehicle | 610 (29.9%) | 1,308 (51.7%) |
| 2 Vehicles | 925 (45.4%) | 543 (21.5%) |
| 3 or more Vehicles | 477 (23.4%) | 154 (6.1%) |
| Total | 2,039 (100.0%) | 2,528 (100.0%) |
Real Estate & Mortgages in Bound Brook borough
Real Estate and Mortgage Overview in Bound Brook borough
| Characteristic | Without Mortgage | With Mortgage |
| Housing Units | 695 | 1,344 |
| Median Property Value | $361,800 | $333,100 |
| Median Household Income | $91,979 | $567 |
| Monthly Housing Costs | $1,047 | $378 |
| Real Estate Taxes | $8,481 | $17 |
Property Value by Mortgage Status in Bound Brook borough
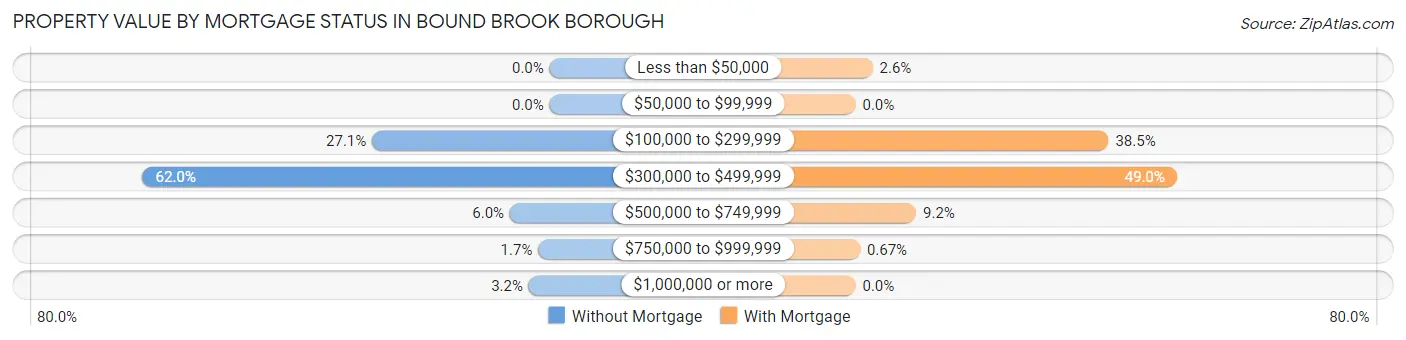
| Property Value | Without Mortgage | With Mortgage |
| Less than $50,000 | 0 (0.0%) | 35 (2.6%) |
| $50,000 to $99,999 | 0 (0.0%) | 0 (0.0%) |
| $100,000 to $299,999 | 188 (27.1%) | 518 (38.5%) |
| $300,000 to $499,999 | 431 (62.0%) | 658 (49.0%) |
| $500,000 to $749,999 | 42 (6.0%) | 124 (9.2%) |
| $750,000 to $999,999 | 12 (1.7%) | 9 (0.7%) |
| $1,000,000 or more | 22 (3.2%) | 0 (0.0%) |
| Total | 695 (100.0%) | 1,344 (100.0%) |
Household Income by Mortgage Status in Bound Brook borough
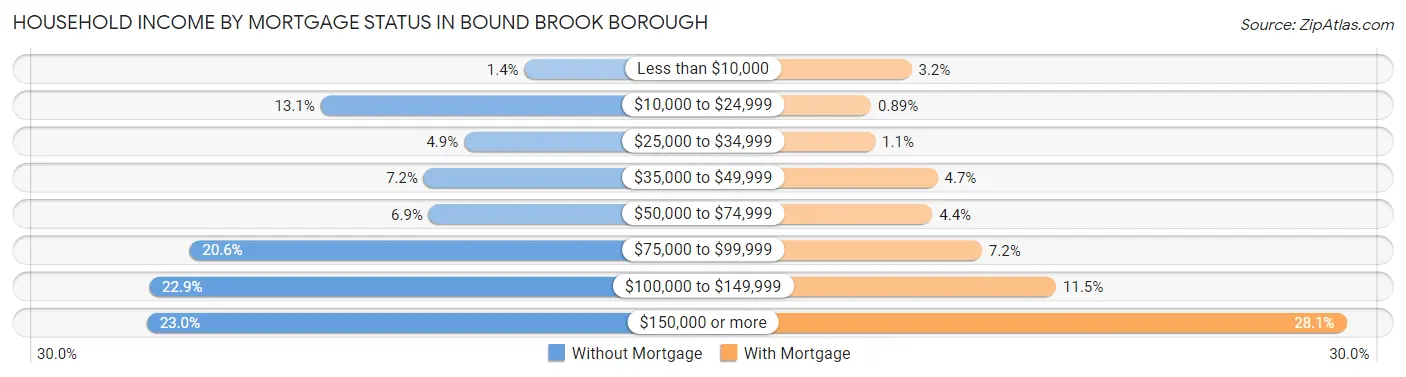
| Household Income | Without Mortgage | With Mortgage |
| Less than $10,000 | 10 (1.4%) | 43 (3.2%) |
| $10,000 to $24,999 | 91 (13.1%) | 12 (0.9%) |
| $25,000 to $34,999 | 34 (4.9%) | 15 (1.1%) |
| $35,000 to $49,999 | 50 (7.2%) | 63 (4.7%) |
| $50,000 to $74,999 | 48 (6.9%) | 59 (4.4%) |
| $75,000 to $99,999 | 143 (20.6%) | 97 (7.2%) |
| $100,000 to $149,999 | 159 (22.9%) | 154 (11.5%) |
| $150,000 or more | 160 (23.0%) | 377 (28.1%) |
| Total | 695 (100.0%) | 1,344 (100.0%) |
Property Value to Household Income Ratio in Bound Brook borough
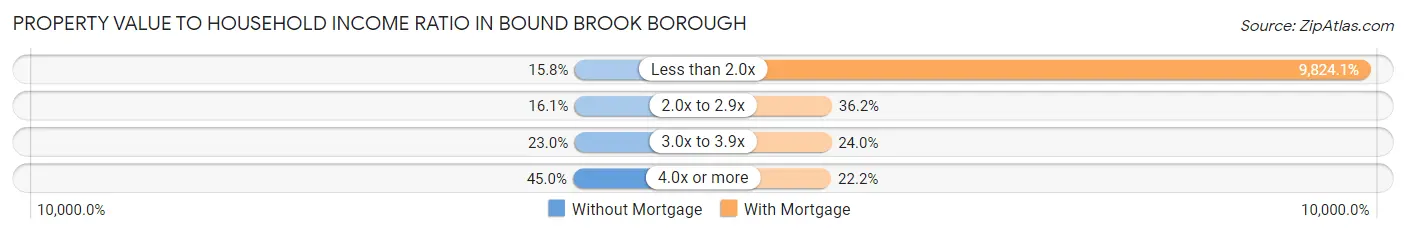
| Value-to-Income Ratio | Without Mortgage | With Mortgage |
| Less than 2.0x | 110 (15.8%) | 132,036 (9,824.1%) |
| 2.0x to 2.9x | 112 (16.1%) | 486 (36.2%) |
| 3.0x to 3.9x | 160 (23.0%) | 323 (24.0%) |
| 4.0x or more | 313 (45.0%) | 298 (22.2%) |
| Total | 695 (100.0%) | 1,344 (100.0%) |
Real Estate Taxes by Mortgage Status in Bound Brook borough

| Property Taxes | Without Mortgage | With Mortgage |
| Less than $800 | 0 (0.0%) | 0 (0.0%) |
| $800 to $1,499 | 0 (0.0%) | 0 (0.0%) |
| $800 to $1,499 | 622 (89.5%) | 0 (0.0%) |
| Total | 695 (100.0%) | 1,344 (100.0%) |
Health & Disability in Bound Brook borough
Health Insurance Coverage by Age in Bound Brook borough
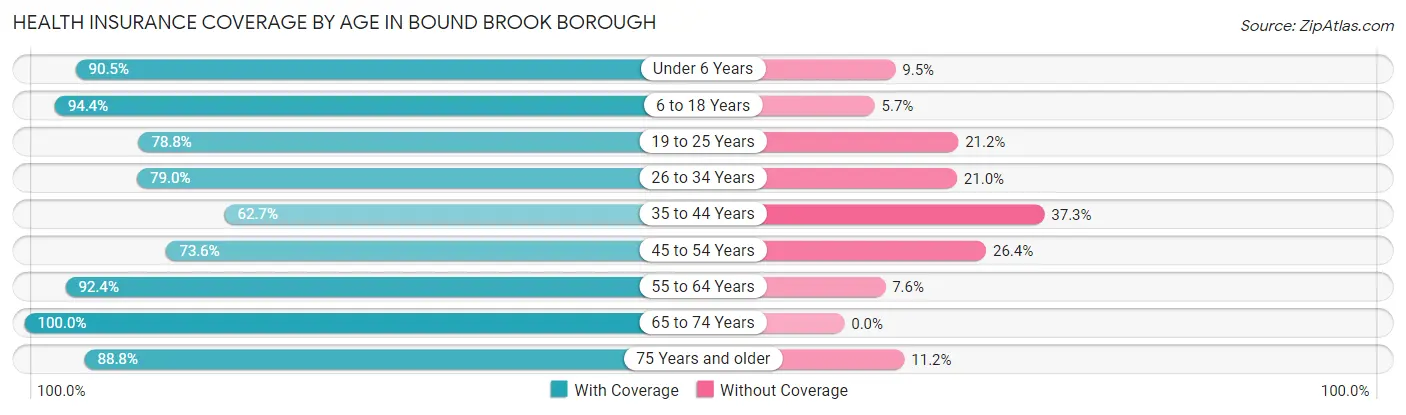
| Age Bracket | With Coverage | Without Coverage |
| Under 6 Years | 798 (90.5%) | 84 (9.5%) |
| 6 to 18 Years | 1,736 (94.4%) | 104 (5.7%) |
| 19 to 25 Years | 812 (78.8%) | 219 (21.2%) |
| 26 to 34 Years | 1,527 (79.0%) | 406 (21.0%) |
| 35 to 44 Years | 1,252 (62.7%) | 745 (37.3%) |
| 45 to 54 Years | 1,127 (73.6%) | 405 (26.4%) |
| 55 to 64 Years | 1,077 (92.4%) | 89 (7.6%) |
| 65 to 74 Years | 891 (100.0%) | 0 (0.0%) |
| 75 Years and older | 563 (88.8%) | 71 (11.2%) |
| Total | 9,783 (82.2%) | 2,123 (17.8%) |
Health Insurance Coverage by Citizenship Status in Bound Brook borough
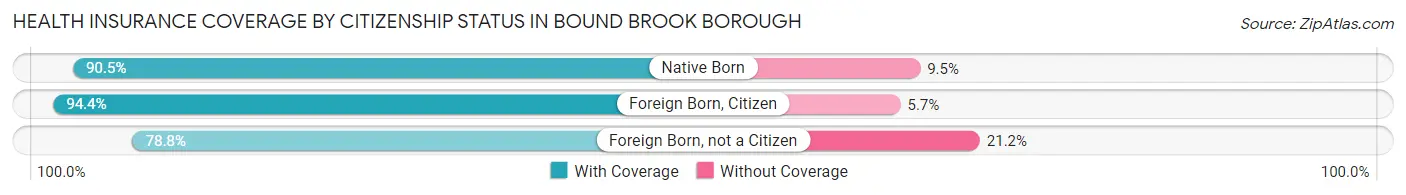
| Citizenship Status | With Coverage | Without Coverage |
| Native Born | 798 (90.5%) | 84 (9.5%) |
| Foreign Born, Citizen | 1,736 (94.4%) | 104 (5.7%) |
| Foreign Born, not a Citizen | 812 (78.8%) | 219 (21.2%) |
Health Insurance Coverage by Household Income in Bound Brook borough
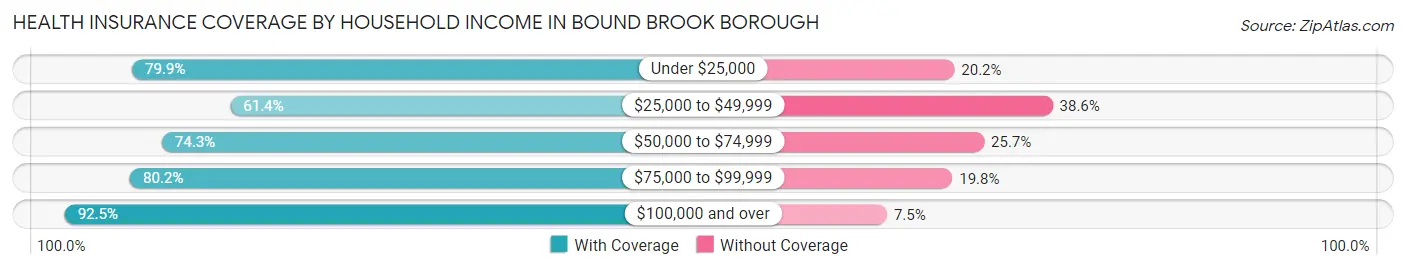
| Household Income | With Coverage | Without Coverage |
| Under $25,000 | 658 (79.8%) | 166 (20.2%) |
| $25,000 to $49,999 | 1,168 (61.4%) | 733 (38.6%) |
| $50,000 to $74,999 | 1,357 (74.3%) | 470 (25.7%) |
| $75,000 to $99,999 | 1,328 (80.2%) | 327 (19.8%) |
| $100,000 and over | 5,225 (92.5%) | 425 (7.5%) |
Public vs Private Health Insurance Coverage by Age in Bound Brook borough
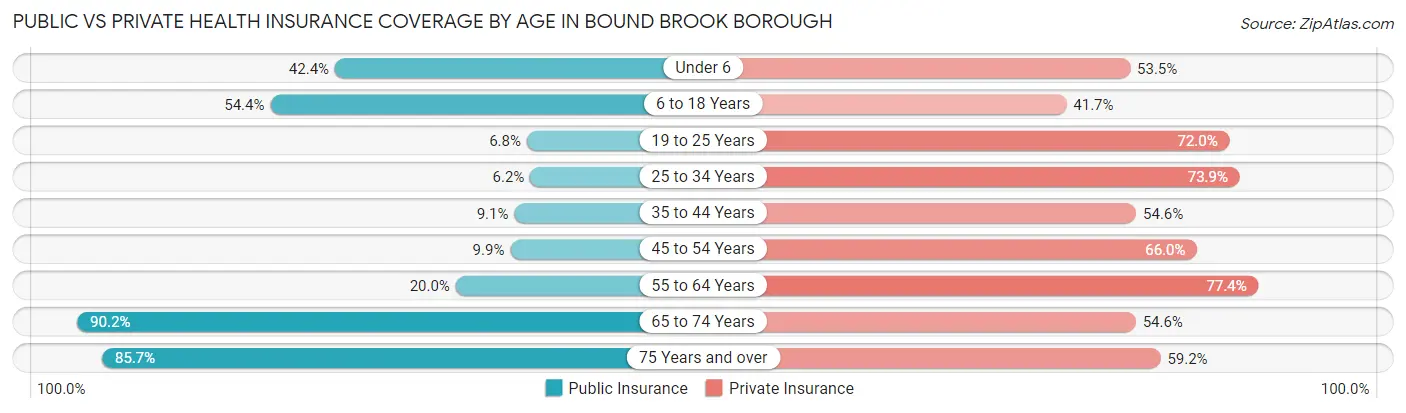
| Age Bracket | Public Insurance | Private Insurance |
| Under 6 | 374 (42.4%) | 472 (53.5%) |
| 6 to 18 Years | 1,001 (54.4%) | 767 (41.7%) |
| 19 to 25 Years | 70 (6.8%) | 742 (72.0%) |
| 25 to 34 Years | 119 (6.2%) | 1,428 (73.9%) |
| 35 to 44 Years | 182 (9.1%) | 1,091 (54.6%) |
| 45 to 54 Years | 151 (9.9%) | 1,011 (66.0%) |
| 55 to 64 Years | 233 (20.0%) | 902 (77.4%) |
| 65 to 74 Years | 804 (90.2%) | 486 (54.5%) |
| 75 Years and over | 543 (85.7%) | 375 (59.2%) |
| Total | 3,477 (29.2%) | 7,274 (61.1%) |
Disability Status by Sex by Age in Bound Brook borough
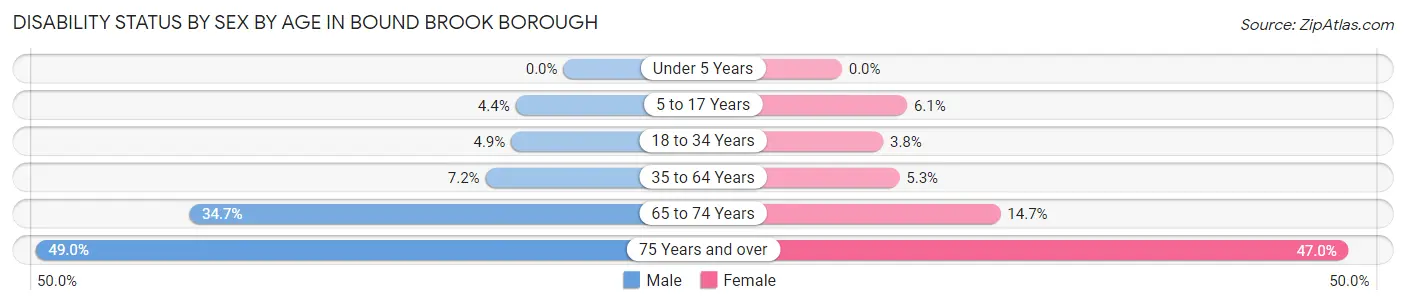
| Age Bracket | Male | Female |
| Under 5 Years | 0 (0.0%) | 0 (0.0%) |
| 5 to 17 Years | 40 (4.4%) | 54 (6.0%) |
| 18 to 34 Years | 72 (4.9%) | 62 (3.8%) |
| 35 to 64 Years | 177 (7.2%) | 120 (5.3%) |
| 65 to 74 Years | 149 (34.7%) | 68 (14.7%) |
| 75 Years and over | 120 (49.0%) | 183 (47.0%) |
Disability Class by Sex by Age in Bound Brook borough
Disability Class: Hearing Difficulty
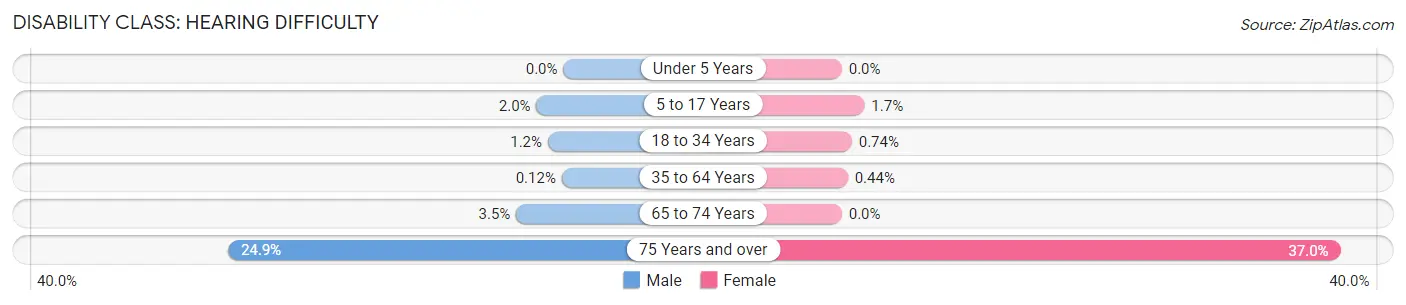
| Age Bracket | Male | Female |
| Under 5 Years | 0 (0.0%) | 0 (0.0%) |
| 5 to 17 Years | 18 (2.0%) | 15 (1.7%) |
| 18 to 34 Years | 17 (1.1%) | 12 (0.7%) |
| 35 to 64 Years | 3 (0.1%) | 10 (0.4%) |
| 65 to 74 Years | 15 (3.5%) | 0 (0.0%) |
| 75 Years and over | 61 (24.9%) | 144 (37.0%) |
Disability Class: Vision Difficulty
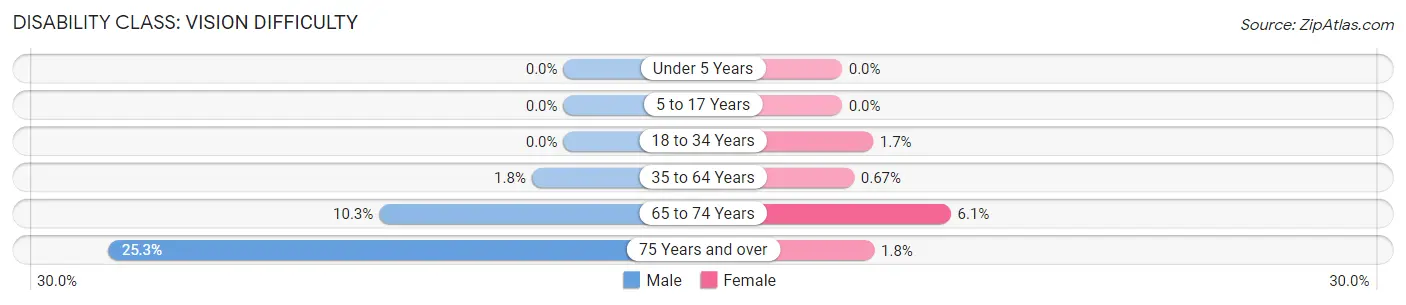
| Age Bracket | Male | Female |
| Under 5 Years | 0 (0.0%) | 0 (0.0%) |
| 5 to 17 Years | 0 (0.0%) | 0 (0.0%) |
| 18 to 34 Years | 0 (0.0%) | 28 (1.7%) |
| 35 to 64 Years | 43 (1.8%) | 15 (0.7%) |
| 65 to 74 Years | 44 (10.3%) | 28 (6.1%) |
| 75 Years and over | 62 (25.3%) | 7 (1.8%) |
Disability Class: Cognitive Difficulty
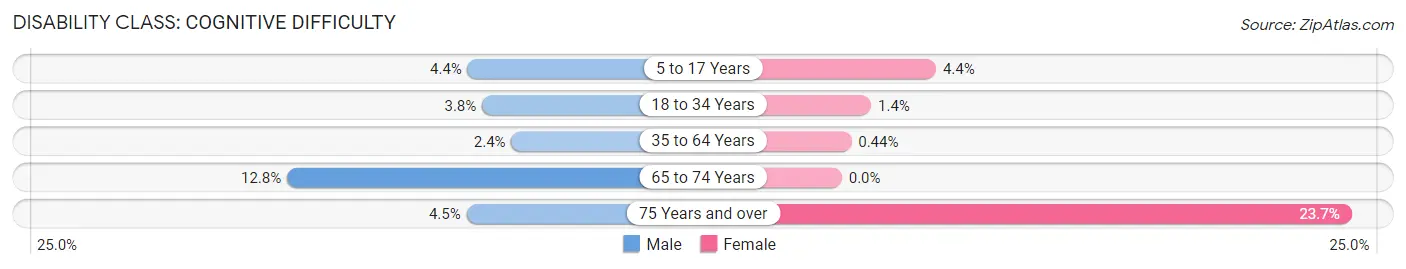
| Age Bracket | Male | Female |
| 5 to 17 Years | 40 (4.4%) | 39 (4.4%) |
| 18 to 34 Years | 56 (3.8%) | 22 (1.4%) |
| 35 to 64 Years | 59 (2.4%) | 10 (0.4%) |
| 65 to 74 Years | 55 (12.8%) | 0 (0.0%) |
| 75 Years and over | 11 (4.5%) | 92 (23.6%) |
Disability Class: Ambulatory Difficulty
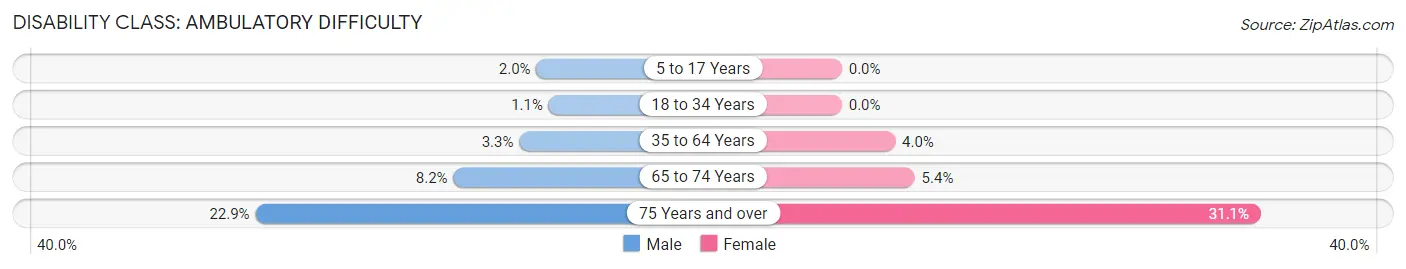
| Age Bracket | Male | Female |
| 5 to 17 Years | 18 (2.0%) | 0 (0.0%) |
| 18 to 34 Years | 16 (1.1%) | 0 (0.0%) |
| 35 to 64 Years | 80 (3.3%) | 89 (4.0%) |
| 65 to 74 Years | 35 (8.2%) | 25 (5.4%) |
| 75 Years and over | 56 (22.9%) | 121 (31.1%) |
Disability Class: Self-Care Difficulty
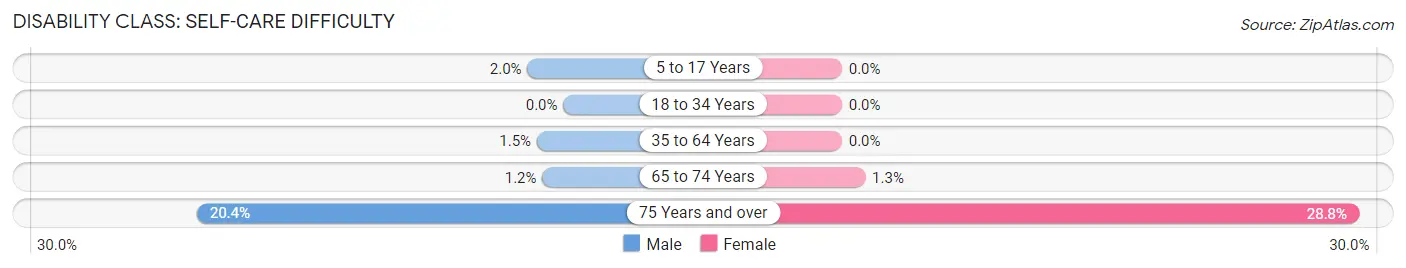
| Age Bracket | Male | Female |
| 5 to 17 Years | 18 (2.0%) | 0 (0.0%) |
| 18 to 34 Years | 0 (0.0%) | 0 (0.0%) |
| 35 to 64 Years | 36 (1.5%) | 0 (0.0%) |
| 65 to 74 Years | 5 (1.2%) | 6 (1.3%) |
| 75 Years and over | 50 (20.4%) | 112 (28.8%) |
Technology Access in Bound Brook borough
Computing Device Access in Bound Brook borough
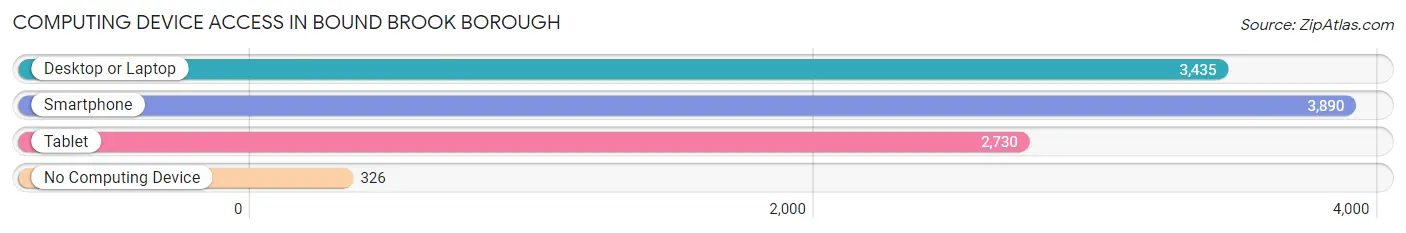
| Device Type | # Households | % Households |
| Desktop or Laptop | 3,435 | 75.2% |
| Smartphone | 3,890 | 85.2% |
| Tablet | 2,730 | 59.8% |
| No Computing Device | 326 | 7.1% |
| Total | 4,567 | 100.0% |
Internet Access in Bound Brook borough
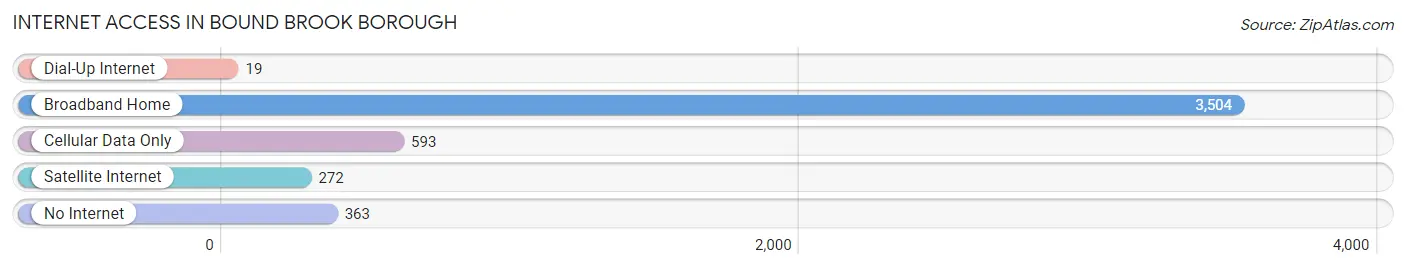
| Internet Type | # Households | % Households |
| Dial-Up Internet | 19 | 0.4% |
| Broadband Home | 3,504 | 76.7% |
| Cellular Data Only | 593 | 13.0% |
| Satellite Internet | 272 | 6.0% |
| No Internet | 363 | 8.0% |
| Total | 4,567 | 100.0% |
Bound Brook borough Summary
Introduction
Bound Brook Borough is a small borough located in Somerset County, New Jersey. It is situated on the Raritan River, approximately 25 miles southwest of New York City. The borough is home to a population of approximately 10,402 people, according to the 2010 United States Census. The borough is known for its rich history, diverse geography, vibrant economy, and diverse demographics.
History
The area that is now Bound Brook Borough was originally inhabited by the Lenape Native Americans. The first European settlers arrived in the area in the late 17th century. The area was originally part of Bridgewater Township, which was established in 1688. In 1869, Bound Brook was incorporated as a borough.
The borough was named after the Bound Brook, a tributary of the Raritan River. The name is derived from the Dutch word “bunde”, which means “confluence”. The borough was an important transportation hub in the 19th century, as it was located at the intersection of several major roads.
Geography
Bound Brook Borough is located in central New Jersey, approximately 25 miles southwest of New York City. The borough is situated on the Raritan River, and is bordered by Bridgewater Township to the north, South Bound Brook to the east, and Manville to the south. The borough covers an area of 2.2 square miles, and has a population density of 4,717 people per square mile.
The borough is located in the Raritan Valley, a region of central New Jersey that is known for its rolling hills and fertile farmland. The borough is home to several parks and recreational areas, including the Duke Island Park, Washington Park, and the Bound Brook Greenway.
Economy
Bound Brook Borough has a vibrant economy that is driven by a variety of industries. The borough is home to several large employers, including the Johnson & Johnson Corporation, the Merck & Co. Corporation, and the Novartis Corporation. The borough is also home to several small businesses, including restaurants, retail stores, and professional services.
The borough is also home to several educational institutions, including the Rutgers University-New Brunswick campus, the Somerset County Vocational and Technical High School, and the Bound Brook High School.
Demographics
According to the 2010 United States Census, the population of Bound Brook Borough was 10,402. The racial makeup of the borough was 79.3% White, 8.2% African American, 0.3% Native American, 5.2% Asian, and 6.9% from other races. The median household income was $60,945, and the median family income was $71,917.
Conclusion
Bound Brook Borough is a small borough located in Somerset County, New Jersey. It is situated on the Raritan River, approximately 25 miles southwest of New York City. The borough is home to a population of approximately 10,402 people, according to the 2010 United States Census. The borough is known for its rich history, diverse geography, vibrant economy, and diverse demographics. The borough is home to several large employers, including the Johnson & Johnson Corporation, the Merck & Co. Corporation, and the Novartis Corporation. The borough is also home to several small businesses, educational institutions, and recreational areas. The racial makeup of the borough was 79.3% White, 8.2% African American, 0.3% Native American, 5.2% Asian, and 6.9% from other races. The median household income was $60,945, and the median family income was $71,917.
Common Questions
What is Per Capita Income in Bound Brook borough?
Per Capita income in Bound Brook borough is $42,456.
What is the Median Family Income in Bound Brook borough?
Median Family Income in Bound Brook borough is $81,618.
What is the Median Household income in Bound Brook borough?
Median Household Income in Bound Brook borough is $78,776.
What is Income or Wage Gap in Bound Brook borough?
Income or Wage Gap in Bound Brook borough is 24.2%.
Women in Bound Brook borough earn 75.8 cents for every dollar earned by a man.
What is Inequality or Gini Index in Bound Brook borough?
Inequality or Gini Index in Bound Brook borough is 0.45.
What is the Total Population of Bound Brook borough?
Total Population of Bound Brook borough is 11,906.
What is the Total Male Population of Bound Brook borough?
Total Male Population of Bound Brook borough is 5,851.
What is the Total Female Population of Bound Brook borough?
Total Female Population of Bound Brook borough is 6,055.
What is the Ratio of Males per 100 Females in Bound Brook borough?
There are 96.63 Males per 100 Females in Bound Brook borough.
What is the Ratio of Females per 100 Males in Bound Brook borough?
There are 103.49 Females per 100 Males in Bound Brook borough.
What is the Median Population Age in Bound Brook borough?
Median Population Age in Bound Brook borough is 36.2 Years.
What is the Average Family Size in Bound Brook borough
Average Family Size in Bound Brook borough is 3.2 People.
What is the Average Household Size in Bound Brook borough
Average Household Size in Bound Brook borough is 2.6 People.
How Large is the Labor Force in Bound Brook borough?
There are 7,092 People in the Labor Forcein in Bound Brook borough.
What is the Percentage of People in the Labor Force in Bound Brook borough?
74.5% of People are in the Labor Force in Bound Brook borough.
What is the Unemployment Rate in Bound Brook borough?
Unemployment Rate in Bound Brook borough is 6.6%.