Magnolia borough, NJ Map & Demographics
Magnolia borough Overview
$38,225
PER CAPITA INCOME
$93,977
AVG FAMILY INCOME
$74,295
AVG HOUSEHOLD INCOME
22.6%
WAGE / INCOME GAP [ % ]
77.4¢/ $1
WAGE / INCOME GAP [ $ ]
0.37
INEQUALITY / GINI INDEX
4,342
TOTAL POPULATION
2,138
MALE POPULATION
2,204
FEMALE POPULATION
97.01
MALES / 100 FEMALES
103.09
FEMALES / 100 MALES
34.8
MEDIAN AGE
3.1
AVG FAMILY SIZE
2.4
AVG HOUSEHOLD SIZE
2,656
LABOR FORCE [ PEOPLE ]
75.9%
PERCENT IN LABOR FORCE
7.5%
UNEMPLOYMENT RATE
Income in Magnolia borough
Income Overview in Magnolia borough
Per Capita Income in Magnolia borough is $38,225, while median incomes of families and households are $93,977 and $74,295 respectively.
| Characteristic | Number | Measure |
| Per Capita Income | 4,342 | $38,225 |
| Median Family Income | 1,025 | $93,977 |
| Mean Family Income | 1,025 | $104,610 |
| Median Household Income | 1,784 | $74,295 |
| Mean Household Income | 1,784 | $91,729 |
| Income Deficit | 1,025 | $0 |
| Wage / Income Gap (%) | 4,342 | 22.60% |
| Wage / Income Gap ($) | 4,342 | 77.40¢ per $1 |
| Gini / Inequality Index | 4,342 | 0.37 |
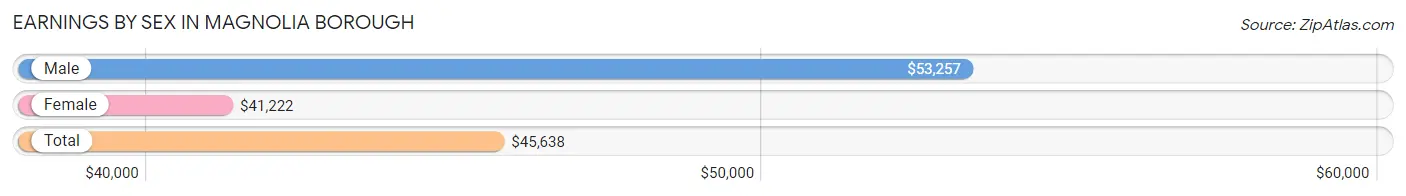
Earnings by Sex in Magnolia borough
Average Earnings in Magnolia borough are $45,638, $53,257 for men and $41,222 for women, a difference of 22.6%.
| Sex | Number | Average Earnings |
| Male | 1,335 (50.2%) | $53,257 |
| Female | 1,322 (49.8%) | $41,222 |
| Total | 2,657 (100.0%) | $45,638 |
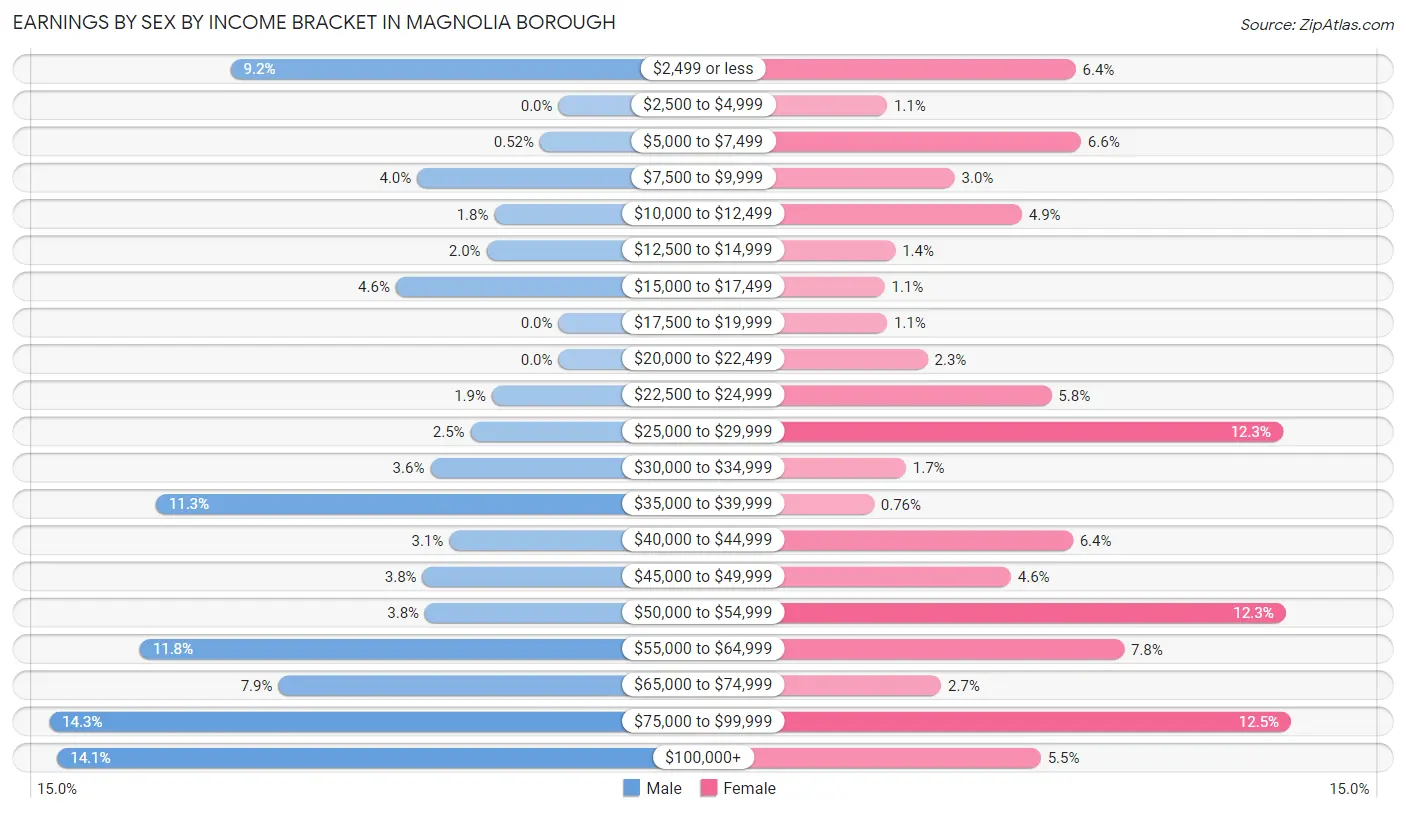
Earnings by Sex by Income Bracket in Magnolia borough
The most common earnings brackets in Magnolia borough are $75,000 to $99,999 for men (191 | 14.3%) and $75,000 to $99,999 for women (165 | 12.5%).
| Income | Male | Female |
| $2,499 or less | 123 (9.2%) | 85 (6.4%) |
| $2,500 to $4,999 | 0 (0.0%) | 15 (1.1%) |
| $5,000 to $7,499 | 7 (0.5%) | 87 (6.6%) |
| $7,500 to $9,999 | 53 (4.0%) | 40 (3.0%) |
| $10,000 to $12,499 | 24 (1.8%) | 65 (4.9%) |
| $12,500 to $14,999 | 27 (2.0%) | 18 (1.4%) |
| $15,000 to $17,499 | 61 (4.6%) | 14 (1.1%) |
| $17,500 to $19,999 | 0 (0.0%) | 15 (1.1%) |
| $20,000 to $22,499 | 0 (0.0%) | 30 (2.3%) |
| $22,500 to $24,999 | 25 (1.9%) | 76 (5.8%) |
| $25,000 to $29,999 | 33 (2.5%) | 162 (12.2%) |
| $30,000 to $34,999 | 48 (3.6%) | 22 (1.7%) |
| $35,000 to $39,999 | 151 (11.3%) | 10 (0.8%) |
| $40,000 to $44,999 | 41 (3.1%) | 84 (6.4%) |
| $45,000 to $49,999 | 51 (3.8%) | 61 (4.6%) |
| $50,000 to $54,999 | 50 (3.7%) | 163 (12.3%) |
| $55,000 to $64,999 | 157 (11.8%) | 103 (7.8%) |
| $65,000 to $74,999 | 105 (7.9%) | 35 (2.6%) |
| $75,000 to $99,999 | 191 (14.3%) | 165 (12.5%) |
| $100,000+ | 188 (14.1%) | 72 (5.4%) |
| Total | 1,335 (100.0%) | 1,322 (100.0%) |
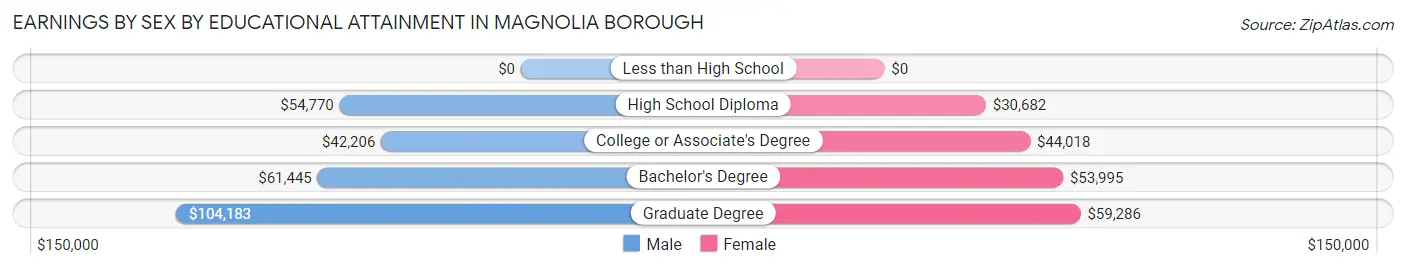
Earnings by Sex by Educational Attainment in Magnolia borough
Average earnings in Magnolia borough are $58,259 for men and $46,691 for women, a difference of 19.9%. Men with an educational attainment of graduate degree enjoy the highest average annual earnings of $104,183, while those with college or associate's degree education earn the least with $42,206. Women with an educational attainment of graduate degree earn the most with the average annual earnings of $59,286, while those with high school diploma education have the smallest earnings of $30,682.
| Educational Attainment | Male Income | Female Income |
| Less than High School | - | - |
| High School Diploma | $54,770 | $30,682 |
| College or Associate's Degree | $42,206 | $44,018 |
| Bachelor's Degree | $61,445 | $53,995 |
| Graduate Degree | $104,183 | $59,286 |
| Total | $58,259 | $46,691 |
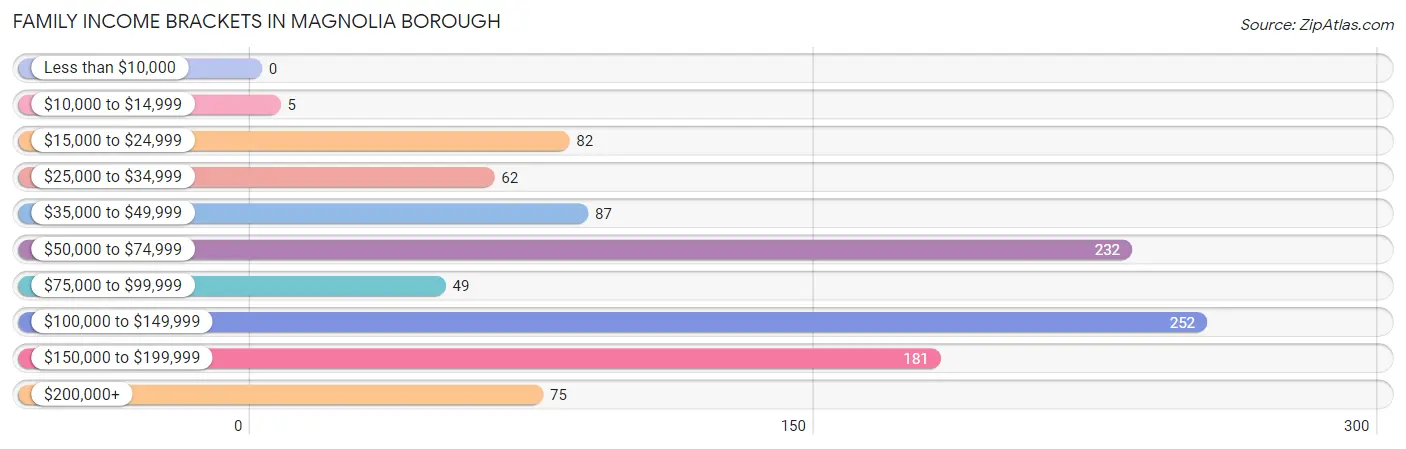
Family Income in Magnolia borough
Family Income Brackets in Magnolia borough
According to the Magnolia borough family income data, there are 252 families falling into the $100,000 to $149,999 income range, which is the most common income bracket and makes up 24.6% of all families.
| Income Bracket | # Families | % Families |
| Less than $10,000 | 0 | 0.0% |
| $10,000 to $14,999 | 5 | 0.5% |
| $15,000 to $24,999 | 82 | 8.0% |
| $25,000 to $34,999 | 62 | 6.0% |
| $35,000 to $49,999 | 87 | 8.5% |
| $50,000 to $74,999 | 232 | 22.6% |
| $75,000 to $99,999 | 49 | 4.8% |
| $100,000 to $149,999 | 252 | 24.6% |
| $150,000 to $199,999 | 181 | 17.7% |
| $200,000+ | 75 | 7.3% |
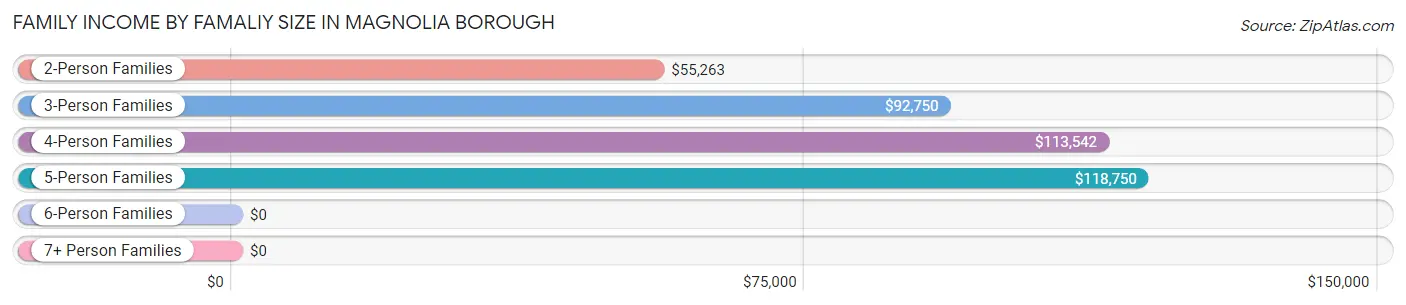
Family Income by Famaliy Size in Magnolia borough
5-person families (72 | 7.0%) account for the highest median family income in Magnolia borough with $118,750 per family, while 3-person families (181 | 17.7%) have the highest median income of $30,917 per family member.
| Income Bracket | # Families | Median Income |
| 2-Person Families | 460 (44.9%) | $55,263 |
| 3-Person Families | 181 (17.7%) | $92,750 |
| 4-Person Families | 294 (28.7%) | $113,542 |
| 5-Person Families | 72 (7.0%) | $118,750 |
| 6-Person Families | 18 (1.8%) | $0 |
| 7+ Person Families | 0 (0.0%) | $0 |
| Total | 1,025 (100.0%) | $93,977 |
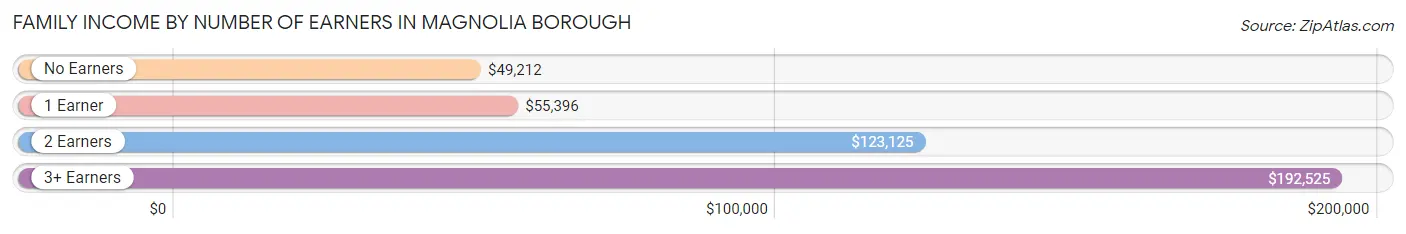
Family Income by Number of Earners in Magnolia borough
The median family income in Magnolia borough is $93,977, with families comprising 3+ earners (187) having the highest median family income of $192,525, while families with no earners (143) have the lowest median family income of $49,212, accounting for 18.2% and 14.0% of families, respectively.
| Number of Earners | # Families | Median Income |
| No Earners | 143 (14.0%) | $49,212 |
| 1 Earner | 281 (27.4%) | $55,396 |
| 2 Earners | 414 (40.4%) | $123,125 |
| 3+ Earners | 187 (18.2%) | $192,525 |
| Total | 1,025 (100.0%) | $93,977 |
Household Income in Magnolia borough
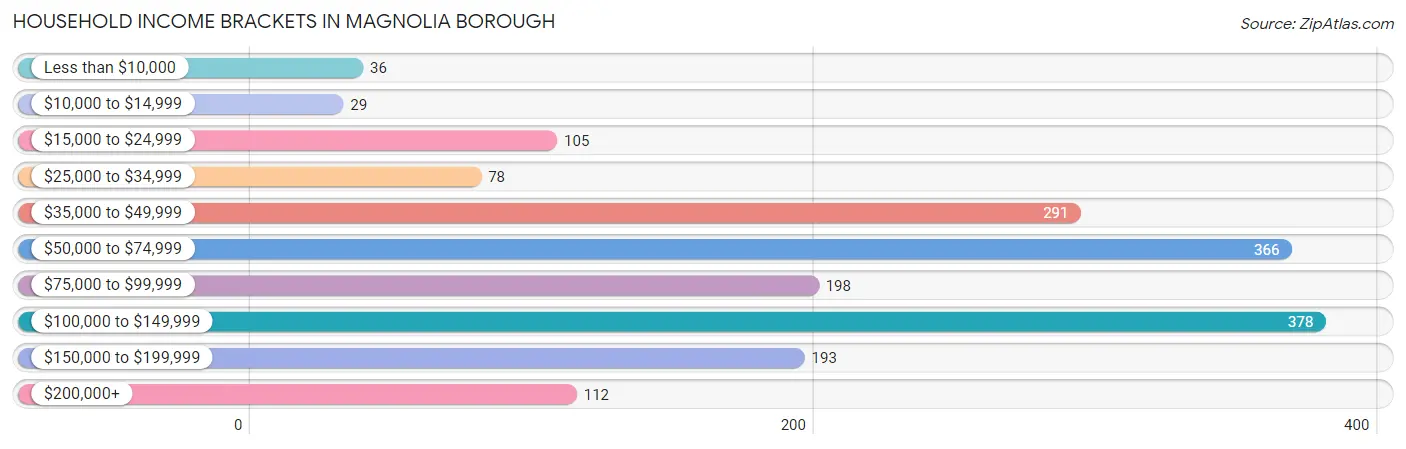
Household Income Brackets in Magnolia borough
With 378 households falling in the category, the $100,000 to $149,999 income range is the most frequent in Magnolia borough, accounting for 21.2% of all households. In contrast, only 29 households (1.6%) fall into the $10,000 to $14,999 income bracket, making it the least populous group.
| Income Bracket | # Households | % Households |
| Less than $10,000 | 36 | 2.0% |
| $10,000 to $14,999 | 29 | 1.6% |
| $15,000 to $24,999 | 105 | 5.9% |
| $25,000 to $34,999 | 78 | 4.4% |
| $35,000 to $49,999 | 291 | 16.3% |
| $50,000 to $74,999 | 366 | 20.5% |
| $75,000 to $99,999 | 198 | 11.1% |
| $100,000 to $149,999 | 378 | 21.2% |
| $150,000 to $199,999 | 193 | 10.8% |
| $200,000+ | 112 | 6.3% |
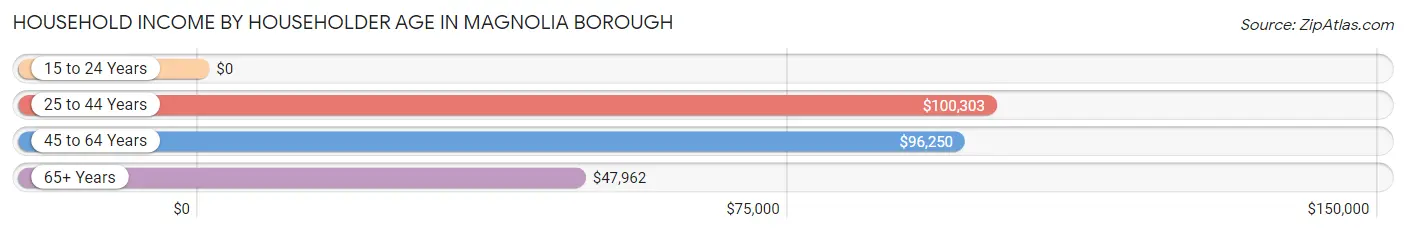
Household Income by Householder Age in Magnolia borough
The median household income in Magnolia borough is $74,295, with the highest median household income of $100,303 found in the 25 to 44 years age bracket for the primary householder. A total of 635 households (35.6%) fall into this category. Meanwhile, the 15 to 24 years age bracket for the primary householder has the lowest median household income of $0, with 30 households (1.7%) in this group.
| Income Bracket | # Households | Median Income |
| 15 to 24 Years | 30 (1.7%) | $0 |
| 25 to 44 Years | 635 (35.6%) | $100,303 |
| 45 to 64 Years | 644 (36.1%) | $96,250 |
| 65+ Years | 475 (26.6%) | $47,962 |
| Total | 1,784 (100.0%) | $74,295 |
Poverty in Magnolia borough
Income Below Poverty by Sex and Age in Magnolia borough
With 2.6% poverty level for males and 4.7% for females among the residents of Magnolia borough, 55 to 64 year old males and 55 to 64 year old females are the most vulnerable to poverty, with 28 males (9.8%) and 23 females (11.5%) in their respective age groups living below the poverty level.
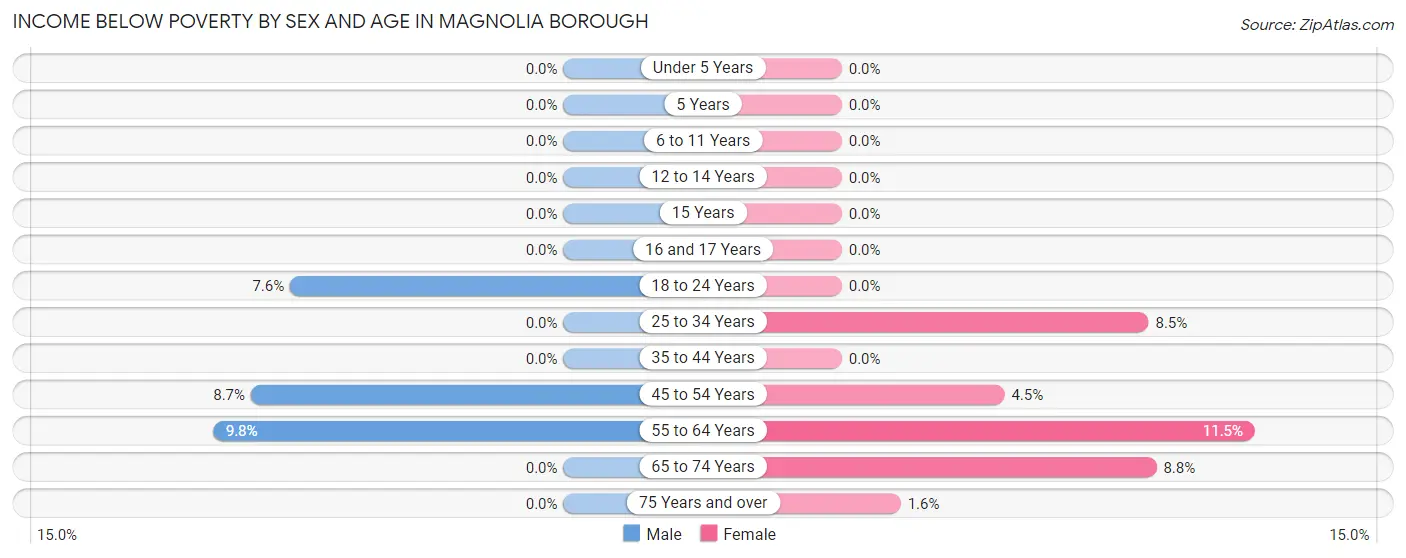
| Age Bracket | Male | Female |
| Under 5 Years | 0 (0.0%) | 0 (0.0%) |
| 5 Years | 0 (0.0%) | 0 (0.0%) |
| 6 to 11 Years | 0 (0.0%) | 0 (0.0%) |
| 12 to 14 Years | 0 (0.0%) | 0 (0.0%) |
| 15 Years | 0 (0.0%) | 0 (0.0%) |
| 16 and 17 Years | 0 (0.0%) | 0 (0.0%) |
| 18 to 24 Years | 7 (7.6%) | 0 (0.0%) |
| 25 to 34 Years | 0 (0.0%) | 34 (8.5%) |
| 35 to 44 Years | 0 (0.0%) | 0 (0.0%) |
| 45 to 54 Years | 20 (8.7%) | 15 (4.5%) |
| 55 to 64 Years | 28 (9.8%) | 23 (11.5%) |
| 65 to 74 Years | 0 (0.0%) | 29 (8.8%) |
| 75 Years and over | 0 (0.0%) | 2 (1.6%) |
| Total | 55 (2.6%) | 103 (4.7%) |
Income Above Poverty by Sex and Age in Magnolia borough
According to the poverty statistics in Magnolia borough, males aged under 5 years and females aged under 5 years are the age groups that are most secure financially, with 100.0% of males and 100.0% of females in these age groups living above the poverty line.
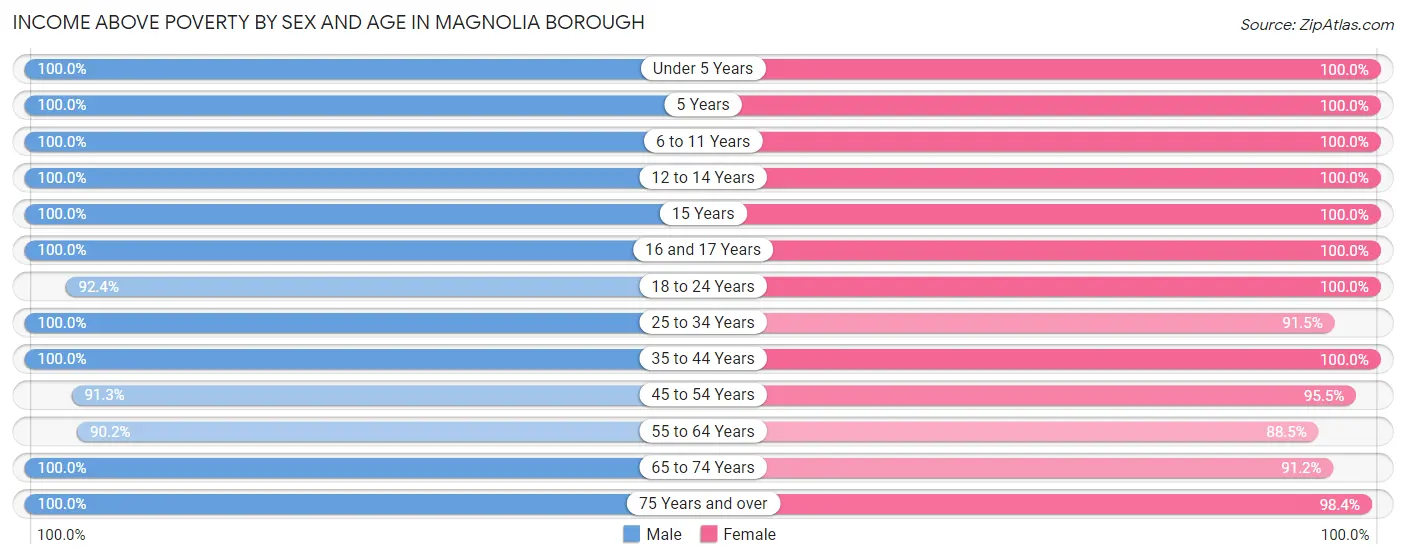
| Age Bracket | Male | Female |
| Under 5 Years | 203 (100.0%) | 166 (100.0%) |
| 5 Years | 33 (100.0%) | 33 (100.0%) |
| 6 to 11 Years | 125 (100.0%) | 116 (100.0%) |
| 12 to 14 Years | 42 (100.0%) | 29 (100.0%) |
| 15 Years | 89 (100.0%) | 6 (100.0%) |
| 16 and 17 Years | 75 (100.0%) | 22 (100.0%) |
| 18 to 24 Years | 85 (92.4%) | 216 (100.0%) |
| 25 to 34 Years | 538 (100.0%) | 364 (91.5%) |
| 35 to 44 Years | 169 (100.0%) | 234 (100.0%) |
| 45 to 54 Years | 210 (91.3%) | 316 (95.5%) |
| 55 to 64 Years | 259 (90.2%) | 177 (88.5%) |
| 65 to 74 Years | 130 (100.0%) | 302 (91.2%) |
| 75 Years and over | 125 (100.0%) | 120 (98.4%) |
| Total | 2,083 (97.4%) | 2,101 (95.3%) |
Income Below Poverty Among Married-Couple Families in Magnolia borough
The poverty statistics for married-couple families in Magnolia borough show that 2.0% or 15 of the total 761 families live below the poverty line. Families with no children have the highest poverty rate of 3.2%, comprising of 15 families. On the other hand, families with 1 or 2 children have the lowest poverty rate of 0.0%, which includes 0 families.
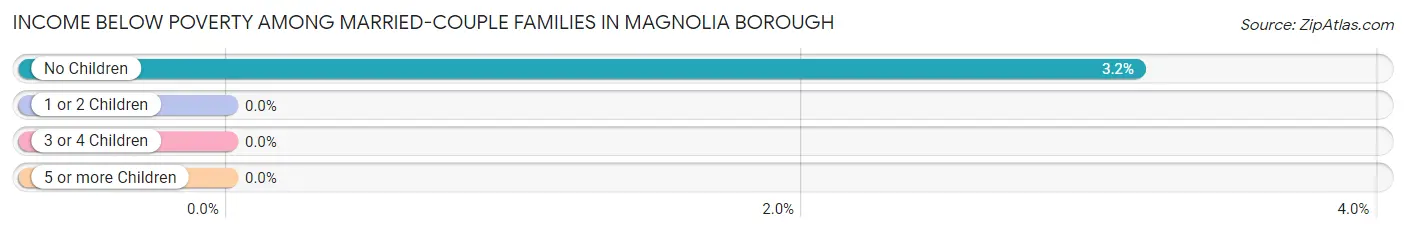
| Children | Above Poverty | Below Poverty |
| No Children | 460 (96.8%) | 15 (3.2%) |
| 1 or 2 Children | 232 (100.0%) | 0 (0.0%) |
| 3 or 4 Children | 54 (100.0%) | 0 (0.0%) |
| 5 or more Children | 0 (0.0%) | 0 (0.0%) |
| Total | 746 (98.0%) | 15 (2.0%) |
Income Below Poverty Among Single-Parent Households in Magnolia borough
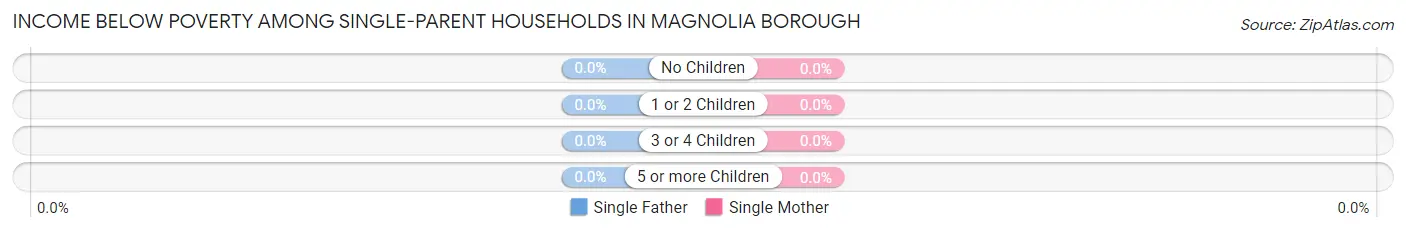
| Children | Single Father | Single Mother |
| No Children | 0 (0.0%) | 0 (0.0%) |
| 1 or 2 Children | 0 (0.0%) | 0 (0.0%) |
| 3 or 4 Children | 0 (0.0%) | 0 (0.0%) |
| 5 or more Children | 0 (0.0%) | 0 (0.0%) |
| Total | 0 (0.0%) | 0 (0.0%) |
Income Below Poverty Among Married-Couple vs Single-Parent Households in Magnolia borough
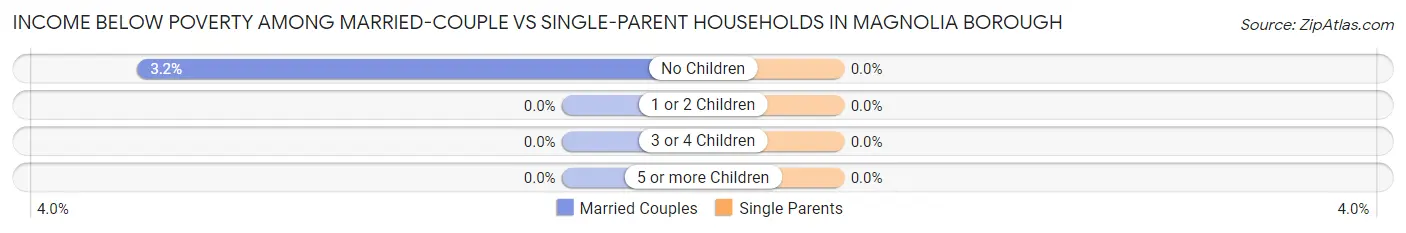
| Children | Married-Couple Families | Single-Parent Households |
| No Children | 15 (3.2%) | 0 (0.0%) |
| 1 or 2 Children | 0 (0.0%) | 0 (0.0%) |
| 3 or 4 Children | 0 (0.0%) | 0 (0.0%) |
| 5 or more Children | 0 (0.0%) | 0 (0.0%) |
| Total | 15 (2.0%) | 0 (0.0%) |
Race in Magnolia borough
The most populous races in Magnolia borough are White / Caucasian (2,795 | 64.4%), Black / African American (801 | 18.4%), and Hispanic or Latino (628 | 14.5%).
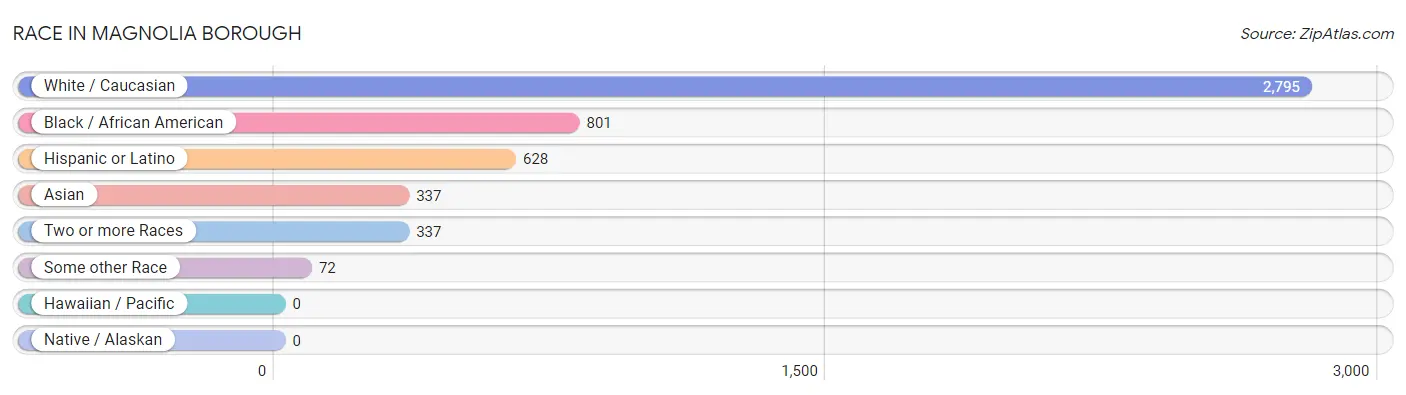
| Race | # Population | % Population |
| Asian | 337 | 7.8% |
| Black / African American | 801 | 18.4% |
| Hawaiian / Pacific | 0 | 0.0% |
| Hispanic or Latino | 628 | 14.5% |
| Native / Alaskan | 0 | 0.0% |
| White / Caucasian | 2,795 | 64.4% |
| Two or more Races | 337 | 7.8% |
| Some other Race | 72 | 1.7% |
| Total | 4,342 | 100.0% |
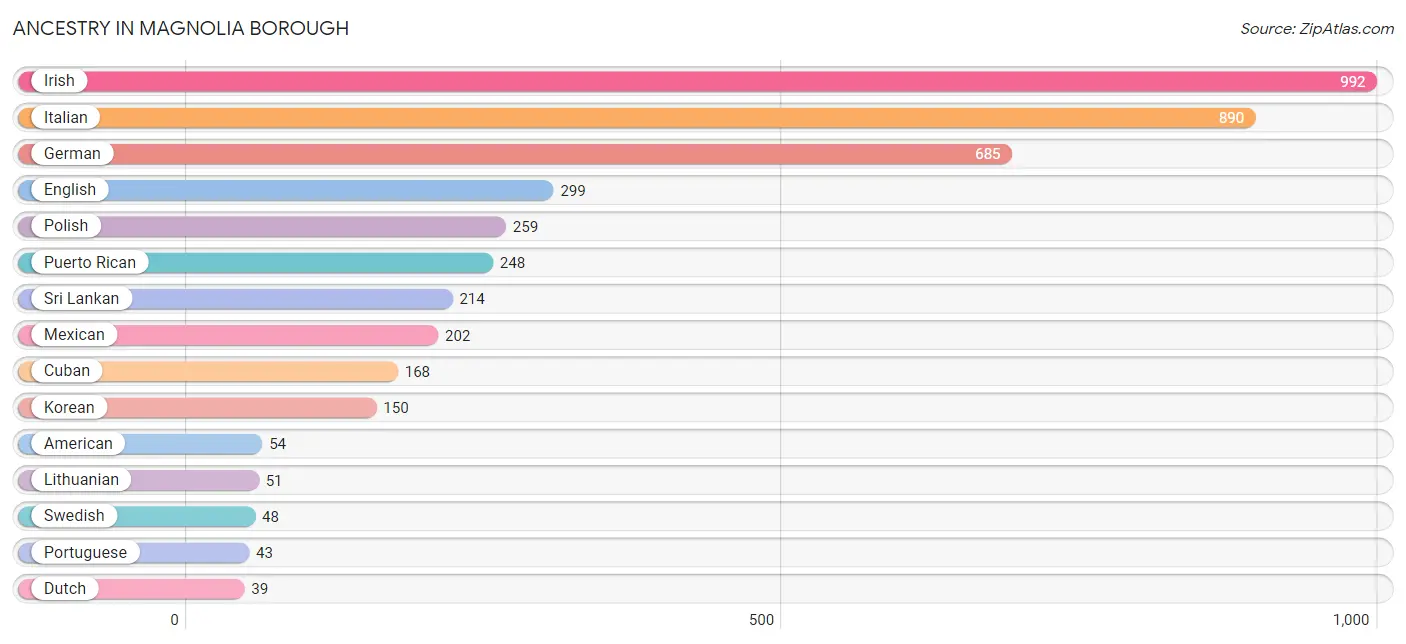
Ancestry in Magnolia borough
The most populous ancestries reported in Magnolia borough are Irish (992 | 22.9%), Italian (890 | 20.5%), German (685 | 15.8%), English (299 | 6.9%), and Polish (259 | 6.0%), together accounting for 72.0% of all Magnolia borough residents.
| Ancestry | # Population | % Population |
| American | 54 | 1.2% |
| Austrian | 33 | 0.8% |
| British West Indian | 18 | 0.4% |
| Burmese | 9 | 0.2% |
| Central American | 10 | 0.2% |
| Costa Rican | 10 | 0.2% |
| Croatian | 13 | 0.3% |
| Cuban | 168 | 3.9% |
| Dutch | 39 | 0.9% |
| Eastern European | 11 | 0.3% |
| English | 299 | 6.9% |
| European | 13 | 0.3% |
| Filipino | 10 | 0.2% |
| French | 36 | 0.8% |
| German | 685 | 15.8% |
| Ghanaian | 19 | 0.4% |
| Haitian | 18 | 0.4% |
| Hungarian | 13 | 0.3% |
| Indian (Asian) | 9 | 0.2% |
| Irish | 992 | 22.9% |
| Italian | 890 | 20.5% |
| Jamaican | 29 | 0.7% |
| Korean | 150 | 3.5% |
| Lithuanian | 51 | 1.2% |
| Mexican | 202 | 4.6% |
| Norwegian | 20 | 0.5% |
| Pennsylvania German | 5 | 0.1% |
| Polish | 259 | 6.0% |
| Portuguese | 43 | 1.0% |
| Puerto Rican | 248 | 5.7% |
| Russian | 9 | 0.2% |
| Scottish | 22 | 0.5% |
| Slovak | 19 | 0.4% |
| Sri Lankan | 214 | 4.9% |
| Subsaharan African | 19 | 0.4% |
| Swedish | 48 | 1.1% |
| Ukrainian | 7 | 0.2% |
| Welsh | 7 | 0.2% | View All 38 Rows |
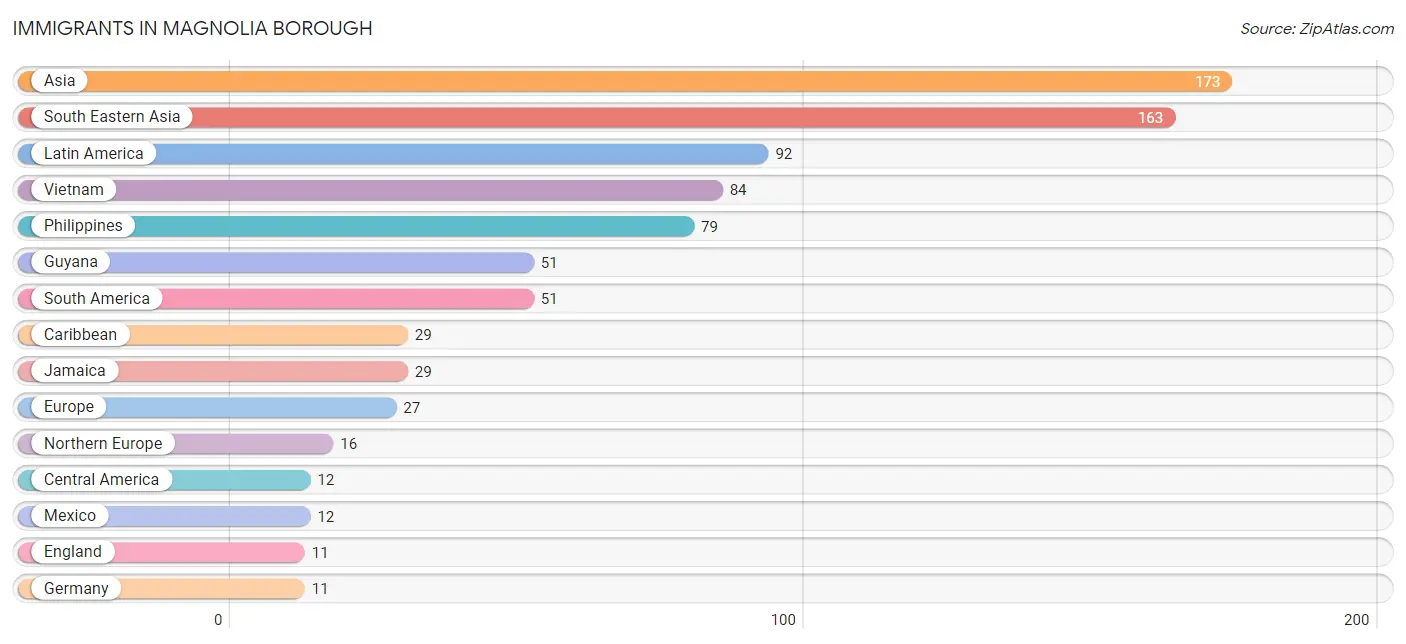
Immigrants in Magnolia borough
The most numerous immigrant groups reported in Magnolia borough came from Asia (173 | 4.0%), South Eastern Asia (163 | 3.7%), Latin America (92 | 2.1%), Vietnam (84 | 1.9%), and Philippines (79 | 1.8%), together accounting for 13.6% of all Magnolia borough residents.
| Immigration Origin | # Population | % Population |
| Asia | 173 | 4.0% |
| Caribbean | 29 | 0.7% |
| Central America | 12 | 0.3% |
| China | 10 | 0.2% |
| Eastern Asia | 10 | 0.2% |
| England | 11 | 0.3% |
| Europe | 27 | 0.6% |
| Germany | 11 | 0.3% |
| Guyana | 51 | 1.2% |
| Jamaica | 29 | 0.7% |
| Latin America | 92 | 2.1% |
| Mexico | 12 | 0.3% |
| Northern Europe | 16 | 0.4% |
| Philippines | 79 | 1.8% |
| South America | 51 | 1.2% |
| South Eastern Asia | 163 | 3.7% |
| Taiwan | 10 | 0.2% |
| Vietnam | 84 | 1.9% |
| Western Europe | 11 | 0.3% | View All 19 Rows |
Sex and Age in Magnolia borough
Sex and Age in Magnolia borough
The most populous age groups in Magnolia borough are 30 to 34 Years (349 | 16.3%) for men and 30 to 34 Years (244 | 11.1%) for women.
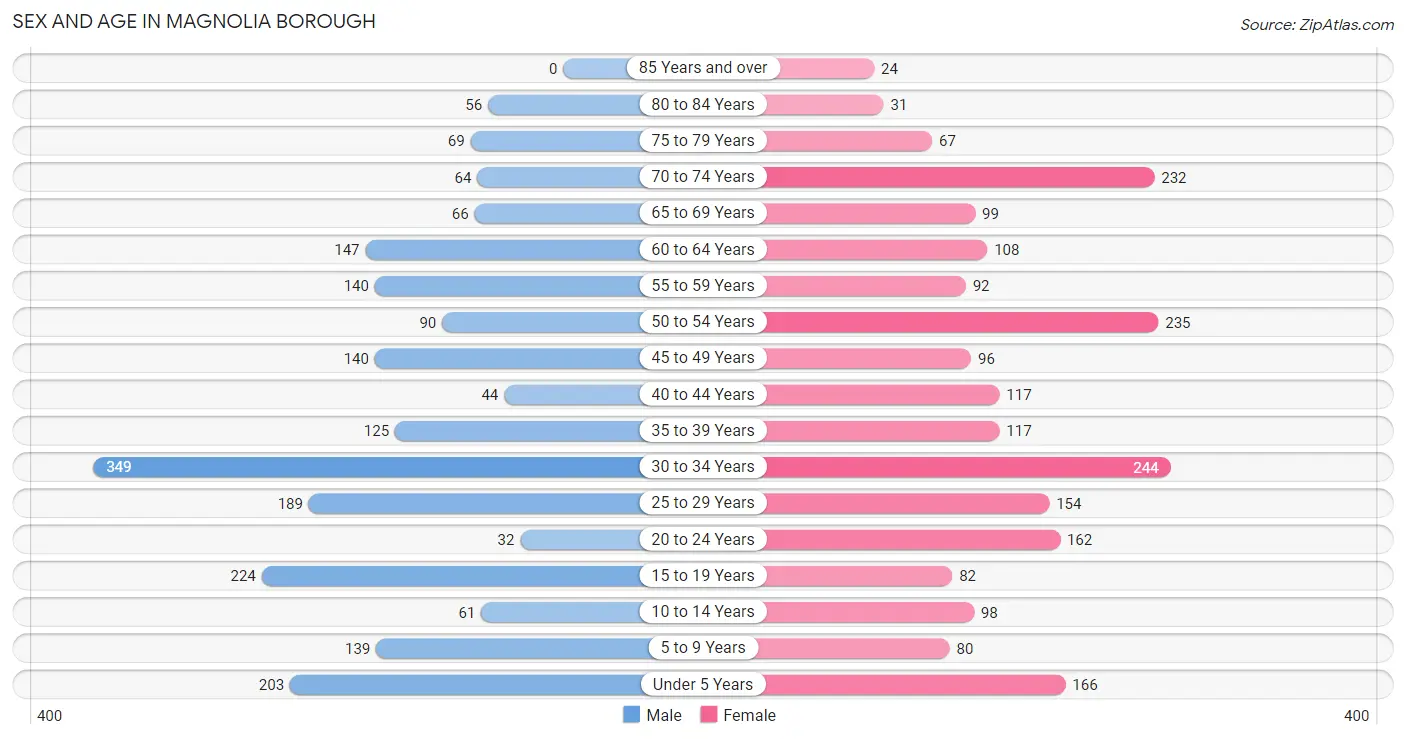
| Age Bracket | Male | Female |
| Under 5 Years | 203 (9.5%) | 166 (7.5%) |
| 5 to 9 Years | 139 (6.5%) | 80 (3.6%) |
| 10 to 14 Years | 61 (2.9%) | 98 (4.4%) |
| 15 to 19 Years | 224 (10.5%) | 82 (3.7%) |
| 20 to 24 Years | 32 (1.5%) | 162 (7.3%) |
| 25 to 29 Years | 189 (8.8%) | 154 (7.0%) |
| 30 to 34 Years | 349 (16.3%) | 244 (11.1%) |
| 35 to 39 Years | 125 (5.9%) | 117 (5.3%) |
| 40 to 44 Years | 44 (2.1%) | 117 (5.3%) |
| 45 to 49 Years | 140 (6.6%) | 96 (4.4%) |
| 50 to 54 Years | 90 (4.2%) | 235 (10.7%) |
| 55 to 59 Years | 140 (6.6%) | 92 (4.2%) |
| 60 to 64 Years | 147 (6.9%) | 108 (4.9%) |
| 65 to 69 Years | 66 (3.1%) | 99 (4.5%) |
| 70 to 74 Years | 64 (3.0%) | 232 (10.5%) |
| 75 to 79 Years | 69 (3.2%) | 67 (3.0%) |
| 80 to 84 Years | 56 (2.6%) | 31 (1.4%) |
| 85 Years and over | 0 (0.0%) | 24 (1.1%) |
| Total | 2,138 (100.0%) | 2,204 (100.0%) |
Families and Households in Magnolia borough
Median Family Size in Magnolia borough
The median family size in Magnolia borough is 3.15 persons per family, with married-couple families (761 | 74.2%) accounting for the largest median family size of 3.27 persons per family. On the other hand, single male/father families (73 | 7.1%) represent the smallest median family size with 2.74 persons per family.
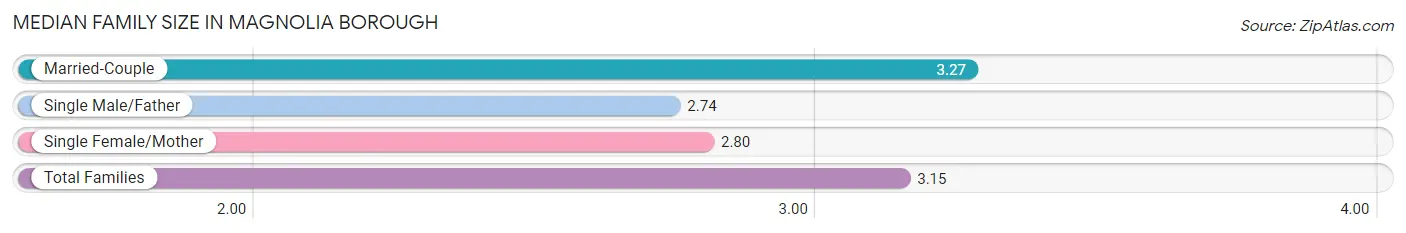
| Family Type | # Families | Family Size |
| Married-Couple | 761 (74.2%) | 3.27 |
| Single Male/Father | 73 (7.1%) | 2.74 |
| Single Female/Mother | 191 (18.6%) | 2.80 |
| Total Families | 1,025 (100.0%) | 3.15 |
Median Household Size in Magnolia borough
The median household size in Magnolia borough is 2.43 persons per household, with single male/father households (73 | 4.1%) accounting for the largest median household size of 3.36 persons per household. non-family households (759 | 42.5%) represent the smallest median household size with 1.24 persons per household.
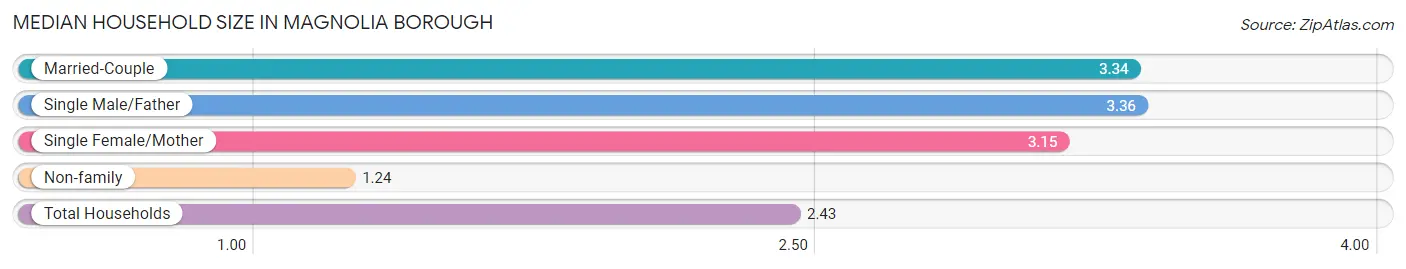
| Household Type | # Households | Household Size |
| Married-Couple | 761 (42.7%) | 3.34 |
| Single Male/Father | 73 (4.1%) | 3.36 |
| Single Female/Mother | 191 (10.7%) | 3.15 |
| Non-family | 759 (42.5%) | 1.24 |
| Total Households | 1,784 (100.0%) | 2.43 |
Household Size by Marriage Status in Magnolia borough
Out of a total of 1,784 households in Magnolia borough, 1,025 (57.5%) are family households, while 759 (42.5%) are nonfamily households. The most numerous type of family households are 2-person households, comprising 385, and the most common type of nonfamily households are 1-person households, comprising 581.
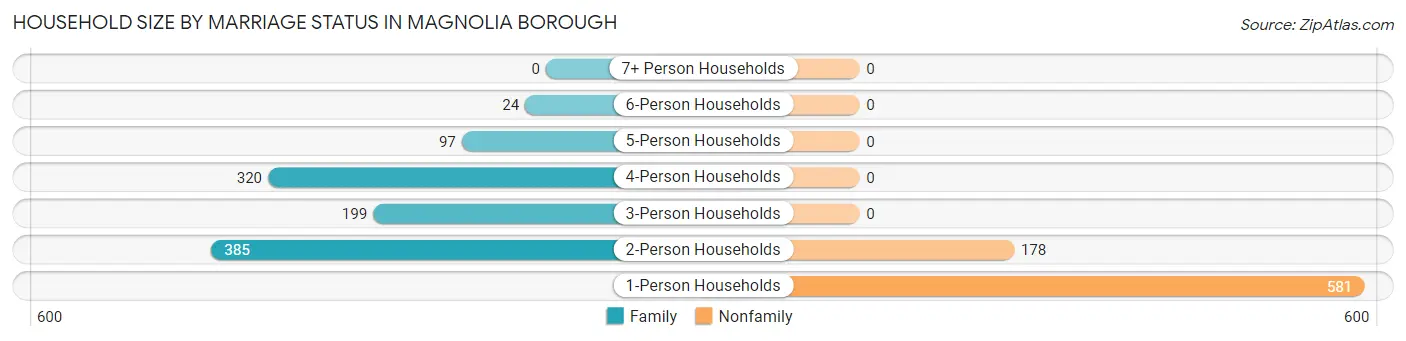
| Household Size | Family Households | Nonfamily Households |
| 1-Person Households | - | 581 (32.6%) |
| 2-Person Households | 385 (21.6%) | 178 (10.0%) |
| 3-Person Households | 199 (11.2%) | 0 (0.0%) |
| 4-Person Households | 320 (17.9%) | 0 (0.0%) |
| 5-Person Households | 97 (5.4%) | 0 (0.0%) |
| 6-Person Households | 24 (1.3%) | 0 (0.0%) |
| 7+ Person Households | 0 (0.0%) | 0 (0.0%) |
| Total | 1,025 (57.5%) | 759 (42.5%) |
Female Fertility in Magnolia borough
Fertility by Age in Magnolia borough
Average fertility rate in Magnolia borough is 35.0 births per 1,000 women. Women in the age bracket of 20 to 34 years have the highest fertility rate with 63.0 births per 1,000 women. Women in the age bracket of 20 to 34 years acount for 100.0% of all women with births.
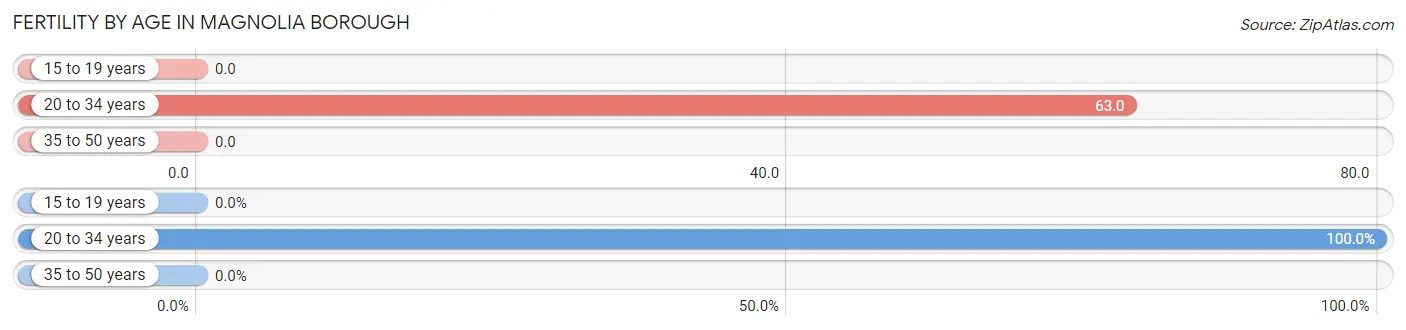
| Age Bracket | Women with Births | Births / 1,000 Women |
| 15 to 19 years | 0 (0.0%) | 0.0 |
| 20 to 34 years | 35 (100.0%) | 63.0 |
| 35 to 50 years | 0 (0.0%) | 0.0 |
| Total | 35 (100.0%) | 35.0 |
Fertility by Age by Marriage Status in Magnolia borough
22.9% of women with births (35) in Magnolia borough are married. The highest percentage of unmarried women with births falls into 20 to 34 years age bracket with 77.1% of them unmarried at the time of birth, while the lowest percentage of unmarried women with births belong to 20 to 34 years age bracket with 77.1% of them unmarried.
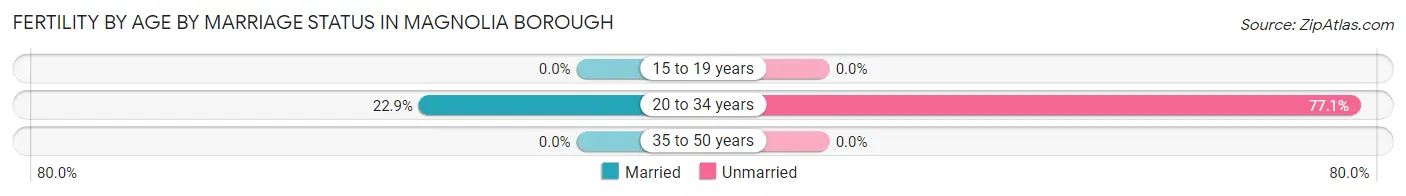
| Age Bracket | Married | Unmarried |
| 15 to 19 years | 0 (0.0%) | 0 (0.0%) |
| 20 to 34 years | 8 (22.9%) | 27 (77.1%) |
| 35 to 50 years | 0 (0.0%) | 0 (0.0%) |
| Total | 8 (22.9%) | 27 (77.1%) |
Fertility by Education in Magnolia borough
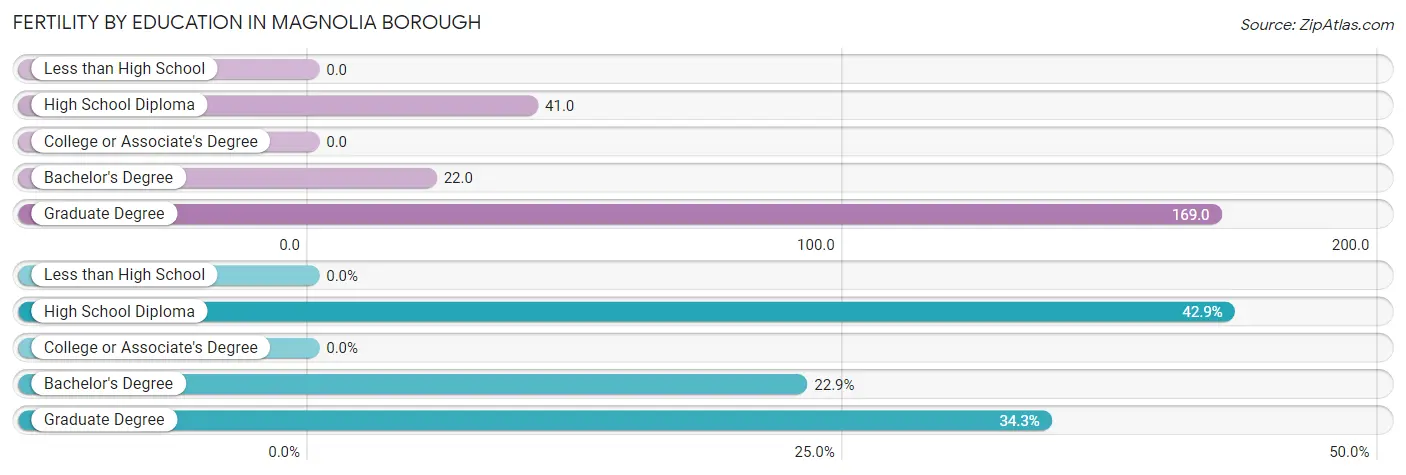
| Educational Attainment | Women with Births | Births / 1,000 Women |
| Less than High School | 0 (0.0%) | 0.0 |
| High School Diploma | 15 (42.9%) | 41.0 |
| College or Associate's Degree | 0 (0.0%) | 0.0 |
| Bachelor's Degree | 8 (22.9%) | 22.0 |
| Graduate Degree | 12 (34.3%) | 169.0 |
| Total | 35 (100.0%) | 35.0 |
Fertility by Education by Marriage Status in Magnolia borough
77.1% of women with births in Magnolia borough are unmarried. Women with the educational attainment of bachelor's degree are most likely to be married with 100.0% of them married at childbirth, while women with the educational attainment of high school diploma are least likely to be married with 100.0% of them unmarried at childbirth.
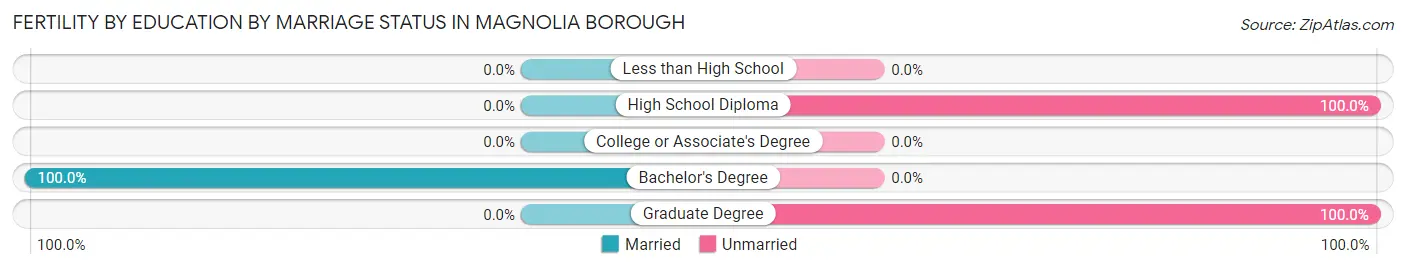
| Educational Attainment | Married | Unmarried |
| Less than High School | 0 (0.0%) | 0 (0.0%) |
| High School Diploma | 0 (0.0%) | 15 (100.0%) |
| College or Associate's Degree | 0 (0.0%) | 0 (0.0%) |
| Bachelor's Degree | 8 (100.0%) | 0 (0.0%) |
| Graduate Degree | 0 (0.0%) | 12 (100.0%) |
| Total | 8 (22.9%) | 27 (77.1%) |
Employment Characteristics in Magnolia borough
Employment by Class of Employer in Magnolia borough
Among the 2,367 employed individuals in Magnolia borough, private company employees (1,845 | 77.9%), not-for-profit organizations (171 | 7.2%), and state government employees (115 | 4.9%) make up the most common classes of employment.
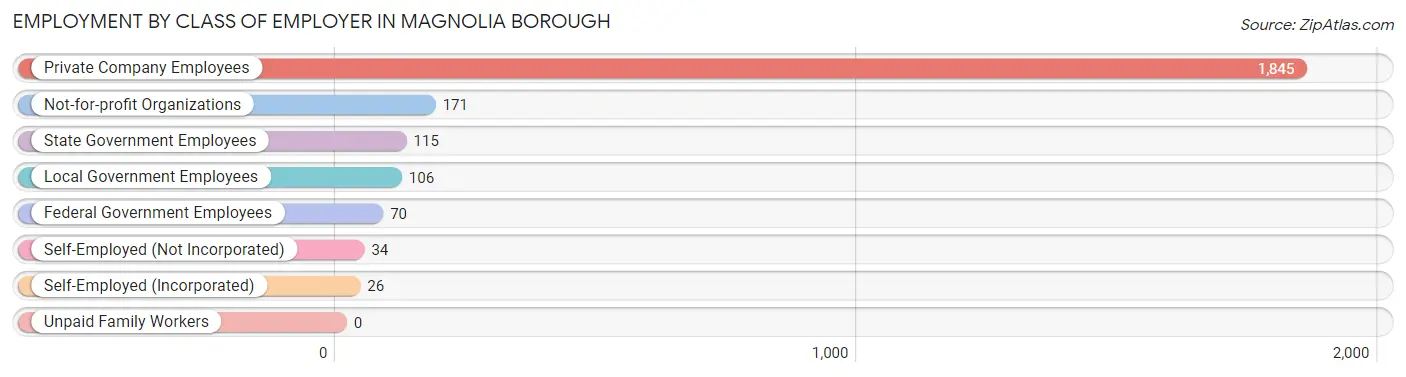
| Employer Class | # Employees | % Employees |
| Private Company Employees | 1,845 | 77.9% |
| Self-Employed (Incorporated) | 26 | 1.1% |
| Self-Employed (Not Incorporated) | 34 | 1.4% |
| Not-for-profit Organizations | 171 | 7.2% |
| Local Government Employees | 106 | 4.5% |
| State Government Employees | 115 | 4.9% |
| Federal Government Employees | 70 | 3.0% |
| Unpaid Family Workers | 0 | 0.0% |
| Total | 2,367 | 100.0% |
Employment Status by Age in Magnolia borough
According to the labor force statistics for Magnolia borough, out of the total population over 16 years of age (3,500), 75.9% or 2,656 individuals are in the labor force, with 7.5% or 199 of them unemployed. The age group with the highest labor force participation rate is 35 to 44 years, with 98.3% or 396 individuals in the labor force. Within the labor force, the 75 years and over age range has the highest percentage of unemployed individuals, with 72.2% or 13 of them being unemployed.
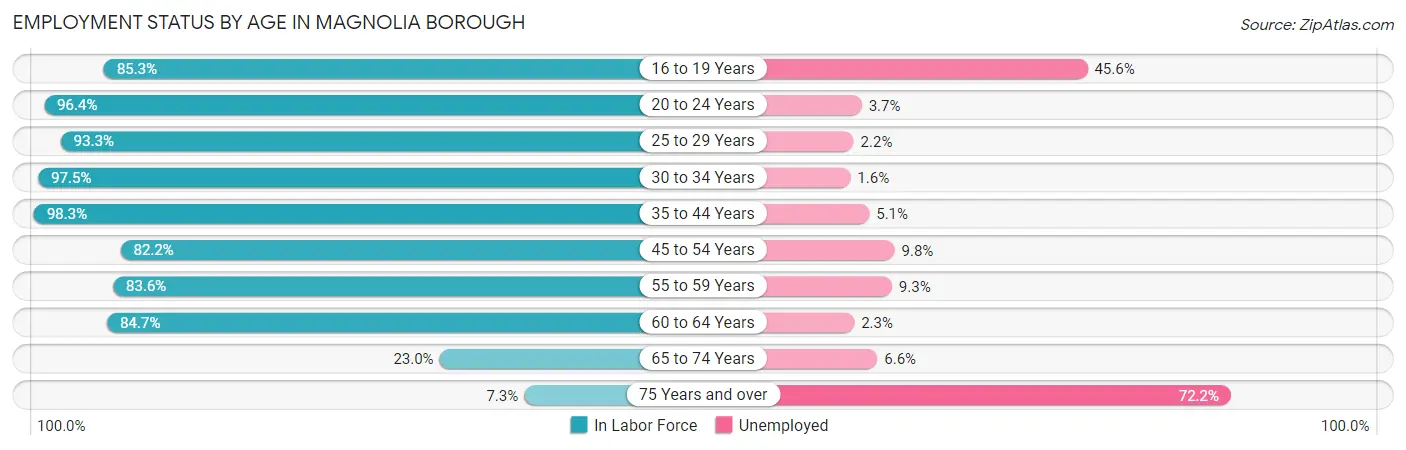
| Age Bracket | In Labor Force | Unemployed |
| 16 to 19 Years | 180 (85.3%) | 82 (45.6%) |
| 20 to 24 Years | 187 (96.4%) | 7 (3.7%) |
| 25 to 29 Years | 320 (93.3%) | 7 (2.2%) |
| 30 to 34 Years | 578 (97.5%) | 9 (1.6%) |
| 35 to 44 Years | 396 (98.3%) | 20 (5.1%) |
| 45 to 54 Years | 461 (82.2%) | 45 (9.8%) |
| 55 to 59 Years | 194 (83.6%) | 18 (9.3%) |
| 60 to 64 Years | 216 (84.7%) | 5 (2.3%) |
| 65 to 74 Years | 106 (23.0%) | 7 (6.6%) |
| 75 Years and over | 18 (7.3%) | 13 (72.2%) |
| Total | 2,656 (75.9%) | 199 (7.5%) |
Employment Status by Educational Attainment in Magnolia borough
According to labor force statistics for Magnolia borough, 90.7% of individuals (2,165) out of the total population between 25 and 64 years of age (2,387) are in the labor force, with 4.8% or 104 of them being unemployed. The group with the highest labor force participation rate are those with the educational attainment of bachelor's degree or higher, with 96.5% or 867 individuals in the labor force. Within the labor force, individuals with less than high school education have the highest percentage of unemployment, with 16.8% or 16 of them being unemployed.
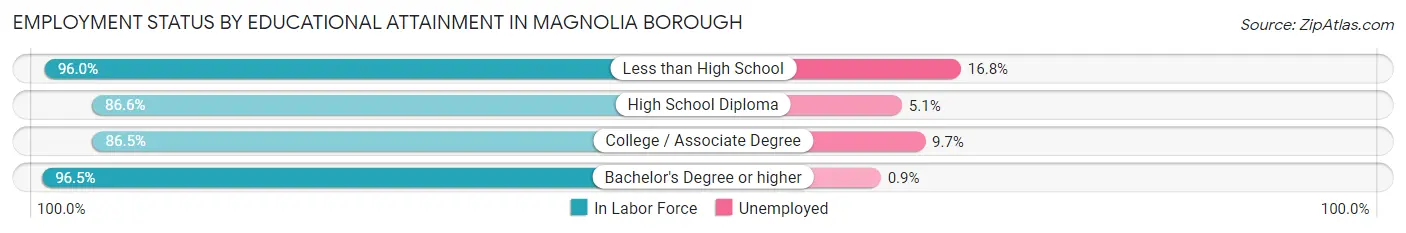
| Educational Attainment | In Labor Force | Unemployed |
| Less than High School | 95 (96.0%) | 17 (16.8%) |
| High School Diploma | 800 (86.6%) | 47 (5.1%) |
| College / Associate Degree | 403 (86.5%) | 45 (9.7%) |
| Bachelor's Degree or higher | 867 (96.5%) | 8 (0.9%) |
| Total | 2,165 (90.7%) | 115 (4.8%) |
Employment Occupations by Sex in Magnolia borough
Management, Business, Science and Arts Occupations
The most common Management, Business, Science and Arts occupations in Magnolia borough are Community & Social Service (437 | 18.0%), Education Instruction & Library (342 | 14.1%), Computers, Engineering & Science (239 | 9.9%), Health Diagnosing & Treating (156 | 6.4%), and Business & Financial (148 | 6.1%).
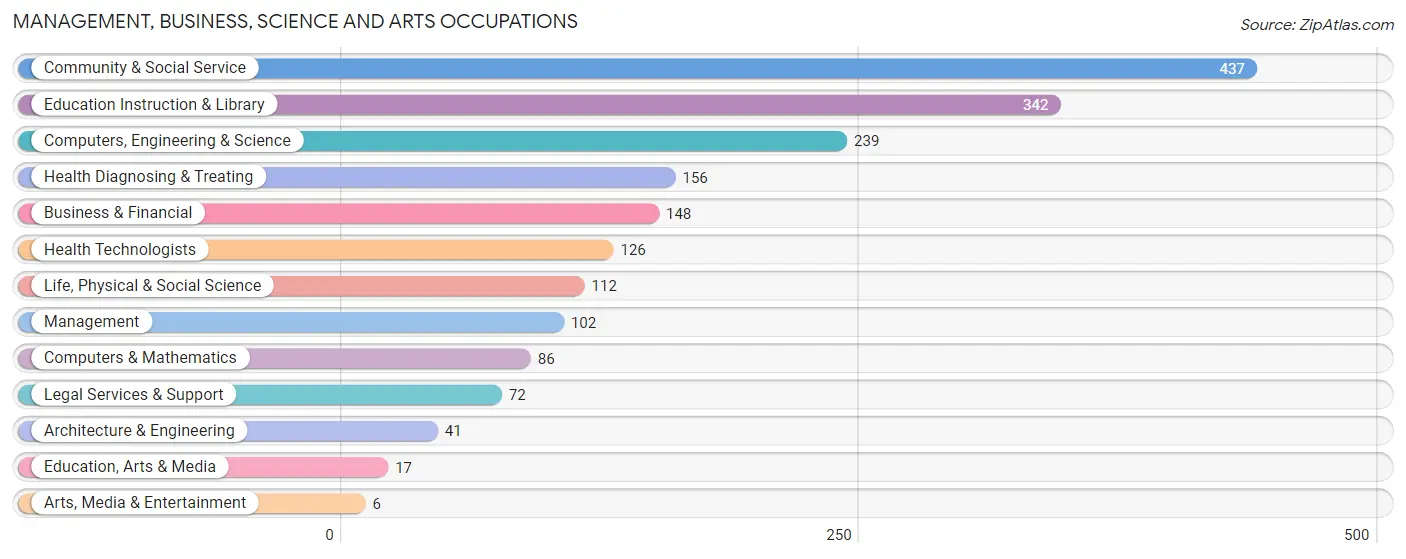
Management, Business, Science and Arts Occupations by Sex
Within the Management, Business, Science and Arts occupations in Magnolia borough, the most male-oriented occupations are Arts, Media & Entertainment (100.0%), Life, Physical & Social Science (92.9%), and Computers & Mathematics (88.4%), while the most female-oriented occupations are Legal Services & Support (100.0%), Health Diagnosing & Treating (100.0%), and Health Technologists (100.0%).
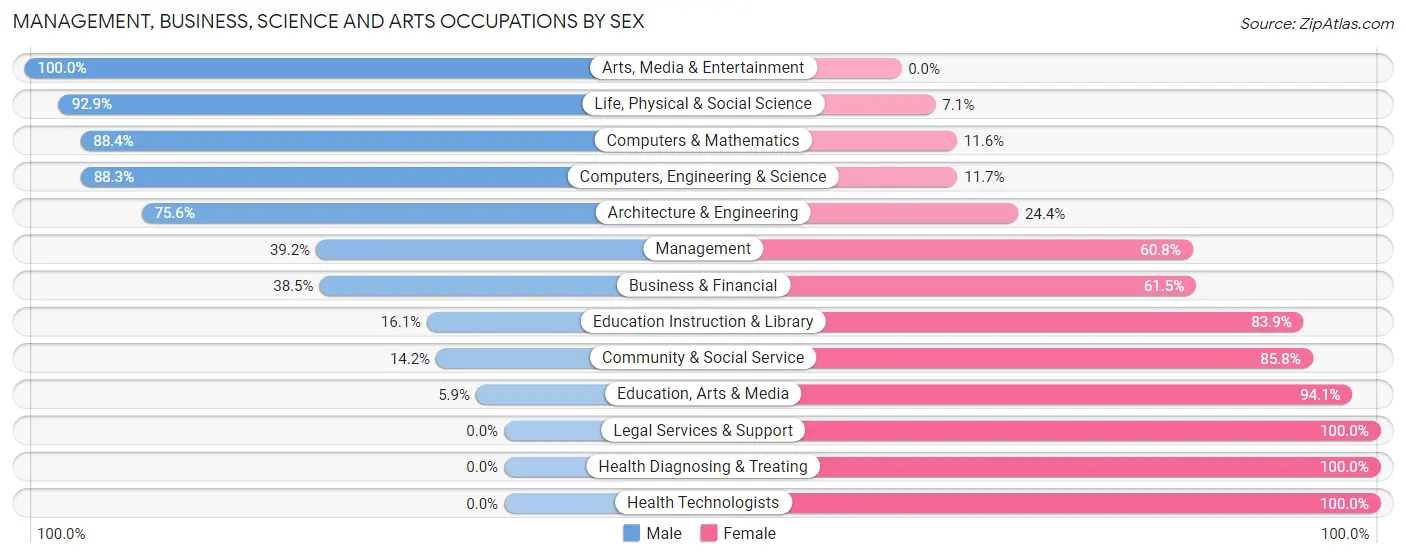
| Occupation | Male | Female |
| Management | 40 (39.2%) | 62 (60.8%) |
| Business & Financial | 57 (38.5%) | 91 (61.5%) |
| Computers, Engineering & Science | 211 (88.3%) | 28 (11.7%) |
| Computers & Mathematics | 76 (88.4%) | 10 (11.6%) |
| Architecture & Engineering | 31 (75.6%) | 10 (24.4%) |
| Life, Physical & Social Science | 104 (92.9%) | 8 (7.1%) |
| Community & Social Service | 62 (14.2%) | 375 (85.8%) |
| Education, Arts & Media | 1 (5.9%) | 16 (94.1%) |
| Legal Services & Support | 0 (0.0%) | 72 (100.0%) |
| Education Instruction & Library | 55 (16.1%) | 287 (83.9%) |
| Arts, Media & Entertainment | 6 (100.0%) | 0 (0.0%) |
| Health Diagnosing & Treating | 0 (0.0%) | 156 (100.0%) |
| Health Technologists | 0 (0.0%) | 126 (100.0%) |
| Total (Category) | 370 (34.2%) | 712 (65.8%) |
| Total (Overall) | 1,149 (47.4%) | 1,276 (52.6%) |
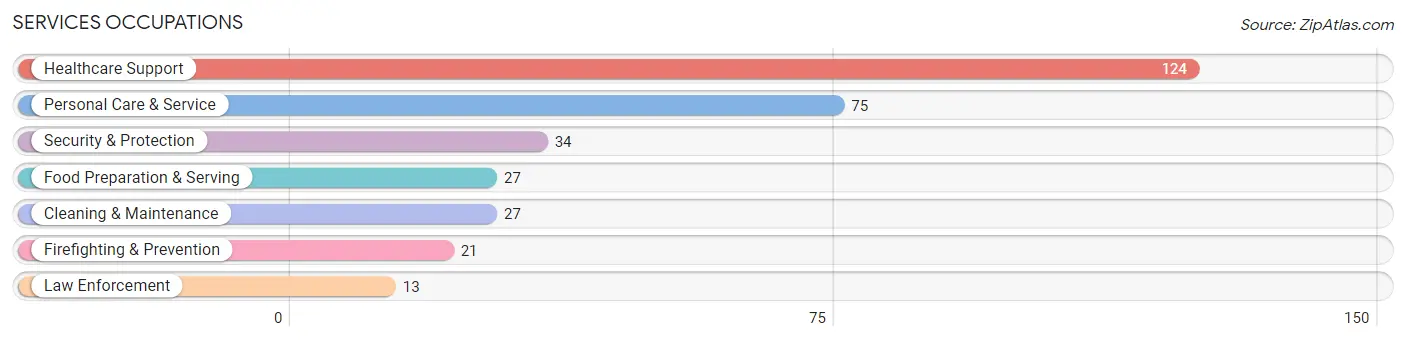
Services Occupations
The most common Services occupations in Magnolia borough are Healthcare Support (124 | 5.1%), Personal Care & Service (75 | 3.1%), Security & Protection (34 | 1.4%), Food Preparation & Serving (27 | 1.1%), and Cleaning & Maintenance (27 | 1.1%).
Services Occupations by Sex
Within the Services occupations in Magnolia borough, the most male-oriented occupations are Security & Protection (100.0%), Firefighting & Prevention (100.0%), and Law Enforcement (100.0%), while the most female-oriented occupations are Food Preparation & Serving (74.1%), Personal Care & Service (58.7%), and Healthcare Support (50.8%).
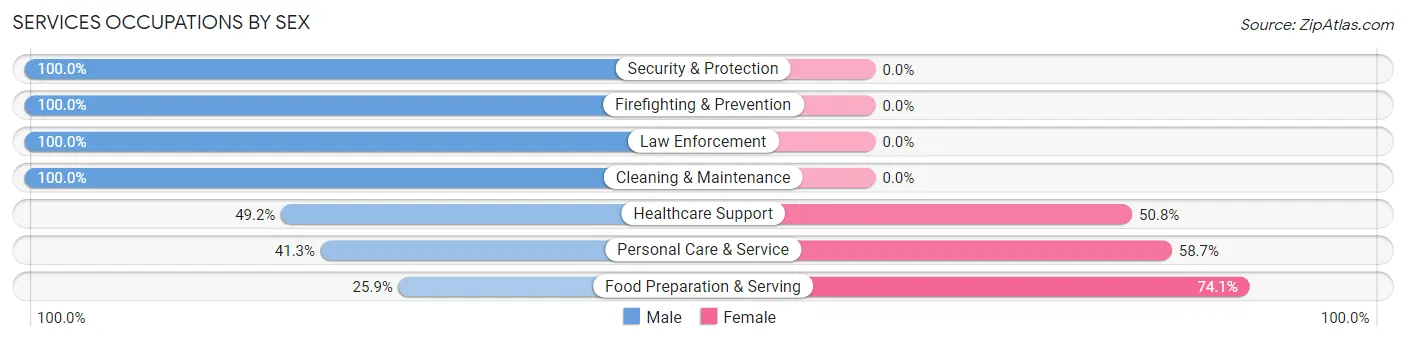
| Occupation | Male | Female |
| Healthcare Support | 61 (49.2%) | 63 (50.8%) |
| Security & Protection | 34 (100.0%) | 0 (0.0%) |
| Firefighting & Prevention | 21 (100.0%) | 0 (0.0%) |
| Law Enforcement | 13 (100.0%) | 0 (0.0%) |
| Food Preparation & Serving | 7 (25.9%) | 20 (74.1%) |
| Cleaning & Maintenance | 27 (100.0%) | 0 (0.0%) |
| Personal Care & Service | 31 (41.3%) | 44 (58.7%) |
| Total (Category) | 160 (55.7%) | 127 (44.3%) |
| Total (Overall) | 1,149 (47.4%) | 1,276 (52.6%) |
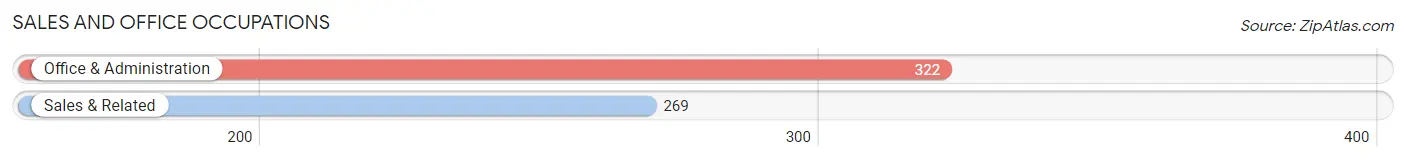
Sales and Office Occupations
The most common Sales and Office occupations in Magnolia borough are Office & Administration (322 | 13.3%), and Sales & Related (269 | 11.1%).
Sales and Office Occupations by Sex
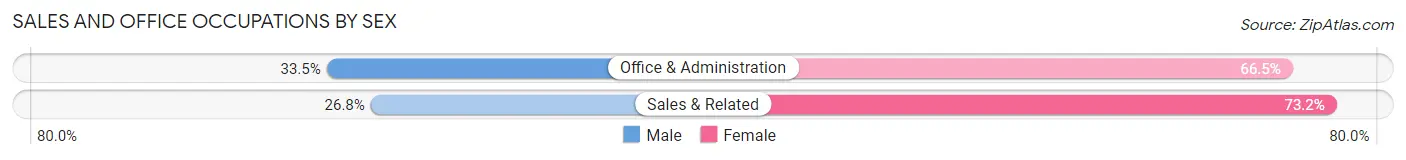
| Occupation | Male | Female |
| Sales & Related | 72 (26.8%) | 197 (73.2%) |
| Office & Administration | 108 (33.5%) | 214 (66.5%) |
| Total (Category) | 180 (30.5%) | 411 (69.5%) |
| Total (Overall) | 1,149 (47.4%) | 1,276 (52.6%) |
Natural Resources, Construction and Maintenance Occupations
The most common Natural Resources, Construction and Maintenance occupations in Magnolia borough are Construction & Extraction (108 | 4.4%), and Installation, Maintenance & Repair (93 | 3.8%).
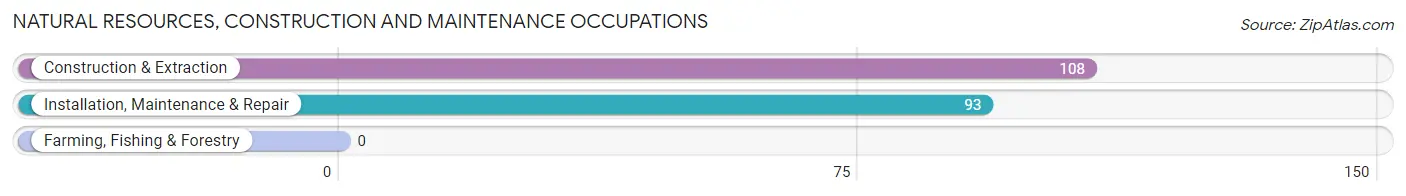
Natural Resources, Construction and Maintenance Occupations by Sex

| Occupation | Male | Female |
| Farming, Fishing & Forestry | 0 (0.0%) | 0 (0.0%) |
| Construction & Extraction | 108 (100.0%) | 0 (0.0%) |
| Installation, Maintenance & Repair | 93 (100.0%) | 0 (0.0%) |
| Total (Category) | 201 (100.0%) | 0 (0.0%) |
| Total (Overall) | 1,149 (47.4%) | 1,276 (52.6%) |
Production, Transportation and Moving Occupations
The most common Production, Transportation and Moving occupations in Magnolia borough are Production (112 | 4.6%), Transportation (105 | 4.3%), and Material Moving (47 | 1.9%).
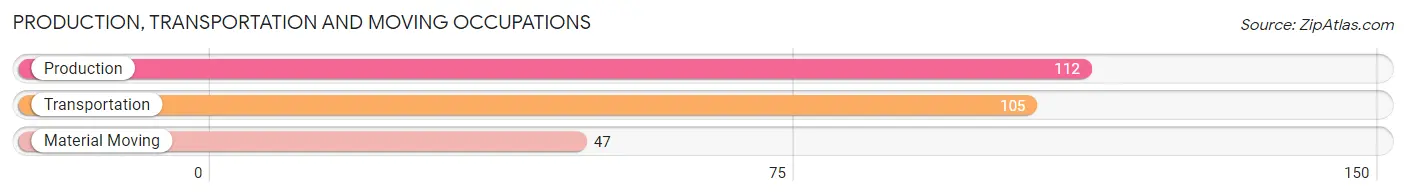
Production, Transportation and Moving Occupations by Sex
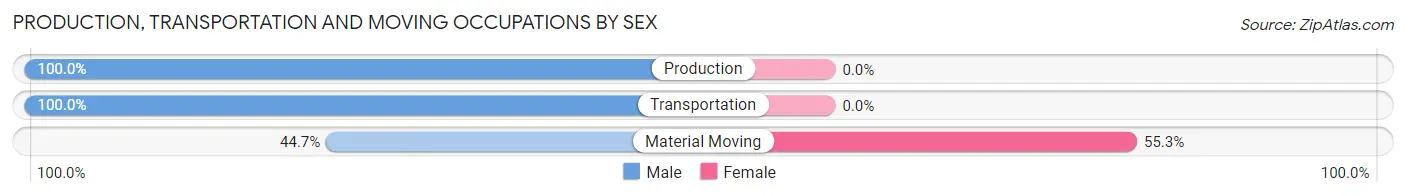
| Occupation | Male | Female |
| Production | 112 (100.0%) | 0 (0.0%) |
| Transportation | 105 (100.0%) | 0 (0.0%) |
| Material Moving | 21 (44.7%) | 26 (55.3%) |
| Total (Category) | 238 (90.1%) | 26 (9.9%) |
| Total (Overall) | 1,149 (47.4%) | 1,276 (52.6%) |
Employment Industries by Sex in Magnolia borough
Employment Industries in Magnolia borough
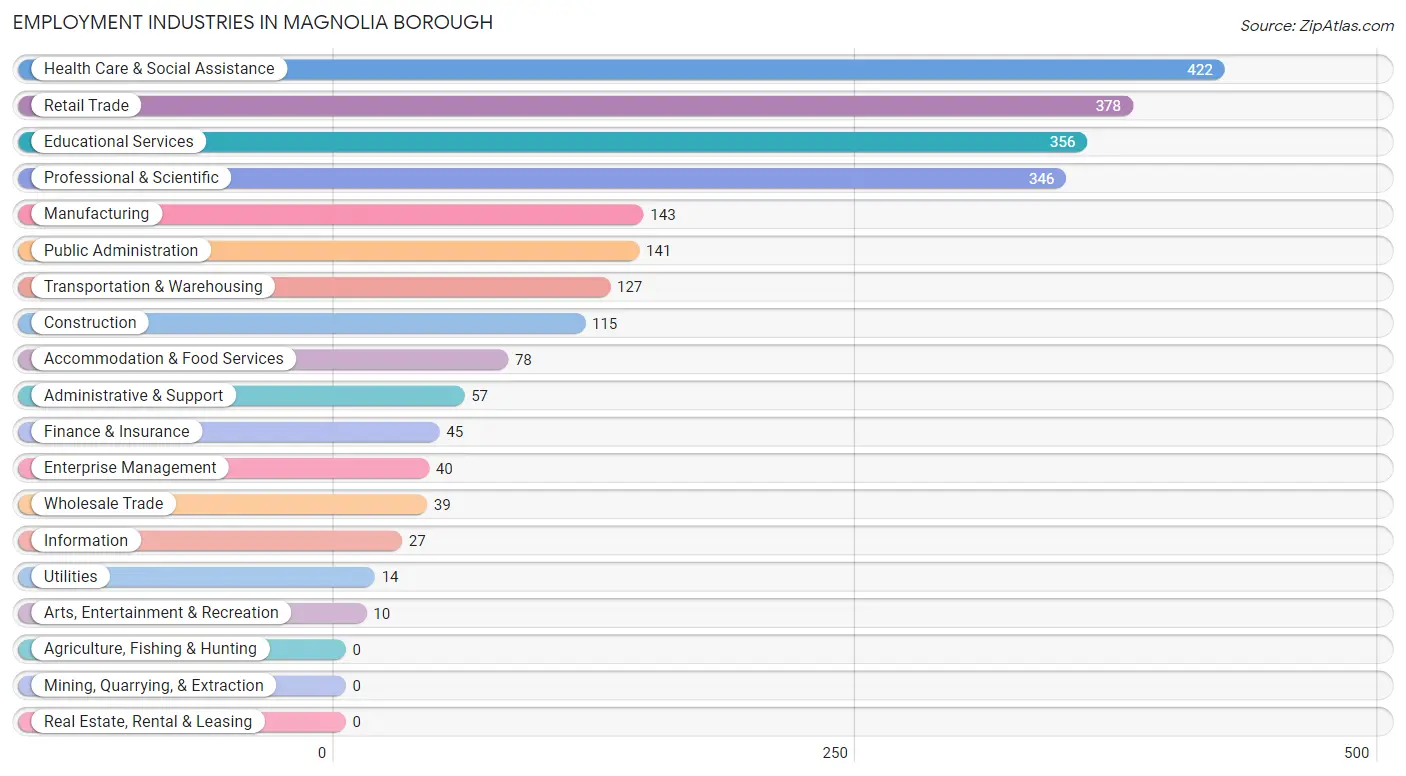
The major employment industries in Magnolia borough include Health Care & Social Assistance (422 | 17.4%), Retail Trade (378 | 15.6%), Educational Services (356 | 14.7%), Professional & Scientific (346 | 14.3%), and Manufacturing (143 | 5.9%).
Employment Industries by Sex in Magnolia borough
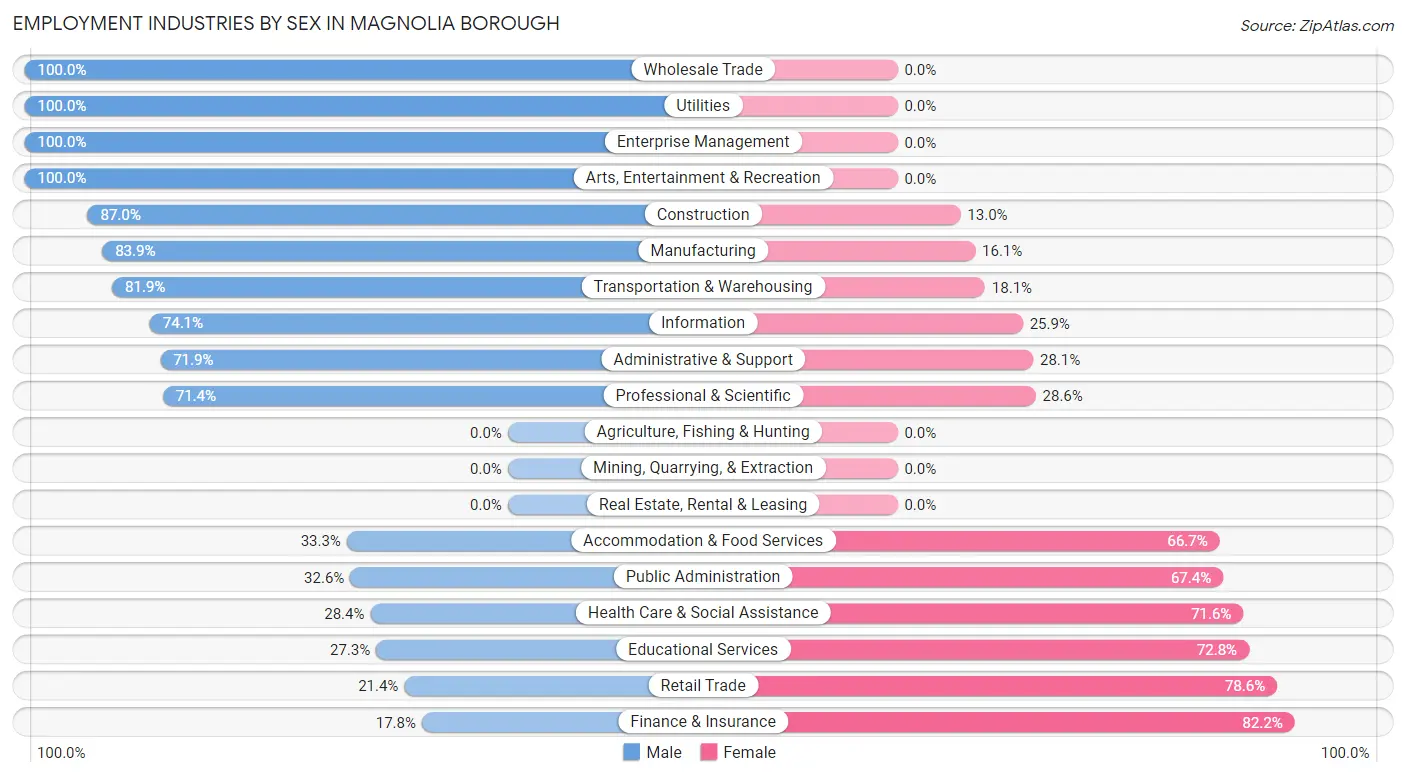
The Magnolia borough industries that see more men than women are Wholesale Trade (100.0%), Utilities (100.0%), and Enterprise Management (100.0%), whereas the industries that tend to have a higher number of women are Finance & Insurance (82.2%), Retail Trade (78.6%), and Educational Services (72.8%).
| Industry | Male | Female |
| Agriculture, Fishing & Hunting | 0 (0.0%) | 0 (0.0%) |
| Mining, Quarrying, & Extraction | 0 (0.0%) | 0 (0.0%) |
| Construction | 100 (87.0%) | 15 (13.0%) |
| Manufacturing | 120 (83.9%) | 23 (16.1%) |
| Wholesale Trade | 39 (100.0%) | 0 (0.0%) |
| Retail Trade | 81 (21.4%) | 297 (78.6%) |
| Transportation & Warehousing | 104 (81.9%) | 23 (18.1%) |
| Utilities | 14 (100.0%) | 0 (0.0%) |
| Information | 20 (74.1%) | 7 (25.9%) |
| Finance & Insurance | 8 (17.8%) | 37 (82.2%) |
| Real Estate, Rental & Leasing | 0 (0.0%) | 0 (0.0%) |
| Professional & Scientific | 247 (71.4%) | 99 (28.6%) |
| Enterprise Management | 40 (100.0%) | 0 (0.0%) |
| Administrative & Support | 41 (71.9%) | 16 (28.1%) |
| Educational Services | 97 (27.3%) | 259 (72.8%) |
| Health Care & Social Assistance | 120 (28.4%) | 302 (71.6%) |
| Arts, Entertainment & Recreation | 10 (100.0%) | 0 (0.0%) |
| Accommodation & Food Services | 26 (33.3%) | 52 (66.7%) |
| Public Administration | 46 (32.6%) | 95 (67.4%) |
| Total | 1,149 (47.4%) | 1,276 (52.6%) |
Education in Magnolia borough
School Enrollment in Magnolia borough
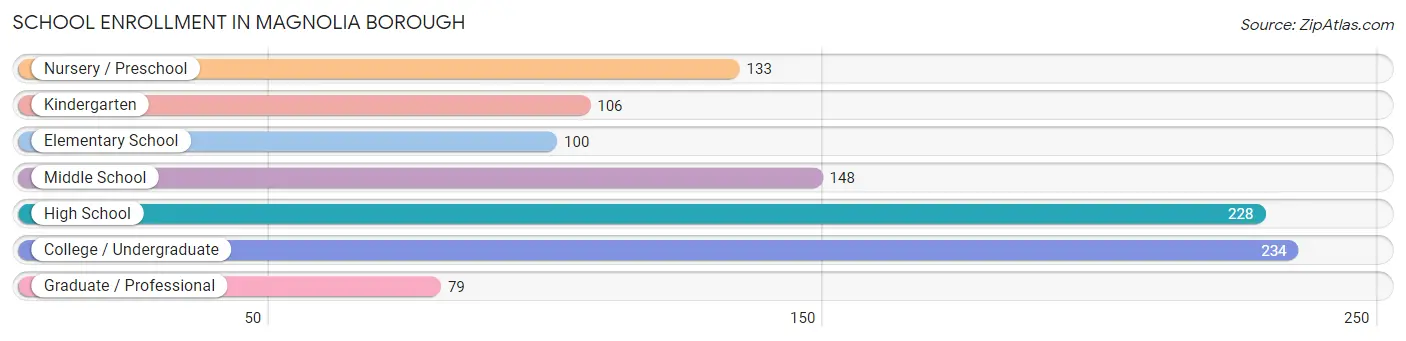
The most common levels of schooling among the 1,028 students in Magnolia borough are college / undergraduate (234 | 22.8%), high school (228 | 22.2%), and middle school (148 | 14.4%).
| School Level | # Students | % Students |
| Nursery / Preschool | 133 | 12.9% |
| Kindergarten | 106 | 10.3% |
| Elementary School | 100 | 9.7% |
| Middle School | 148 | 14.4% |
| High School | 228 | 22.2% |
| College / Undergraduate | 234 | 22.8% |
| Graduate / Professional | 79 | 7.7% |
| Total | 1,028 | 100.0% |
School Enrollment by Age by Funding Source in Magnolia borough
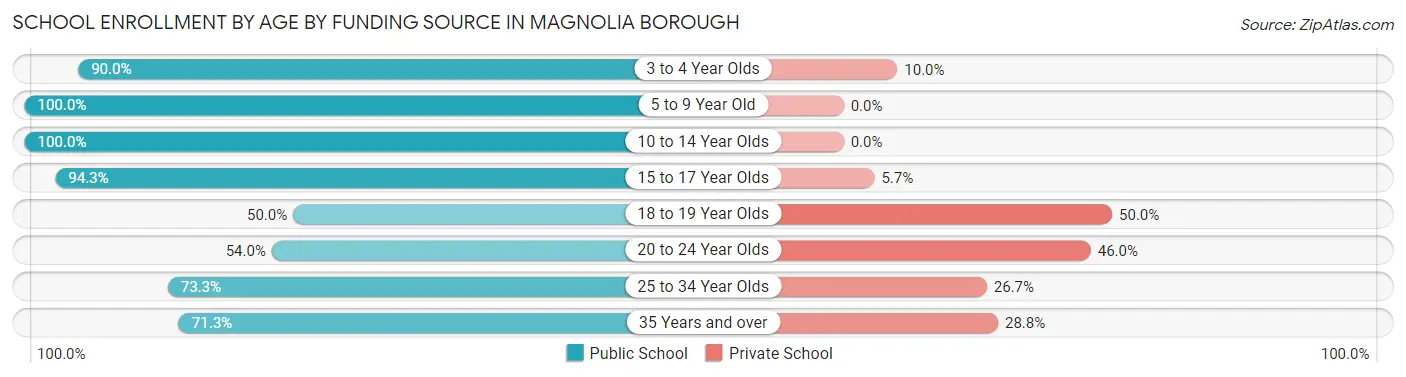
Out of a total of 1,028 students who are enrolled in schools in Magnolia borough, 156 (15.2%) attend a private institution, while the remaining 872 (84.8%) are enrolled in public schools. The age group of 18 to 19 year olds has the highest likelihood of being enrolled in private schools, with 36 (50.0% in the age bracket) enrolled. Conversely, the age group of 5 to 9 year old has the lowest likelihood of being enrolled in a private school, with 219 (100.0% in the age bracket) attending a public institution.
| Age Bracket | Public School | Private School |
| 3 to 4 Year Olds | 108 (90.0%) | 12 (10.0%) |
| 5 to 9 Year Old | 219 (100.0%) | 0 (0.0%) |
| 10 to 14 Year Olds | 159 (100.0%) | 0 (0.0%) |
| 15 to 17 Year Olds | 181 (94.3%) | 11 (5.7%) |
| 18 to 19 Year Olds | 36 (50.0%) | 36 (50.0%) |
| 20 to 24 Year Olds | 68 (54.0%) | 58 (46.0%) |
| 25 to 34 Year Olds | 44 (73.3%) | 16 (26.7%) |
| 35 Years and over | 57 (71.3%) | 23 (28.7%) |
| Total | 872 (84.8%) | 156 (15.2%) |
Educational Attainment by Field of Study in Magnolia borough
Business (187 | 15.9%), science & technology (133 | 11.3%), education (131 | 11.2%), bio, nature & agricultural (113 | 9.6%), and social sciences (99 | 8.4%) are the most common fields of study among 1,173 individuals in Magnolia borough who have obtained a bachelor's degree or higher.
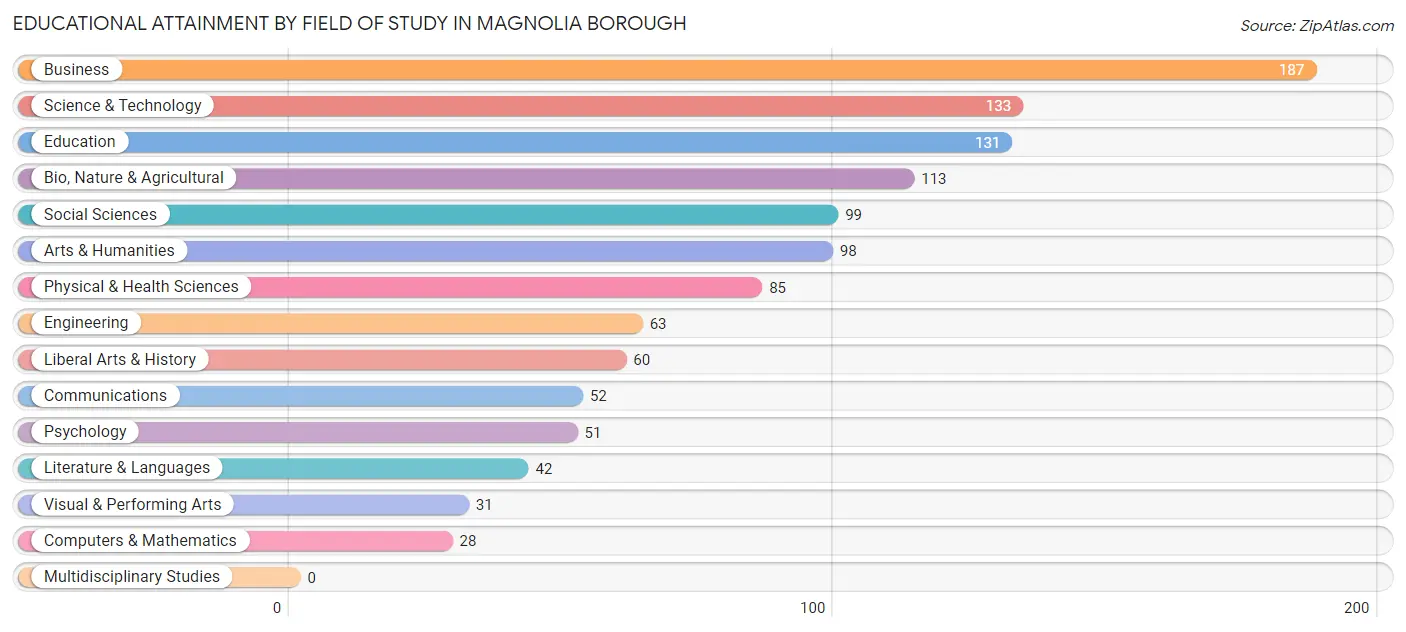
| Field of Study | # Graduates | % Graduates |
| Computers & Mathematics | 28 | 2.4% |
| Bio, Nature & Agricultural | 113 | 9.6% |
| Physical & Health Sciences | 85 | 7.2% |
| Psychology | 51 | 4.3% |
| Social Sciences | 99 | 8.4% |
| Engineering | 63 | 5.4% |
| Multidisciplinary Studies | 0 | 0.0% |
| Science & Technology | 133 | 11.3% |
| Business | 187 | 15.9% |
| Education | 131 | 11.2% |
| Literature & Languages | 42 | 3.6% |
| Liberal Arts & History | 60 | 5.1% |
| Visual & Performing Arts | 31 | 2.6% |
| Communications | 52 | 4.4% |
| Arts & Humanities | 98 | 8.4% |
| Total | 1,173 | 100.0% |
Transportation & Commute in Magnolia borough
Vehicle Availability by Sex in Magnolia borough
The most prevalent vehicle ownership categories in Magnolia borough are males with 2 vehicles (442, accounting for 39.3%) and females with 2 vehicles (557, making up 35.7%).
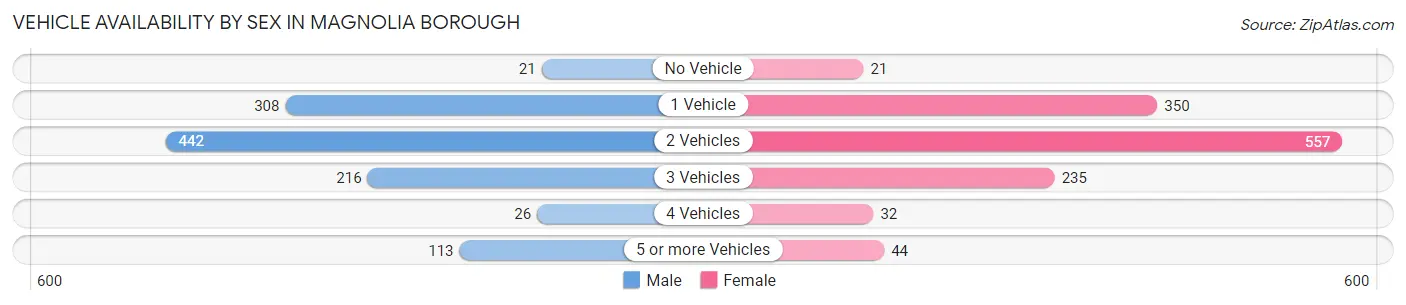
| Vehicles Available | Male | Female |
| No Vehicle | 21 (1.9%) | 21 (1.7%) |
| 1 Vehicle | 308 (27.4%) | 350 (28.2%) |
| 2 Vehicles | 442 (39.3%) | 557 (45.0%) |
| 3 Vehicles | 216 (19.2%) | 235 (19.0%) |
| 4 Vehicles | 26 (2.3%) | 32 (2.6%) |
| 5 or more Vehicles | 113 (10.0%) | 44 (3.5%) |
| Total | 1,126 (100.0%) | 1,239 (100.0%) |
Commute Time in Magnolia borough
The most frequently occuring commute durations in Magnolia borough are 20 to 24 minutes (452 commuters, 21.3%), 30 to 34 minutes (362 commuters, 17.0%), and 45 to 59 minutes (282 commuters, 13.3%).
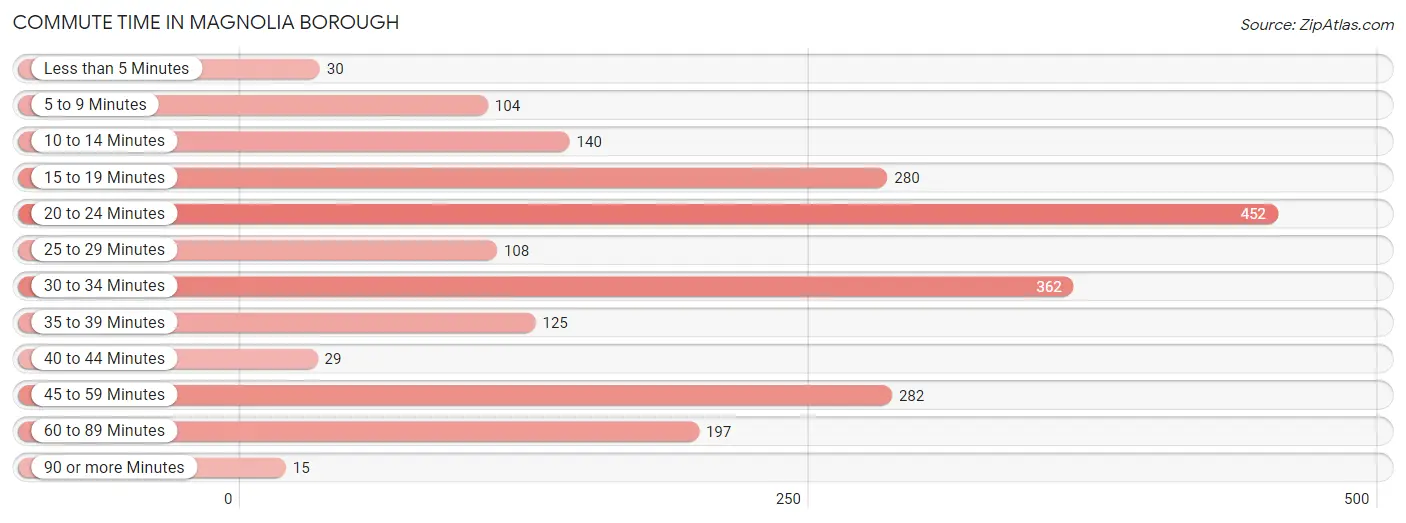
| Commute Time | # Commuters | % Commuters |
| Less than 5 Minutes | 30 | 1.4% |
| 5 to 9 Minutes | 104 | 4.9% |
| 10 to 14 Minutes | 140 | 6.6% |
| 15 to 19 Minutes | 280 | 13.2% |
| 20 to 24 Minutes | 452 | 21.3% |
| 25 to 29 Minutes | 108 | 5.1% |
| 30 to 34 Minutes | 362 | 17.0% |
| 35 to 39 Minutes | 125 | 5.9% |
| 40 to 44 Minutes | 29 | 1.4% |
| 45 to 59 Minutes | 282 | 13.3% |
| 60 to 89 Minutes | 197 | 9.3% |
| 90 or more Minutes | 15 | 0.7% |
Commute Time by Sex in Magnolia borough
The most common commute times in Magnolia borough are 45 to 59 minutes (201 commuters, 20.5%) for males and 20 to 24 minutes (252 commuters, 22.1%) for females.
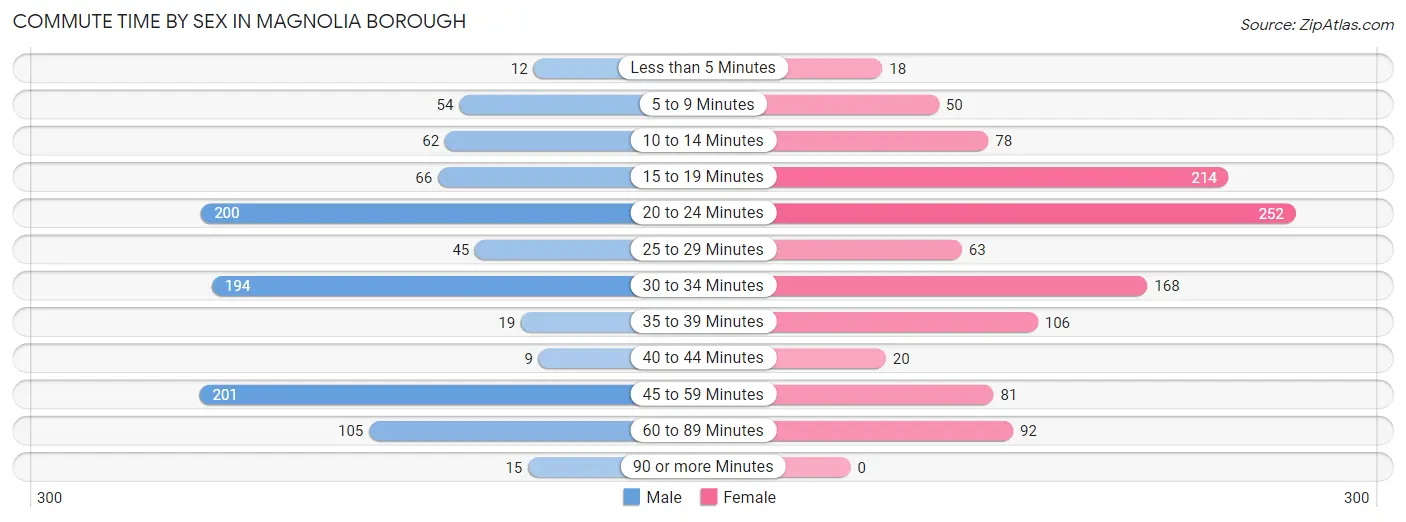
| Commute Time | Male | Female |
| Less than 5 Minutes | 12 (1.2%) | 18 (1.6%) |
| 5 to 9 Minutes | 54 (5.5%) | 50 (4.4%) |
| 10 to 14 Minutes | 62 (6.3%) | 78 (6.8%) |
| 15 to 19 Minutes | 66 (6.7%) | 214 (18.7%) |
| 20 to 24 Minutes | 200 (20.4%) | 252 (22.1%) |
| 25 to 29 Minutes | 45 (4.6%) | 63 (5.5%) |
| 30 to 34 Minutes | 194 (19.8%) | 168 (14.7%) |
| 35 to 39 Minutes | 19 (1.9%) | 106 (9.3%) |
| 40 to 44 Minutes | 9 (0.9%) | 20 (1.8%) |
| 45 to 59 Minutes | 201 (20.5%) | 81 (7.1%) |
| 60 to 89 Minutes | 105 (10.7%) | 92 (8.1%) |
| 90 or more Minutes | 15 (1.5%) | 0 (0.0%) |
Time of Departure to Work by Sex in Magnolia borough
The most frequent times of departure to work in Magnolia borough are 8:00 AM to 8:29 AM (178, 18.1%) for males and 8:30 AM to 8:59 AM (234, 20.5%) for females.
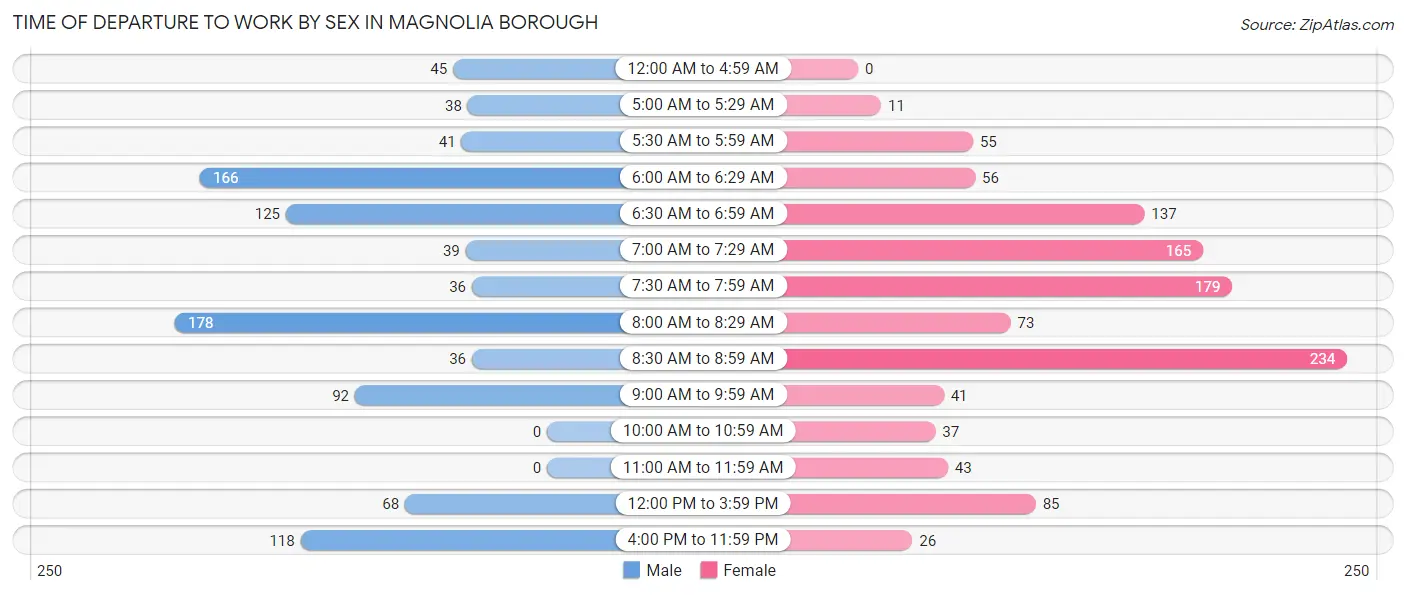
| Time of Departure | Male | Female |
| 12:00 AM to 4:59 AM | 45 (4.6%) | 0 (0.0%) |
| 5:00 AM to 5:29 AM | 38 (3.9%) | 11 (1.0%) |
| 5:30 AM to 5:59 AM | 41 (4.2%) | 55 (4.8%) |
| 6:00 AM to 6:29 AM | 166 (16.9%) | 56 (4.9%) |
| 6:30 AM to 6:59 AM | 125 (12.7%) | 137 (12.0%) |
| 7:00 AM to 7:29 AM | 39 (4.0%) | 165 (14.4%) |
| 7:30 AM to 7:59 AM | 36 (3.7%) | 179 (15.7%) |
| 8:00 AM to 8:29 AM | 178 (18.1%) | 73 (6.4%) |
| 8:30 AM to 8:59 AM | 36 (3.7%) | 234 (20.5%) |
| 9:00 AM to 9:59 AM | 92 (9.4%) | 41 (3.6%) |
| 10:00 AM to 10:59 AM | 0 (0.0%) | 37 (3.2%) |
| 11:00 AM to 11:59 AM | 0 (0.0%) | 43 (3.8%) |
| 12:00 PM to 3:59 PM | 68 (6.9%) | 85 (7.4%) |
| 4:00 PM to 11:59 PM | 118 (12.0%) | 26 (2.3%) |
| Total | 982 (100.0%) | 1,142 (100.0%) |
Housing Occupancy in Magnolia borough
Occupancy by Ownership in Magnolia borough
Of the total 1,784 dwellings in Magnolia borough, owner-occupied units account for 1,264 (70.9%), while renter-occupied units make up 520 (29.1%).
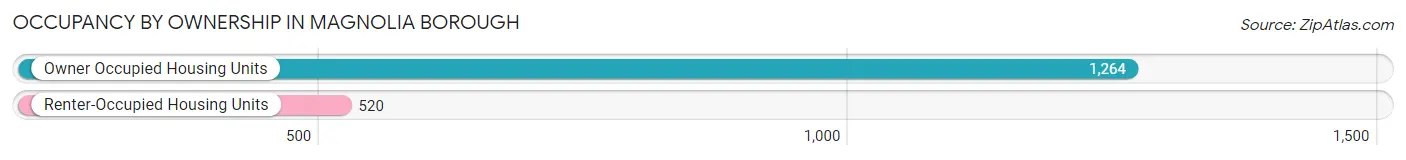
| Occupancy | # Housing Units | % Housing Units |
| Owner Occupied Housing Units | 1,264 | 70.9% |
| Renter-Occupied Housing Units | 520 | 29.1% |
| Total Occupied Housing Units | 1,784 | 100.0% |
Occupancy by Household Size in Magnolia borough
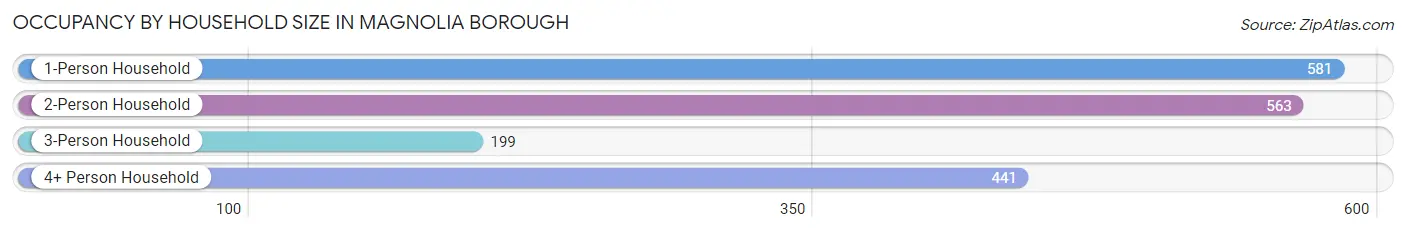
| Household Size | # Housing Units | % Housing Units |
| 1-Person Household | 581 | 32.6% |
| 2-Person Household | 563 | 31.6% |
| 3-Person Household | 199 | 11.2% |
| 4+ Person Household | 441 | 24.7% |
| Total Housing Units | 1,784 | 100.0% |
Occupancy by Ownership by Household Size in Magnolia borough
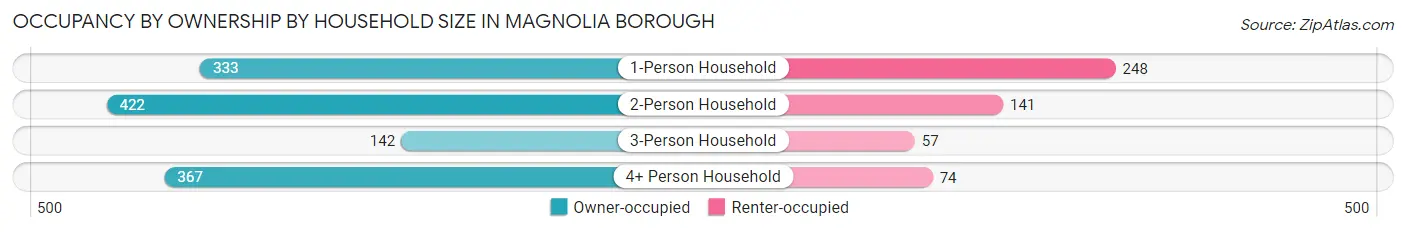
| Household Size | Owner-occupied | Renter-occupied |
| 1-Person Household | 333 (57.3%) | 248 (42.7%) |
| 2-Person Household | 422 (75.0%) | 141 (25.0%) |
| 3-Person Household | 142 (71.4%) | 57 (28.6%) |
| 4+ Person Household | 367 (83.2%) | 74 (16.8%) |
| Total Housing Units | 1,264 (70.9%) | 520 (29.1%) |
Occupancy by Educational Attainment in Magnolia borough
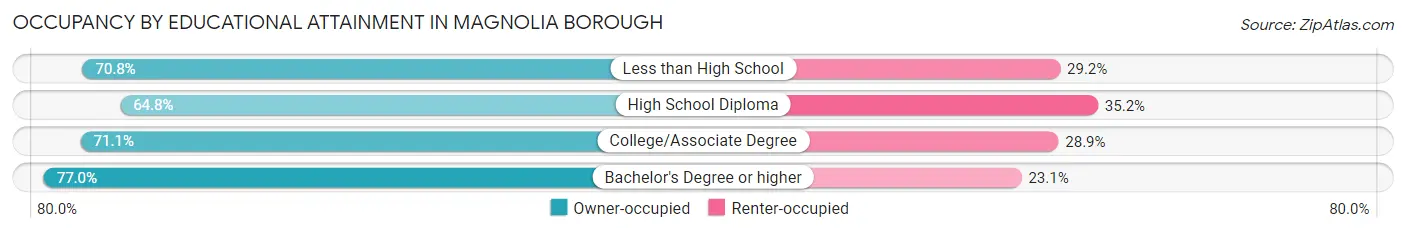
| Household Size | Owner-occupied | Renter-occupied |
| Less than High School | 85 (70.8%) | 35 (29.2%) |
| High School Diploma | 446 (64.8%) | 242 (35.2%) |
| College/Associate Degree | 219 (71.1%) | 89 (28.9%) |
| Bachelor's Degree or higher | 514 (76.9%) | 154 (23.1%) |
Occupancy by Age of Householder in Magnolia borough
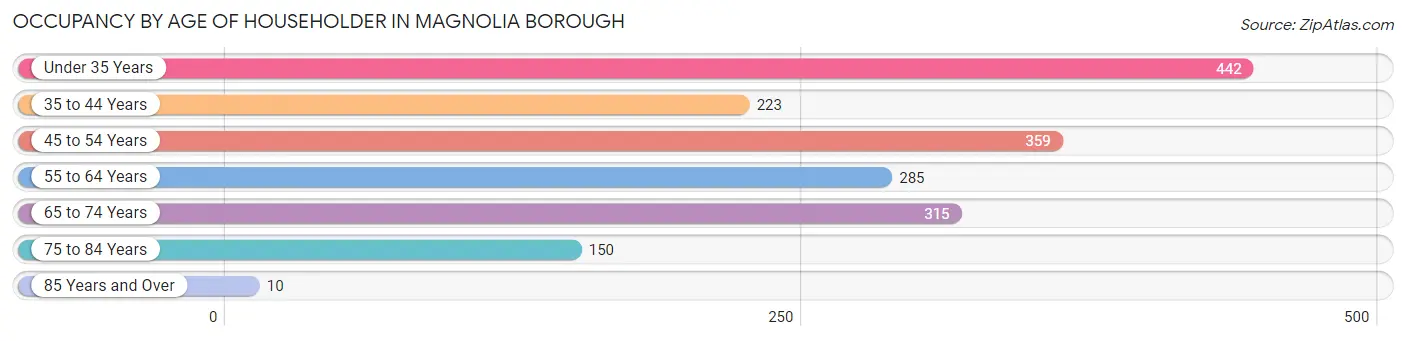
| Age Bracket | # Households | % Households |
| Under 35 Years | 442 | 24.8% |
| 35 to 44 Years | 223 | 12.5% |
| 45 to 54 Years | 359 | 20.1% |
| 55 to 64 Years | 285 | 16.0% |
| 65 to 74 Years | 315 | 17.7% |
| 75 to 84 Years | 150 | 8.4% |
| 85 Years and Over | 10 | 0.6% |
| Total | 1,784 | 100.0% |
Housing Finances in Magnolia borough
Median Income by Occupancy in Magnolia borough
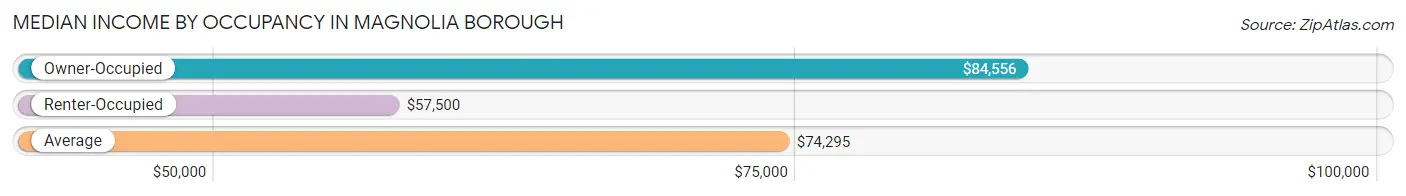
| Occupancy Type | # Households | Median Income |
| Owner-Occupied | 1,264 (70.9%) | $84,556 |
| Renter-Occupied | 520 (29.1%) | $57,500 |
| Average | 1,784 (100.0%) | $74,295 |
Occupancy by Householder Income Bracket in Magnolia borough
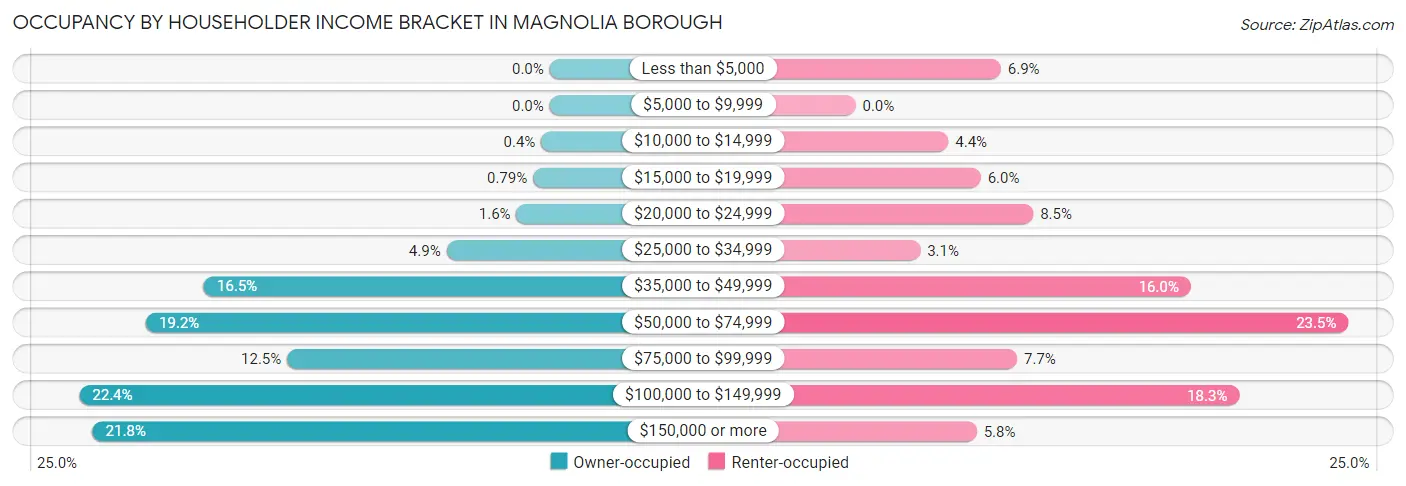
| Income Bracket | Owner-occupied | Renter-occupied |
| Less than $5,000 | 0 (0.0%) | 36 (6.9%) |
| $5,000 to $9,999 | 0 (0.0%) | 0 (0.0%) |
| $10,000 to $14,999 | 5 (0.4%) | 23 (4.4%) |
| $15,000 to $19,999 | 10 (0.8%) | 31 (6.0%) |
| $20,000 to $24,999 | 20 (1.6%) | 44 (8.5%) |
| $25,000 to $34,999 | 62 (4.9%) | 16 (3.1%) |
| $35,000 to $49,999 | 208 (16.5%) | 83 (16.0%) |
| $50,000 to $74,999 | 243 (19.2%) | 122 (23.5%) |
| $75,000 to $99,999 | 158 (12.5%) | 40 (7.7%) |
| $100,000 to $149,999 | 283 (22.4%) | 95 (18.3%) |
| $150,000 or more | 275 (21.8%) | 30 (5.8%) |
| Total | 1,264 (100.0%) | 520 (100.0%) |
Monthly Housing Cost Tiers in Magnolia borough
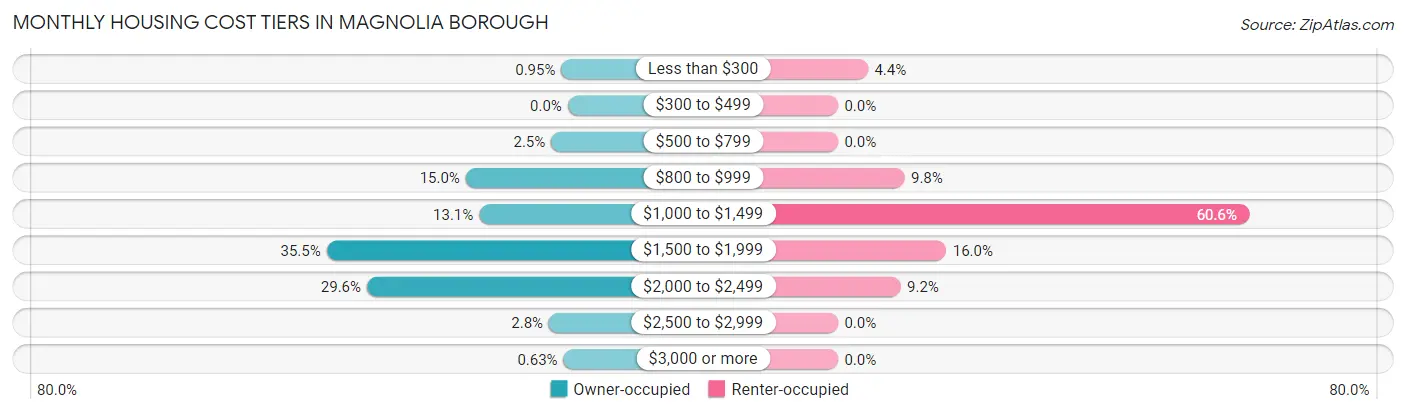
| Monthly Cost | Owner-occupied | Renter-occupied |
| Less than $300 | 12 (0.9%) | 23 (4.4%) |
| $300 to $499 | 0 (0.0%) | 0 (0.0%) |
| $500 to $799 | 31 (2.5%) | 0 (0.0%) |
| $800 to $999 | 190 (15.0%) | 51 (9.8%) |
| $1,000 to $1,499 | 165 (13.1%) | 315 (60.6%) |
| $1,500 to $1,999 | 449 (35.5%) | 83 (16.0%) |
| $2,000 to $2,499 | 374 (29.6%) | 48 (9.2%) |
| $2,500 to $2,999 | 35 (2.8%) | 0 (0.0%) |
| $3,000 or more | 8 (0.6%) | 0 (0.0%) |
| Total | 1,264 (100.0%) | 520 (100.0%) |
Physical Housing Characteristics in Magnolia borough
Housing Structures in Magnolia borough
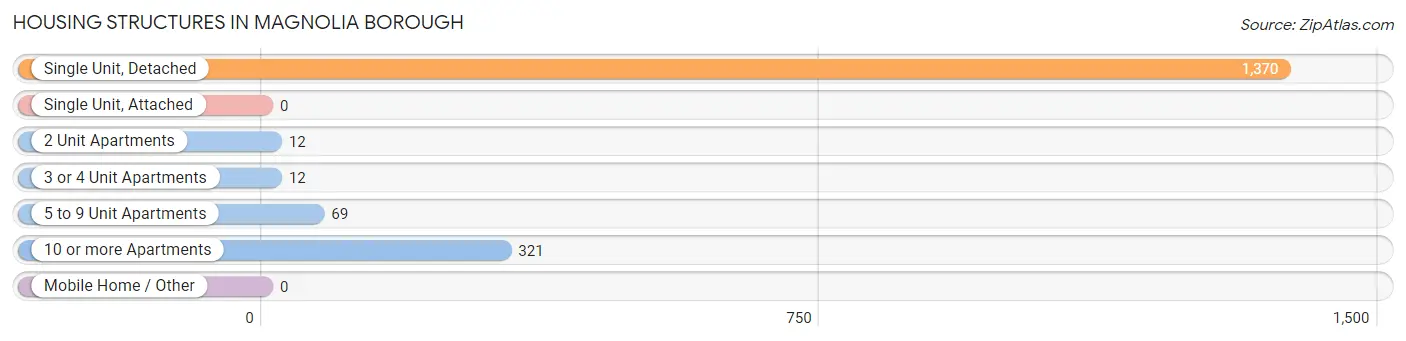
| Structure Type | # Housing Units | % Housing Units |
| Single Unit, Detached | 1,370 | 76.8% |
| Single Unit, Attached | 0 | 0.0% |
| 2 Unit Apartments | 12 | 0.7% |
| 3 or 4 Unit Apartments | 12 | 0.7% |
| 5 to 9 Unit Apartments | 69 | 3.9% |
| 10 or more Apartments | 321 | 18.0% |
| Mobile Home / Other | 0 | 0.0% |
| Total | 1,784 | 100.0% |
Housing Structures by Occupancy in Magnolia borough
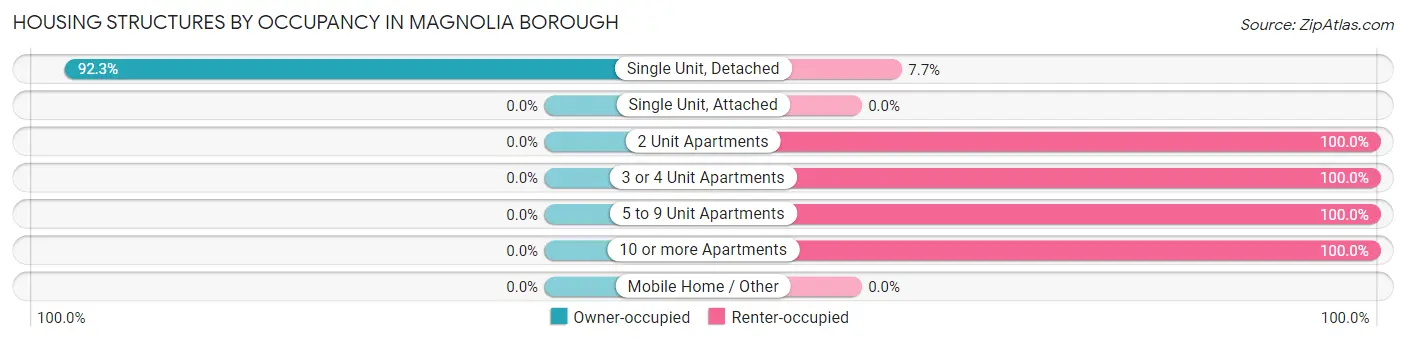
| Structure Type | Owner-occupied | Renter-occupied |
| Single Unit, Detached | 1,264 (92.3%) | 106 (7.7%) |
| Single Unit, Attached | 0 (0.0%) | 0 (0.0%) |
| 2 Unit Apartments | 0 (0.0%) | 12 (100.0%) |
| 3 or 4 Unit Apartments | 0 (0.0%) | 12 (100.0%) |
| 5 to 9 Unit Apartments | 0 (0.0%) | 69 (100.0%) |
| 10 or more Apartments | 0 (0.0%) | 321 (100.0%) |
| Mobile Home / Other | 0 (0.0%) | 0 (0.0%) |
| Total | 1,264 (70.9%) | 520 (29.1%) |
Housing Structures by Number of Rooms in Magnolia borough
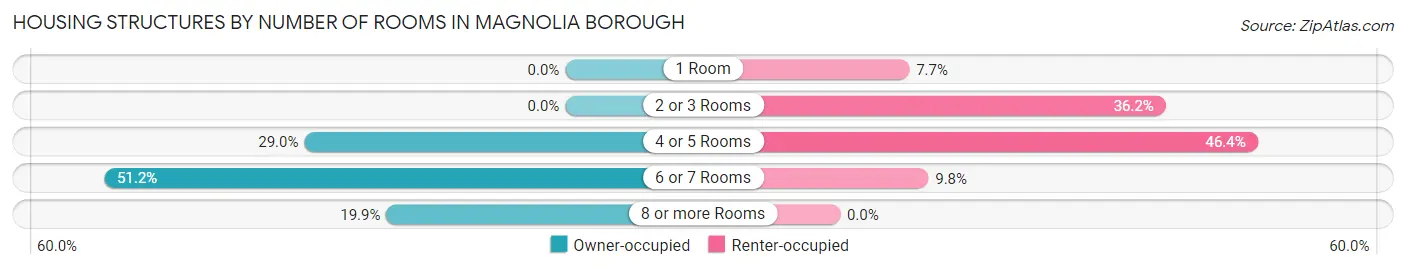
| Number of Rooms | Owner-occupied | Renter-occupied |
| 1 Room | 0 (0.0%) | 40 (7.7%) |
| 2 or 3 Rooms | 0 (0.0%) | 188 (36.1%) |
| 4 or 5 Rooms | 366 (29.0%) | 241 (46.4%) |
| 6 or 7 Rooms | 647 (51.2%) | 51 (9.8%) |
| 8 or more Rooms | 251 (19.9%) | 0 (0.0%) |
| Total | 1,264 (100.0%) | 520 (100.0%) |
Housing Structure by Heating Type in Magnolia borough
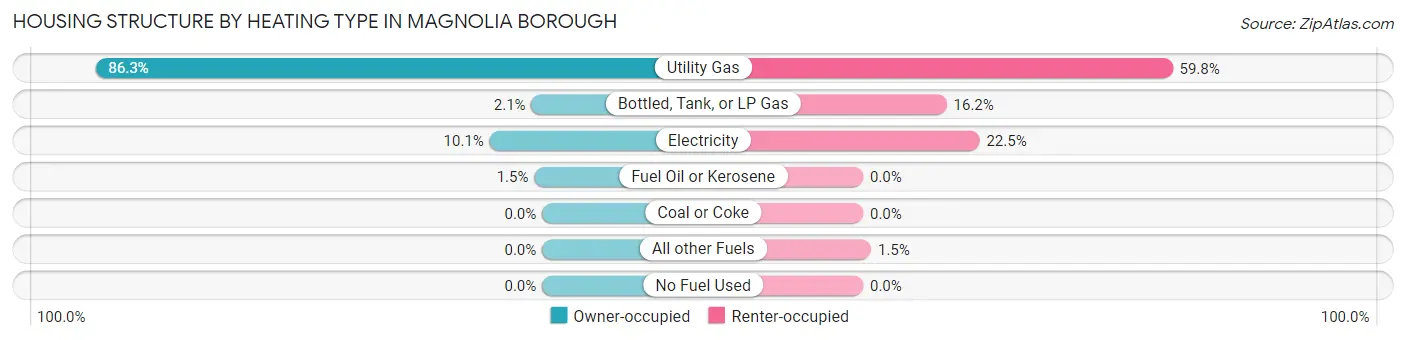
| Heating Type | Owner-occupied | Renter-occupied |
| Utility Gas | 1,091 (86.3%) | 311 (59.8%) |
| Bottled, Tank, or LP Gas | 26 (2.1%) | 84 (16.2%) |
| Electricity | 128 (10.1%) | 117 (22.5%) |
| Fuel Oil or Kerosene | 19 (1.5%) | 0 (0.0%) |
| Coal or Coke | 0 (0.0%) | 0 (0.0%) |
| All other Fuels | 0 (0.0%) | 8 (1.5%) |
| No Fuel Used | 0 (0.0%) | 0 (0.0%) |
| Total | 1,264 (100.0%) | 520 (100.0%) |
Household Vehicle Usage in Magnolia borough
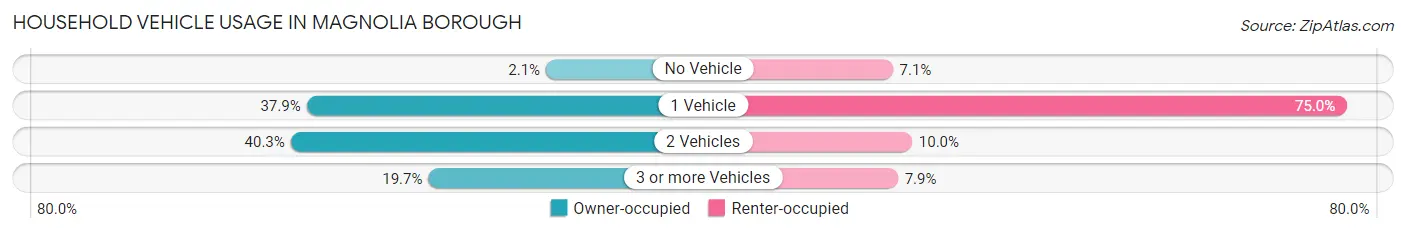
| Vehicles per Household | Owner-occupied | Renter-occupied |
| No Vehicle | 27 (2.1%) | 37 (7.1%) |
| 1 Vehicle | 479 (37.9%) | 390 (75.0%) |
| 2 Vehicles | 509 (40.3%) | 52 (10.0%) |
| 3 or more Vehicles | 249 (19.7%) | 41 (7.9%) |
| Total | 1,264 (100.0%) | 520 (100.0%) |
Real Estate & Mortgages in Magnolia borough
Real Estate and Mortgage Overview in Magnolia borough
| Characteristic | Without Mortgage | With Mortgage |
| Housing Units | 329 | 935 |
| Median Property Value | $181,000 | $209,200 |
| Median Household Income | $45,795 | $246 |
| Monthly Housing Costs | $961 | $8 |
| Real Estate Taxes | $6,395 | $7 |
Property Value by Mortgage Status in Magnolia borough
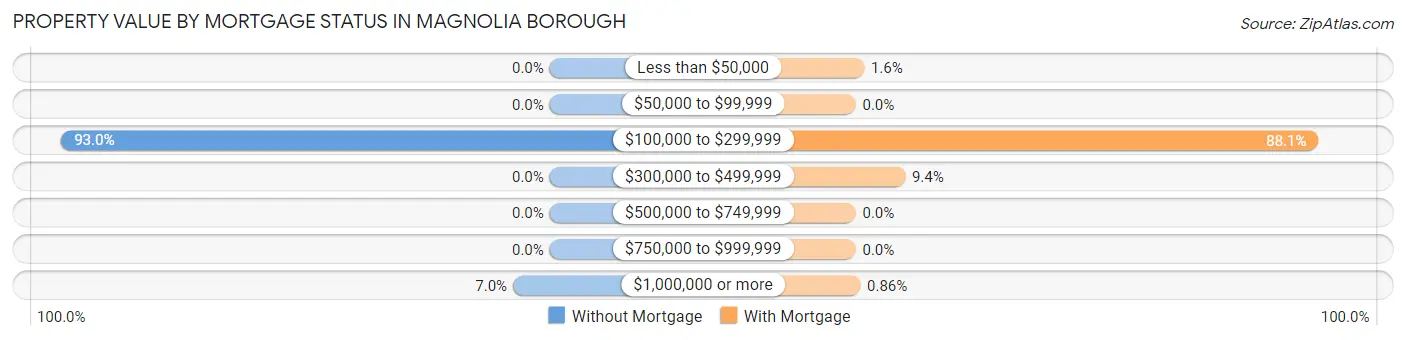
| Property Value | Without Mortgage | With Mortgage |
| Less than $50,000 | 0 (0.0%) | 15 (1.6%) |
| $50,000 to $99,999 | 0 (0.0%) | 0 (0.0%) |
| $100,000 to $299,999 | 306 (93.0%) | 824 (88.1%) |
| $300,000 to $499,999 | 0 (0.0%) | 88 (9.4%) |
| $500,000 to $749,999 | 0 (0.0%) | 0 (0.0%) |
| $750,000 to $999,999 | 0 (0.0%) | 0 (0.0%) |
| $1,000,000 or more | 23 (7.0%) | 8 (0.9%) |
| Total | 329 (100.0%) | 935 (100.0%) |
Household Income by Mortgage Status in Magnolia borough
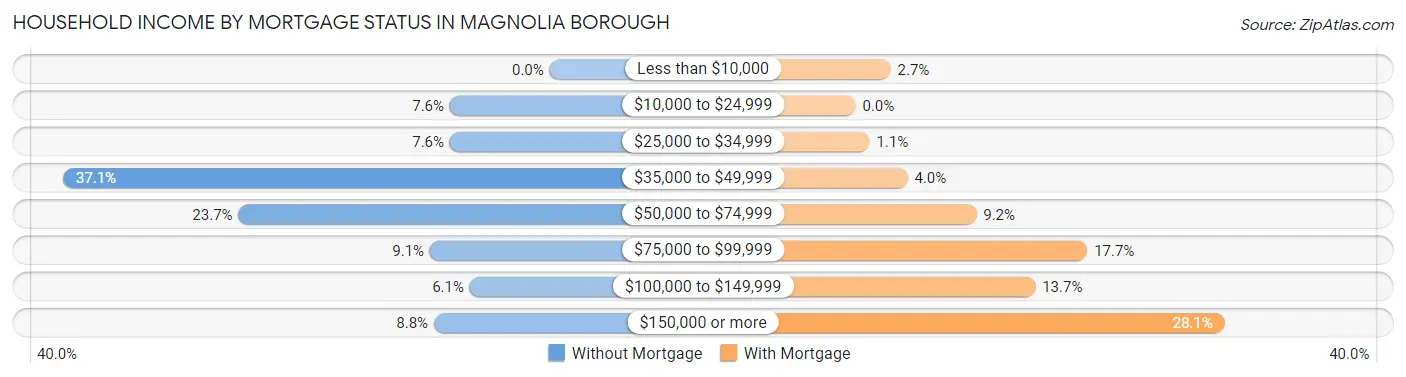
| Household Income | Without Mortgage | With Mortgage |
| Less than $10,000 | 0 (0.0%) | 25 (2.7%) |
| $10,000 to $24,999 | 25 (7.6%) | 0 (0.0%) |
| $25,000 to $34,999 | 25 (7.6%) | 10 (1.1%) |
| $35,000 to $49,999 | 122 (37.1%) | 37 (4.0%) |
| $50,000 to $74,999 | 78 (23.7%) | 86 (9.2%) |
| $75,000 to $99,999 | 30 (9.1%) | 165 (17.6%) |
| $100,000 to $149,999 | 20 (6.1%) | 128 (13.7%) |
| $150,000 or more | 29 (8.8%) | 263 (28.1%) |
| Total | 329 (100.0%) | 935 (100.0%) |
Property Value to Household Income Ratio in Magnolia borough
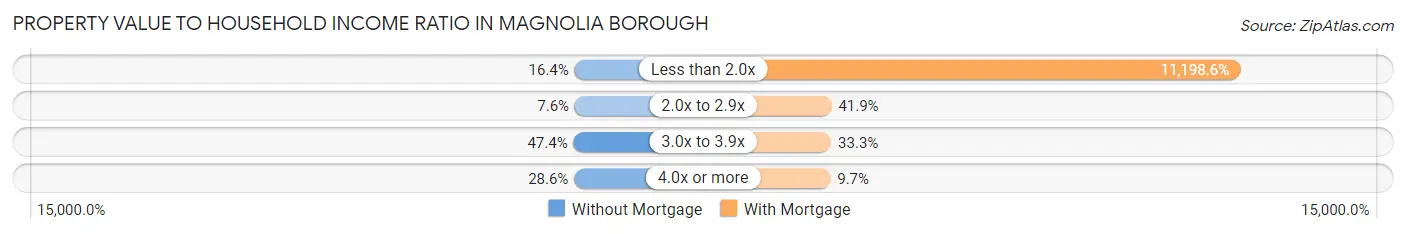
| Value-to-Income Ratio | Without Mortgage | With Mortgage |
| Less than 2.0x | 54 (16.4%) | 104,707 (11,198.6%) |
| 2.0x to 2.9x | 25 (7.6%) | 392 (41.9%) |
| 3.0x to 3.9x | 156 (47.4%) | 311 (33.3%) |
| 4.0x or more | 94 (28.6%) | 91 (9.7%) |
| Total | 329 (100.0%) | 935 (100.0%) |
Real Estate Taxes by Mortgage Status in Magnolia borough
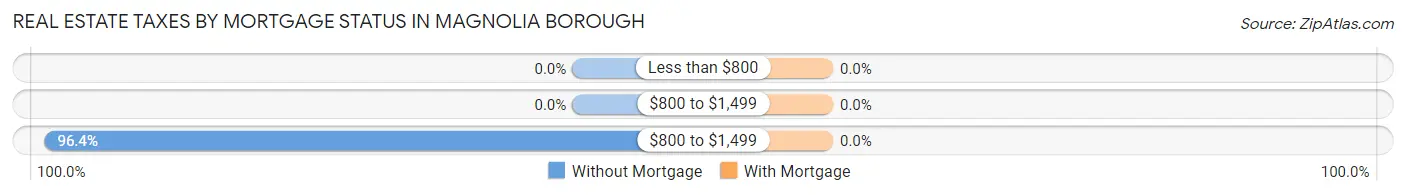
| Property Taxes | Without Mortgage | With Mortgage |
| Less than $800 | 0 (0.0%) | 0 (0.0%) |
| $800 to $1,499 | 0 (0.0%) | 0 (0.0%) |
| $800 to $1,499 | 317 (96.4%) | 0 (0.0%) |
| Total | 329 (100.0%) | 935 (100.0%) |
Health & Disability in Magnolia borough
Health Insurance Coverage by Age in Magnolia borough
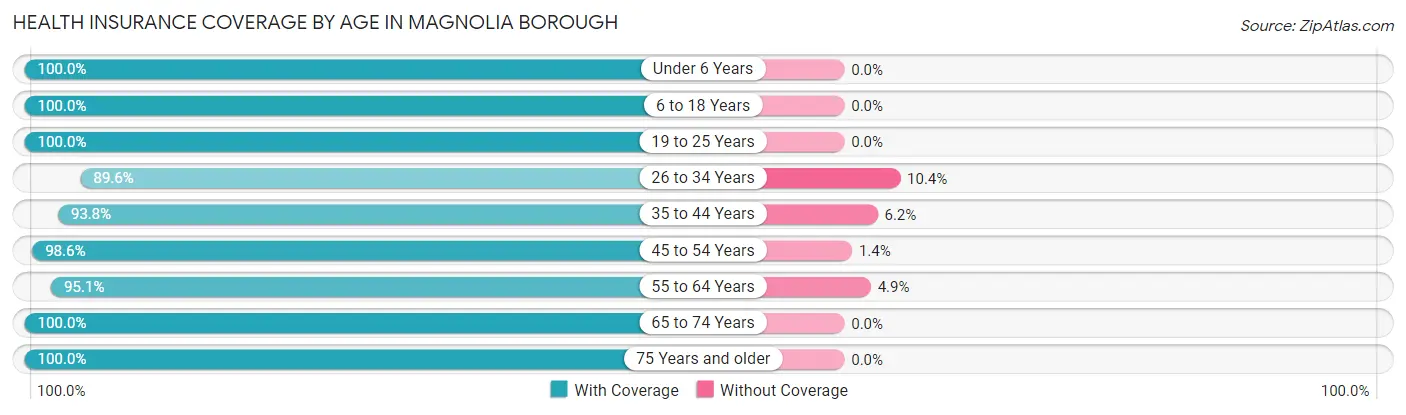
| Age Bracket | With Coverage | Without Coverage |
| Under 6 Years | 435 (100.0%) | 0 (0.0%) |
| 6 to 18 Years | 549 (100.0%) | 0 (0.0%) |
| 19 to 25 Years | 244 (100.0%) | 0 (0.0%) |
| 26 to 34 Years | 826 (89.6%) | 96 (10.4%) |
| 35 to 44 Years | 378 (93.8%) | 25 (6.2%) |
| 45 to 54 Years | 553 (98.6%) | 8 (1.4%) |
| 55 to 64 Years | 463 (95.1%) | 24 (4.9%) |
| 65 to 74 Years | 461 (100.0%) | 0 (0.0%) |
| 75 Years and older | 247 (100.0%) | 0 (0.0%) |
| Total | 4,156 (96.5%) | 153 (3.5%) |
Health Insurance Coverage by Citizenship Status in Magnolia borough
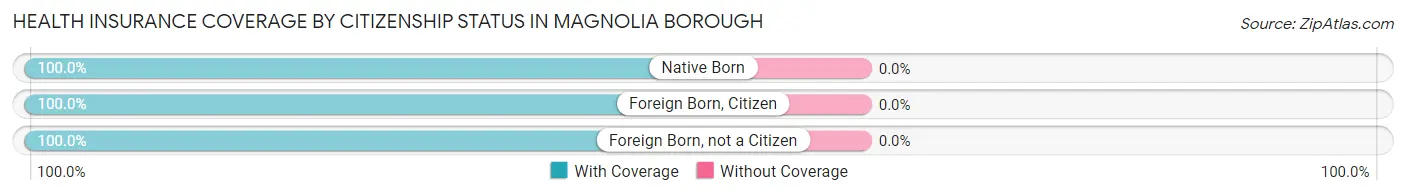
| Citizenship Status | With Coverage | Without Coverage |
| Native Born | 435 (100.0%) | 0 (0.0%) |
| Foreign Born, Citizen | 549 (100.0%) | 0 (0.0%) |
| Foreign Born, not a Citizen | 244 (100.0%) | 0 (0.0%) |
Health Insurance Coverage by Household Income in Magnolia borough
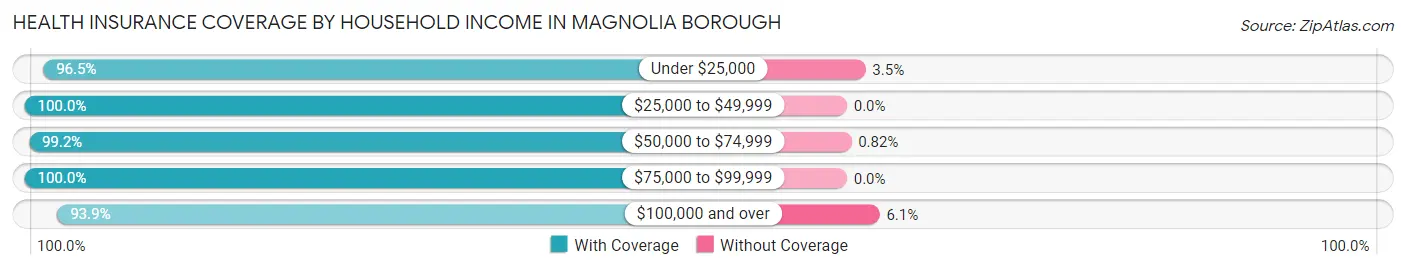
| Household Income | With Coverage | Without Coverage |
| Under $25,000 | 221 (96.5%) | 8 (3.5%) |
| $25,000 to $49,999 | 595 (100.0%) | 0 (0.0%) |
| $50,000 to $74,999 | 849 (99.2%) | 7 (0.8%) |
| $75,000 to $99,999 | 365 (100.0%) | 0 (0.0%) |
| $100,000 and over | 2,116 (93.9%) | 138 (6.1%) |
Public vs Private Health Insurance Coverage by Age in Magnolia borough
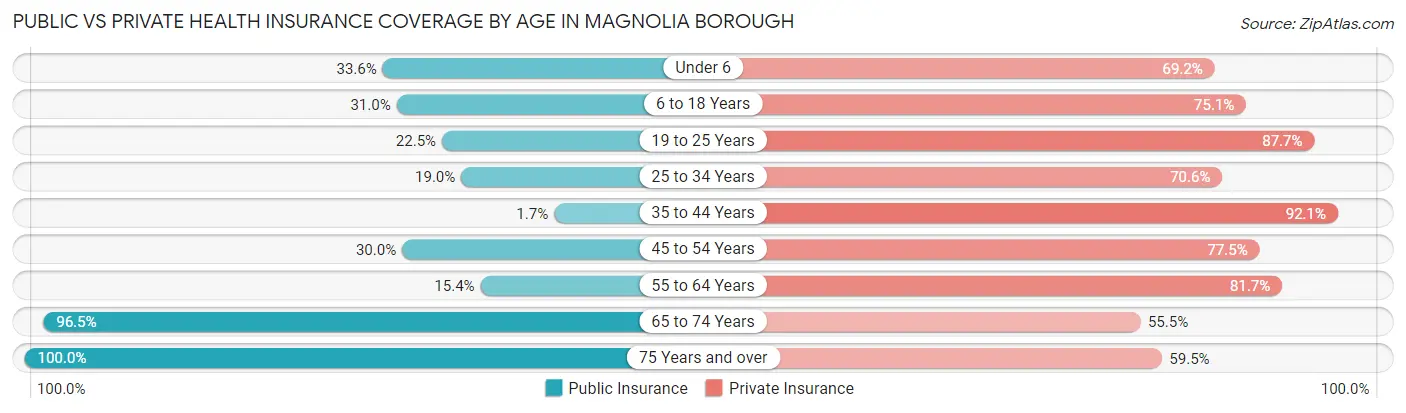
| Age Bracket | Public Insurance | Private Insurance |
| Under 6 | 146 (33.6%) | 301 (69.2%) |
| 6 to 18 Years | 170 (31.0%) | 412 (75.0%) |
| 19 to 25 Years | 55 (22.5%) | 214 (87.7%) |
| 25 to 34 Years | 175 (19.0%) | 651 (70.6%) |
| 35 to 44 Years | 7 (1.7%) | 371 (92.1%) |
| 45 to 54 Years | 168 (29.9%) | 435 (77.5%) |
| 55 to 64 Years | 75 (15.4%) | 398 (81.7%) |
| 65 to 74 Years | 445 (96.5%) | 256 (55.5%) |
| 75 Years and over | 247 (100.0%) | 147 (59.5%) |
| Total | 1,488 (34.5%) | 3,185 (73.9%) |
Disability Status by Sex by Age in Magnolia borough
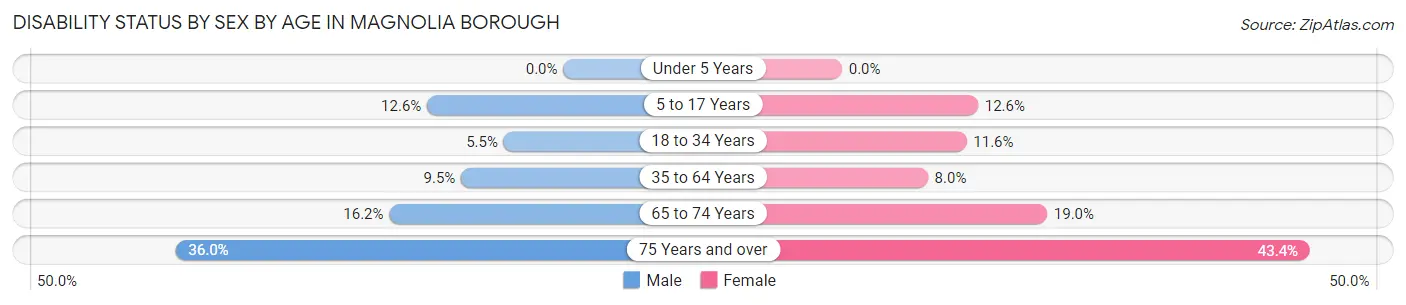
| Age Bracket | Male | Female |
| Under 5 Years | 0 (0.0%) | 0 (0.0%) |
| 5 to 17 Years | 46 (12.6%) | 26 (12.6%) |
| 18 to 34 Years | 33 (5.5%) | 71 (11.6%) |
| 35 to 64 Years | 65 (9.5%) | 61 (8.0%) |
| 65 to 74 Years | 21 (16.2%) | 63 (19.0%) |
| 75 Years and over | 45 (36.0%) | 53 (43.4%) |
Disability Class by Sex by Age in Magnolia borough
Disability Class: Hearing Difficulty
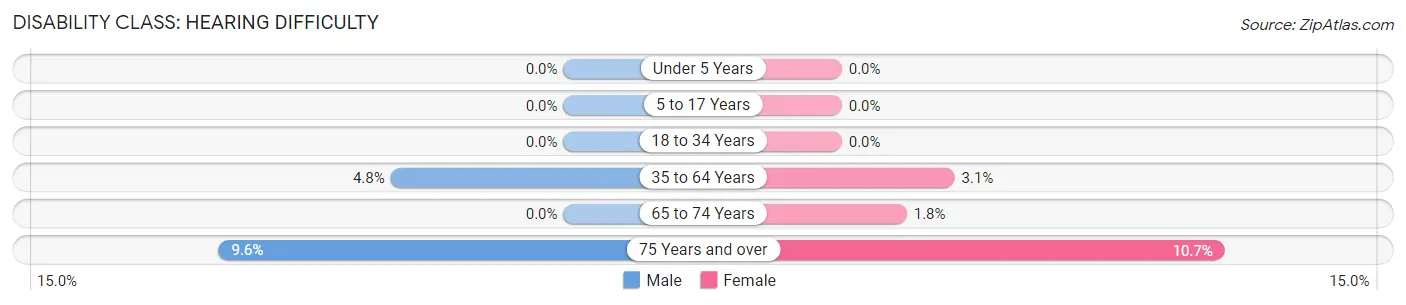
| Age Bracket | Male | Female |
| Under 5 Years | 0 (0.0%) | 0 (0.0%) |
| 5 to 17 Years | 0 (0.0%) | 0 (0.0%) |
| 18 to 34 Years | 0 (0.0%) | 0 (0.0%) |
| 35 to 64 Years | 33 (4.8%) | 24 (3.1%) |
| 65 to 74 Years | 0 (0.0%) | 6 (1.8%) |
| 75 Years and over | 12 (9.6%) | 13 (10.7%) |
Disability Class: Vision Difficulty
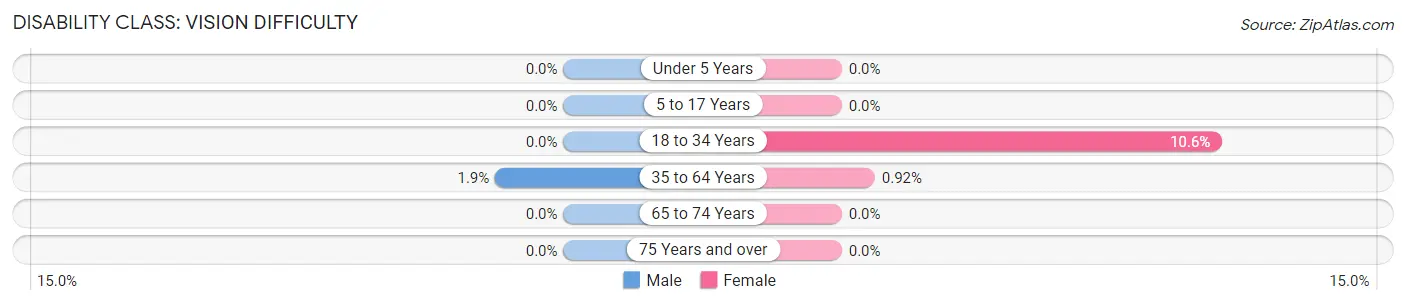
| Age Bracket | Male | Female |
| Under 5 Years | 0 (0.0%) | 0 (0.0%) |
| 5 to 17 Years | 0 (0.0%) | 0 (0.0%) |
| 18 to 34 Years | 0 (0.0%) | 65 (10.6%) |
| 35 to 64 Years | 13 (1.9%) | 7 (0.9%) |
| 65 to 74 Years | 0 (0.0%) | 0 (0.0%) |
| 75 Years and over | 0 (0.0%) | 0 (0.0%) |
Disability Class: Cognitive Difficulty
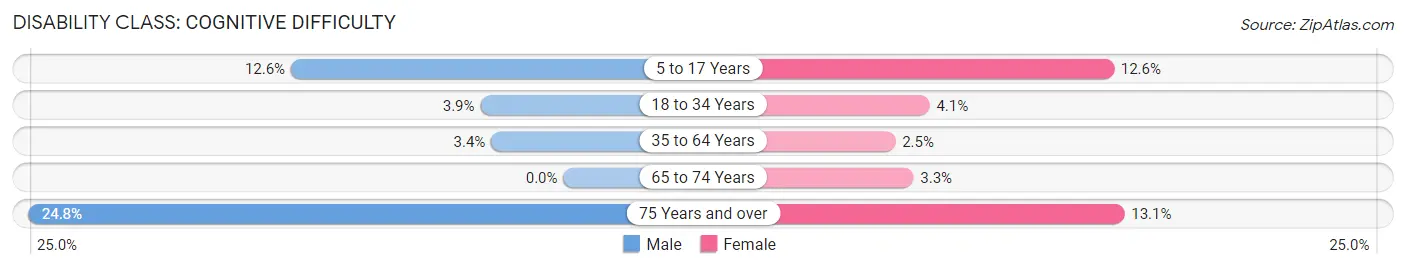
| Age Bracket | Male | Female |
| 5 to 17 Years | 46 (12.6%) | 26 (12.6%) |
| 18 to 34 Years | 23 (3.8%) | 25 (4.1%) |
| 35 to 64 Years | 23 (3.4%) | 19 (2.5%) |
| 65 to 74 Years | 0 (0.0%) | 11 (3.3%) |
| 75 Years and over | 31 (24.8%) | 16 (13.1%) |
Disability Class: Ambulatory Difficulty
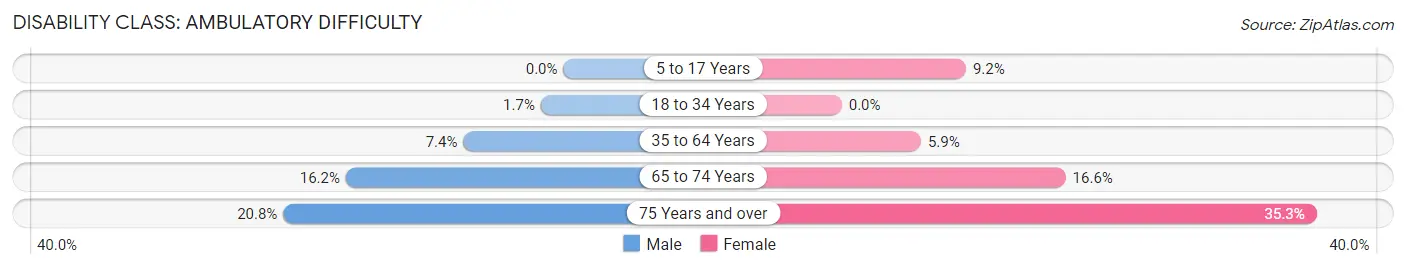
| Age Bracket | Male | Female |
| 5 to 17 Years | 0 (0.0%) | 19 (9.2%) |
| 18 to 34 Years | 10 (1.7%) | 0 (0.0%) |
| 35 to 64 Years | 51 (7.4%) | 45 (5.9%) |
| 65 to 74 Years | 21 (16.2%) | 55 (16.6%) |
| 75 Years and over | 26 (20.8%) | 43 (35.2%) |
Disability Class: Self-Care Difficulty
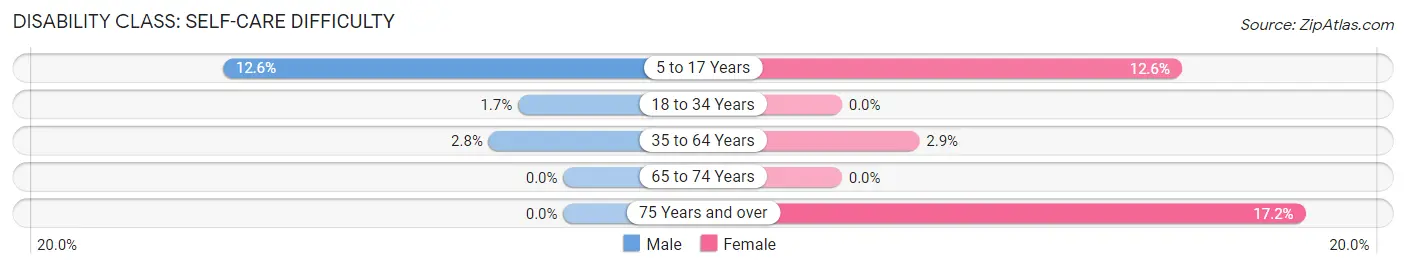
| Age Bracket | Male | Female |
| 5 to 17 Years | 46 (12.6%) | 26 (12.6%) |
| 18 to 34 Years | 10 (1.7%) | 0 (0.0%) |
| 35 to 64 Years | 19 (2.8%) | 22 (2.9%) |
| 65 to 74 Years | 0 (0.0%) | 0 (0.0%) |
| 75 Years and over | 0 (0.0%) | 21 (17.2%) |
Technology Access in Magnolia borough
Computing Device Access in Magnolia borough
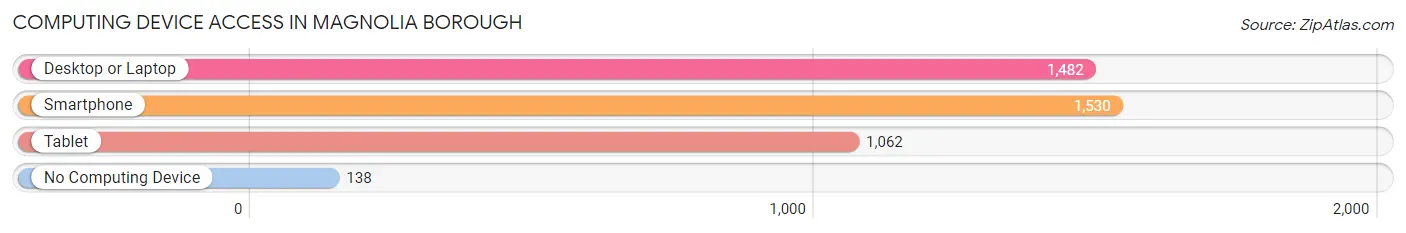
| Device Type | # Households | % Households |
| Desktop or Laptop | 1,482 | 83.1% |
| Smartphone | 1,530 | 85.8% |
| Tablet | 1,062 | 59.5% |
| No Computing Device | 138 | 7.7% |
| Total | 1,784 | 100.0% |
Internet Access in Magnolia borough
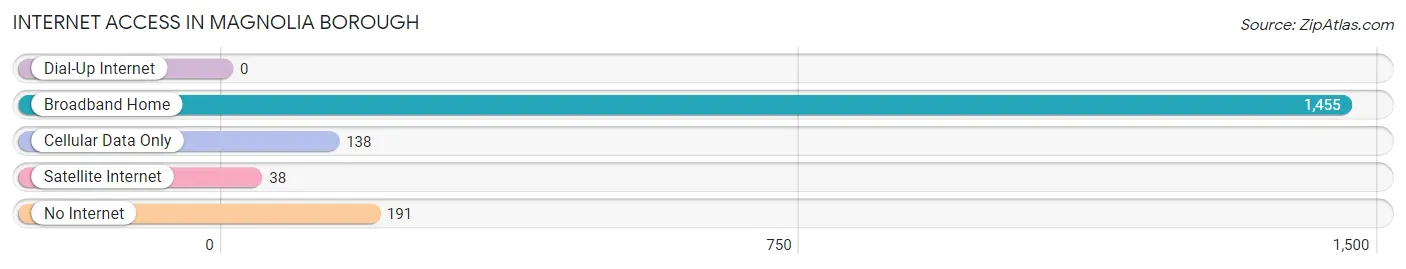
| Internet Type | # Households | % Households |
| Dial-Up Internet | 0 | 0.0% |
| Broadband Home | 1,455 | 81.6% |
| Cellular Data Only | 138 | 7.7% |
| Satellite Internet | 38 | 2.1% |
| No Internet | 191 | 10.7% |
| Total | 1,784 | 100.0% |
Magnolia borough Summary
Magnolia Borough is a small borough located in Camden County, New Jersey. It is situated on the banks of the Delaware River, just south of Philadelphia. The borough was incorporated in 1867 and is home to a population of approximately 2,500 people.
Geography
Magnolia Borough is located in the southern part of Camden County, New Jersey. It is situated on the banks of the Delaware River, just south of Philadelphia. The borough is bordered by the townships of Gloucester, Winslow, and Waterford. The total area of the borough is 0.9 square miles, all of which is land. The borough is located in the humid subtropical climate zone, with hot, humid summers and cold, wet winters.
Demographics
As of the 2010 census, the population of Magnolia Borough was 2,521. The racial makeup of the borough was 79.3% White, 14.2% African American, 0.3% Native American, 1.2% Asian, 0.1% Pacific Islander, and 4.9% from other races. Hispanic or Latino of any race were 8.2% of the population.
The median household income in Magnolia Borough was $50,972, and the median family income was $60,972. About 11.2% of families and 13.2% of the population were below the poverty line, including 18.2% of those under age 18 and 8.2% of those age 65 or over.
Economy
The economy of Magnolia Borough is largely based on the service industry. The borough is home to a variety of restaurants, retail stores, and other businesses. The borough also has a number of manufacturing and industrial businesses, including a paper mill and a plastics factory.
The borough is also home to a number of educational institutions, including Magnolia High School, Magnolia Middle School, and Magnolia Elementary School. The borough is also home to a number of churches, including Magnolia United Methodist Church, Magnolia Presbyterian Church, and Magnolia Baptist Church.
History
The area that is now Magnolia Borough was originally inhabited by the Lenni Lenape Native Americans. The first European settlers arrived in the area in the late 1600s. The area was originally part of Gloucester Township, but was incorporated as its own borough in 1867.
The borough was named after the magnolia trees that grew in the area. The borough was a popular summer resort destination in the late 1800s and early 1900s, and was home to a number of hotels and resorts.
In the early 1900s, the borough began to experience a decline in population as people moved to larger cities. The borough experienced a resurgence in the 1950s and 1960s, as people began to move back to the area.
Today, Magnolia Borough is a small, quiet borough with a population of approximately 2,500 people. The borough is home to a variety of businesses, educational institutions, and churches. The borough is also home to a number of parks and recreational areas, including Magnolia Park and Magnolia Beach.
Common Questions
What is Per Capita Income in Magnolia borough?
Per Capita income in Magnolia borough is $38,225.
What is the Median Family Income in Magnolia borough?
Median Family Income in Magnolia borough is $93,977.
What is the Median Household income in Magnolia borough?
Median Household Income in Magnolia borough is $74,295.
What is Income or Wage Gap in Magnolia borough?
Income or Wage Gap in Magnolia borough is 22.6%.
Women in Magnolia borough earn 77.4 cents for every dollar earned by a man.
What is Inequality or Gini Index in Magnolia borough?
Inequality or Gini Index in Magnolia borough is 0.37.
What is the Total Population of Magnolia borough?
Total Population of Magnolia borough is 4,342.
What is the Total Male Population of Magnolia borough?
Total Male Population of Magnolia borough is 2,138.
What is the Total Female Population of Magnolia borough?
Total Female Population of Magnolia borough is 2,204.
What is the Ratio of Males per 100 Females in Magnolia borough?
There are 97.01 Males per 100 Females in Magnolia borough.
What is the Ratio of Females per 100 Males in Magnolia borough?
There are 103.09 Females per 100 Males in Magnolia borough.
What is the Median Population Age in Magnolia borough?
Median Population Age in Magnolia borough is 34.8 Years.
What is the Average Family Size in Magnolia borough
Average Family Size in Magnolia borough is 3.1 People.
What is the Average Household Size in Magnolia borough
Average Household Size in Magnolia borough is 2.4 People.
How Large is the Labor Force in Magnolia borough?
There are 2,656 People in the Labor Forcein in Magnolia borough.
What is the Percentage of People in the Labor Force in Magnolia borough?
75.9% of People are in the Labor Force in Magnolia borough.
What is the Unemployment Rate in Magnolia borough?
Unemployment Rate in Magnolia borough is 7.5%.