Cities with the Highest Percentage of Indian (Asian) Population in New Jersey
RELATED REPORTS & OPTIONS
Indian (Asian)
New Jersey
Compare Cities
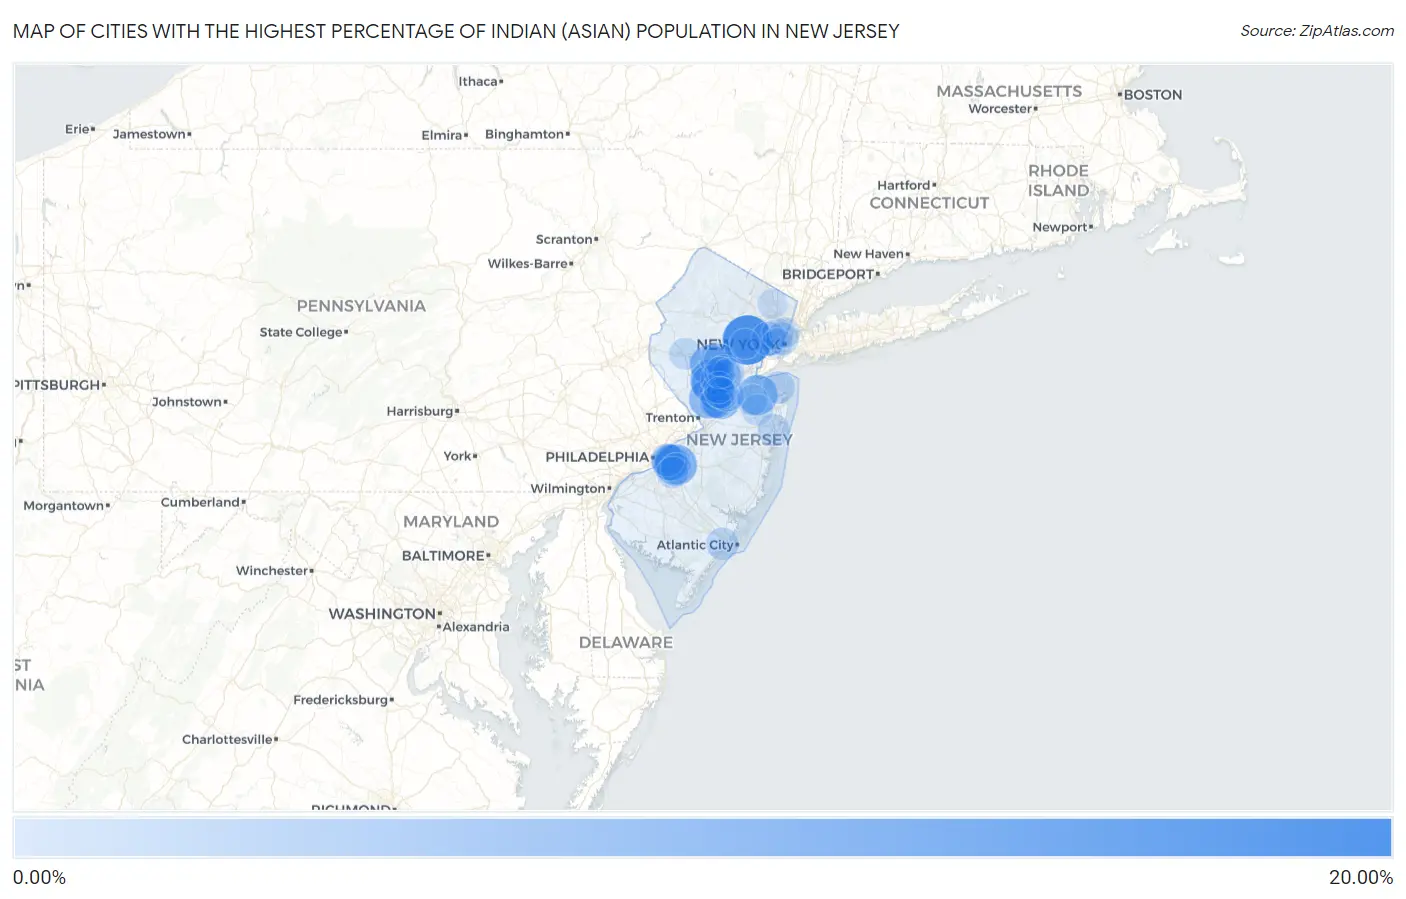
Map of Cities with the Highest Percentage of Indian (Asian) Population in New Jersey
0.00%
20.00%
Cities with the Highest Percentage of Indian (Asian) Population in New Jersey
| City | Indian (Asian) | vs State | vs National | |
| 1. | Short Hills | 19.37% | 1.93%(+17.4)#1 | 1.61%(+17.8)#77 |
| 2. | Belle Mead | 12.90% | 1.93%(+11.0)#2 | 1.61%(+11.3)#188 |
| 3. | Greentree | 12.55% | 1.93%(+10.6)#3 | 1.61%(+10.9)#200 |
| 4. | Englewood Cliffs Borough | 12.32% | 1.93%(+10.4)#4 | 1.61%(+10.7)#206 |
| 5. | Barnegat Light Borough | 12.18% | 1.93%(+10.3)#5 | 1.61%(+10.6)#212 |
| 6. | Morganville | 11.62% | 1.93%(+9.69)#6 | 1.61%(+10.0)#232 |
| 7. | The Hills | 11.49% | 1.93%(+9.56)#7 | 1.61%(+9.88)#235 |
| 8. | Bradley Gardens | 11.48% | 1.93%(+9.55)#8 | 1.61%(+9.87)#236 |
| 9. | Princeton | 11.04% | 1.93%(+9.11)#9 | 1.61%(+9.44)#253 |
| 10. | Forsgate | 10.74% | 1.93%(+8.81)#10 | 1.61%(+9.13)#262 |
| 11. | Fort Lee Borough | 10.60% | 1.93%(+8.67)#11 | 1.61%(+8.99)#267 |
| 12. | Princeton Meadows | 10.11% | 1.93%(+8.18)#12 | 1.61%(+8.50)#296 |
| 13. | Edgewater Borough | 9.57% | 1.93%(+7.64)#13 | 1.61%(+7.96)#319 |
| 14. | Mountainside Borough | 9.35% | 1.93%(+7.43)#14 | 1.61%(+7.75)#329 |
| 15. | Harlingen | 9.32% | 1.93%(+7.39)#15 | 1.61%(+7.72)#331 |
| 16. | Highland Park Borough | 9.31% | 1.93%(+7.38)#16 | 1.61%(+7.70)#333 |
| 17. | Cedar Knolls | 8.83% | 1.93%(+6.90)#17 | 1.61%(+7.22)#361 |
| 18. | Mountain Lakes Borough | 8.82% | 1.93%(+6.89)#18 | 1.61%(+7.22)#362 |
| 19. | Deans | 8.67% | 1.93%(+6.75)#19 | 1.61%(+7.07)#374 |
| 20. | Rutgers University-Busch Campus | 8.58% | 1.93%(+6.65)#20 | 1.61%(+6.98)#379 |
| 21. | Kingston Estates | 8.42% | 1.93%(+6.49)#21 | 1.61%(+6.81)#388 |
| 22. | Ellisburg | 8.29% | 1.93%(+6.36)#22 | 1.61%(+6.68)#394 |
| 23. | Parsippany | 7.40% | 1.93%(+5.47)#23 | 1.61%(+5.79)#450 |
| 24. | Neshanic | 7.17% | 1.93%(+5.24)#24 | 1.61%(+5.56)#469 |
| 25. | New Providence Borough | 7.00% | 1.93%(+5.07)#25 | 1.61%(+5.39)#479 |
| 26. | Tenafly Borough | 6.95% | 1.93%(+5.02)#26 | 1.61%(+5.34)#486 |
| 27. | Mickleton | 6.79% | 1.93%(+4.86)#27 | 1.61%(+5.18)#497 |
| 28. | Harrison | 6.73% | 1.93%(+4.80)#28 | 1.61%(+5.12)#502 |
| 29. | Robbinsville Center | 6.55% | 1.93%(+4.62)#29 | 1.61%(+4.94)#520 |
| 30. | Kingston | 6.52% | 1.93%(+4.59)#30 | 1.61%(+4.91)#527 |
| 31. | Metuchen Borough | 6.47% | 1.93%(+4.54)#31 | 1.61%(+4.86)#532 |
| 32. | Lyons | 6.46% | 1.93%(+4.54)#32 | 1.61%(+4.86)#533 |
| 33. | Pine Brook | 6.43% | 1.93%(+4.50)#33 | 1.61%(+4.82)#534 |
| 34. | The College Of New Jersey | 6.42% | 1.93%(+4.49)#34 | 1.61%(+4.81)#536 |
| 35. | Medford Lakes Borough | 6.40% | 1.93%(+4.47)#35 | 1.61%(+4.80)#537 |
| 36. | Plainsboro Center | 6.40% | 1.93%(+4.47)#36 | 1.61%(+4.79)#541 |
| 37. | East Newark Borough | 6.29% | 1.93%(+4.36)#37 | 1.61%(+4.68)#556 |
| 38. | Blackwells Mills | 6.28% | 1.93%(+4.35)#38 | 1.61%(+4.67)#558 |
| 39. | Chatham Borough | 6.27% | 1.93%(+4.34)#39 | 1.61%(+4.66)#559 |
| 40. | Highlands Borough | 6.20% | 1.93%(+4.27)#40 | 1.61%(+4.59)#568 |
| 41. | Roseland Borough | 6.19% | 1.93%(+4.26)#41 | 1.61%(+4.58)#569 |
| 42. | River Edge Borough | 6.01% | 1.93%(+4.08)#42 | 1.61%(+4.41)#590 |
| 43. | Green Knoll | 5.89% | 1.93%(+3.96)#43 | 1.61%(+4.28)#606 |
| 44. | Keasbey | 5.87% | 1.93%(+3.94)#44 | 1.61%(+4.26)#613 |
| 45. | Middlebush | 5.86% | 1.93%(+3.93)#45 | 1.61%(+4.26)#614 |
| 46. | Whippany | 5.82% | 1.93%(+3.89)#46 | 1.61%(+4.21)#621 |
| 47. | Dayton | 5.81% | 1.93%(+3.88)#47 | 1.61%(+4.20)#622 |
| 48. | Golden Triangle | 5.81% | 1.93%(+3.88)#48 | 1.61%(+4.20)#623 |
| 49. | Franklin Center | 5.59% | 1.93%(+3.66)#49 | 1.61%(+3.98)#645 |
| 50. | Leonia Borough | 5.53% | 1.93%(+3.60)#50 | 1.61%(+3.92)#652 |
| 51. | Hoboken | 5.48% | 1.93%(+3.55)#51 | 1.61%(+3.87)#662 |
| 52. | Northfield | 5.42% | 1.93%(+3.49)#52 | 1.61%(+3.81)#668 |
| 53. | Upper Saddle River Borough | 5.30% | 1.93%(+3.38)#53 | 1.61%(+3.70)#690 |
| 54. | Leonardo | 5.27% | 1.93%(+3.34)#54 | 1.61%(+3.66)#701 |
| 55. | Alpine Borough | 5.24% | 1.93%(+3.32)#55 | 1.61%(+3.64)#703 |
| 56. | Millington | 5.17% | 1.93%(+3.24)#56 | 1.61%(+3.56)#718 |
| 57. | Allenwood | 5.14% | 1.93%(+3.21)#57 | 1.61%(+3.53)#728 |
| 58. | Basking Ridge | 5.11% | 1.93%(+3.18)#58 | 1.61%(+3.50)#731 |
| 59. | Rutgers University-Livingston Campus | 5.10% | 1.93%(+3.17)#59 | 1.61%(+3.49)#735 |
| 60. | Martinsville | 5.08% | 1.93%(+3.16)#60 | 1.61%(+3.48)#738 |
| 61. | East Rutherford Borough | 5.05% | 1.93%(+3.12)#61 | 1.61%(+3.44)#744 |
| 62. | Troy Hills | 4.99% | 1.93%(+3.06)#62 | 1.61%(+3.39)#752 |
| 63. | Watchung Borough | 4.96% | 1.93%(+3.03)#63 | 1.61%(+3.35)#757 |
| 64. | Carlstadt Borough | 4.90% | 1.93%(+2.97)#64 | 1.61%(+3.30)#766 |
| 65. | Annandale | 4.86% | 1.93%(+2.93)#65 | 1.61%(+3.25)#774 |
| 66. | Cliffside Park Borough | 4.85% | 1.93%(+2.92)#66 | 1.61%(+3.25)#775 |
| 67. | Princeton Junction | 4.85% | 1.93%(+2.92)#67 | 1.61%(+3.24)#777 |
| 68. | Somerset | 4.80% | 1.93%(+2.88)#68 | 1.61%(+3.20)#785 |
| 69. | Monmouth Junction | 4.78% | 1.93%(+2.85)#69 | 1.61%(+3.17)#792 |
| 70. | Echelon | 4.77% | 1.93%(+2.84)#70 | 1.61%(+3.17)#794 |
| 71. | Regency At Monroe | 4.67% | 1.93%(+2.74)#71 | 1.61%(+3.06)#811 |
| 72. | Montvale Borough | 4.65% | 1.93%(+2.72)#72 | 1.61%(+3.04)#818 |
| 73. | Springdale | 4.64% | 1.93%(+2.71)#73 | 1.61%(+3.03)#822 |
| 74. | East Freehold | 4.60% | 1.93%(+2.67)#74 | 1.61%(+2.99)#833 |
| 75. | Ten Mile Run | 4.60% | 1.93%(+2.67)#75 | 1.61%(+2.99)#836 |
| 76. | Weston | 4.57% | 1.93%(+2.64)#76 | 1.61%(+2.96)#845 |
| 77. | Heathcote | 4.50% | 1.93%(+2.57)#77 | 1.61%(+2.89)#868 |
| 78. | Closter Borough | 4.49% | 1.93%(+2.56)#78 | 1.61%(+2.88)#871 |
| 79. | Secaucus | 4.42% | 1.93%(+2.49)#79 | 1.61%(+2.81)#881 |
| 80. | Allendale Borough | 4.42% | 1.93%(+2.49)#80 | 1.61%(+2.81)#882 |
| 81. | Robertsville | 4.40% | 1.93%(+2.47)#81 | 1.61%(+2.79)#884 |
| 82. | Ramapo College Of New Jersey | 4.32% | 1.93%(+2.39)#82 | 1.61%(+2.72)#899 |
| 83. | Jersey City | 4.16% | 1.93%(+2.23)#83 | 1.61%(+2.55)#925 |
| 84. | Florham Park Borough | 4.10% | 1.93%(+2.17)#84 | 1.61%(+2.50)#935 |
| 85. | Demarest Borough | 4.06% | 1.93%(+2.13)#85 | 1.61%(+2.45)#945 |
| 86. | Glen Rock Borough | 4.05% | 1.93%(+2.12)#86 | 1.61%(+2.44)#949 |
| 87. | Springfield | 4.04% | 1.93%(+2.11)#87 | 1.61%(+2.43)#950 |
| 88. | Spring Lake Borough | 4.02% | 1.93%(+2.09)#88 | 1.61%(+2.41)#958 |
| 89. | Oradell Borough | 3.98% | 1.93%(+2.05)#89 | 1.61%(+2.38)#973 |
| 90. | Bradley Beach Borough | 3.91% | 1.93%(+1.98)#90 | 1.61%(+2.30)#982 |
| 91. | Saddle River Borough | 3.90% | 1.93%(+1.97)#91 | 1.61%(+2.29)#990 |
| 92. | Ridgewood | 3.86% | 1.93%(+1.93)#92 | 1.61%(+2.25)#999 |
| 93. | Glen Ridge Borough | 3.86% | 1.93%(+1.93)#93 | 1.61%(+2.25)#1,001 |
| 94. | Towaco | 3.75% | 1.93%(+1.82)#94 | 1.61%(+2.14)#1,031 |
| 95. | Caldwell Borough | 3.71% | 1.93%(+1.78)#95 | 1.61%(+2.10)#1,042 |
| 96. | Great Notch | 3.71% | 1.93%(+1.78)#96 | 1.61%(+2.10)#1,043 |
| 97. | Guttenberg | 3.67% | 1.93%(+1.74)#97 | 1.61%(+2.06)#1,054 |
| 98. | Lower Berkshire Valley | 3.61% | 1.93%(+1.68)#98 | 1.61%(+2.00)#1,073 |
| 99. | Summit | 3.56% | 1.93%(+1.63)#99 | 1.61%(+1.95)#1,086 |
| 100. | Roselle Park Borough | 3.54% | 1.93%(+1.61)#100 | 1.61%(+1.93)#1,091 |
Common Questions
What are the Top 10 Cities with the Highest Percentage of Indian (Asian) Population in New Jersey?
Top 10 Cities with the Highest Percentage of Indian (Asian) Population in New Jersey are:
#1
19.37%
#2
12.90%
#3
12.55%
#4
11.62%
#5
11.48%
#6
11.04%
#7
10.11%
#8
9.32%
#9
8.42%
#10
8.29%
What city has the Highest Percentage of Indian (Asian) Population in New Jersey?
Short Hills has the Highest Percentage of Indian (Asian) Population in New Jersey with 19.37%.
What is the Percentage of Indian (Asian) Population in the State of New Jersey?
Percentage of Indian (Asian) Population in New Jersey is 1.93%.
What is the Percentage of Indian (Asian) Population in the United States?
Percentage of Indian (Asian) Population in the United States is 1.61%.