Cities with the Highest Poverty Level Among Seniors Over the Age of 65 in New Jersey
RELATED REPORTS & OPTIONS
Highest Poverty | Seniors 65+
New Jersey
Compare Cities
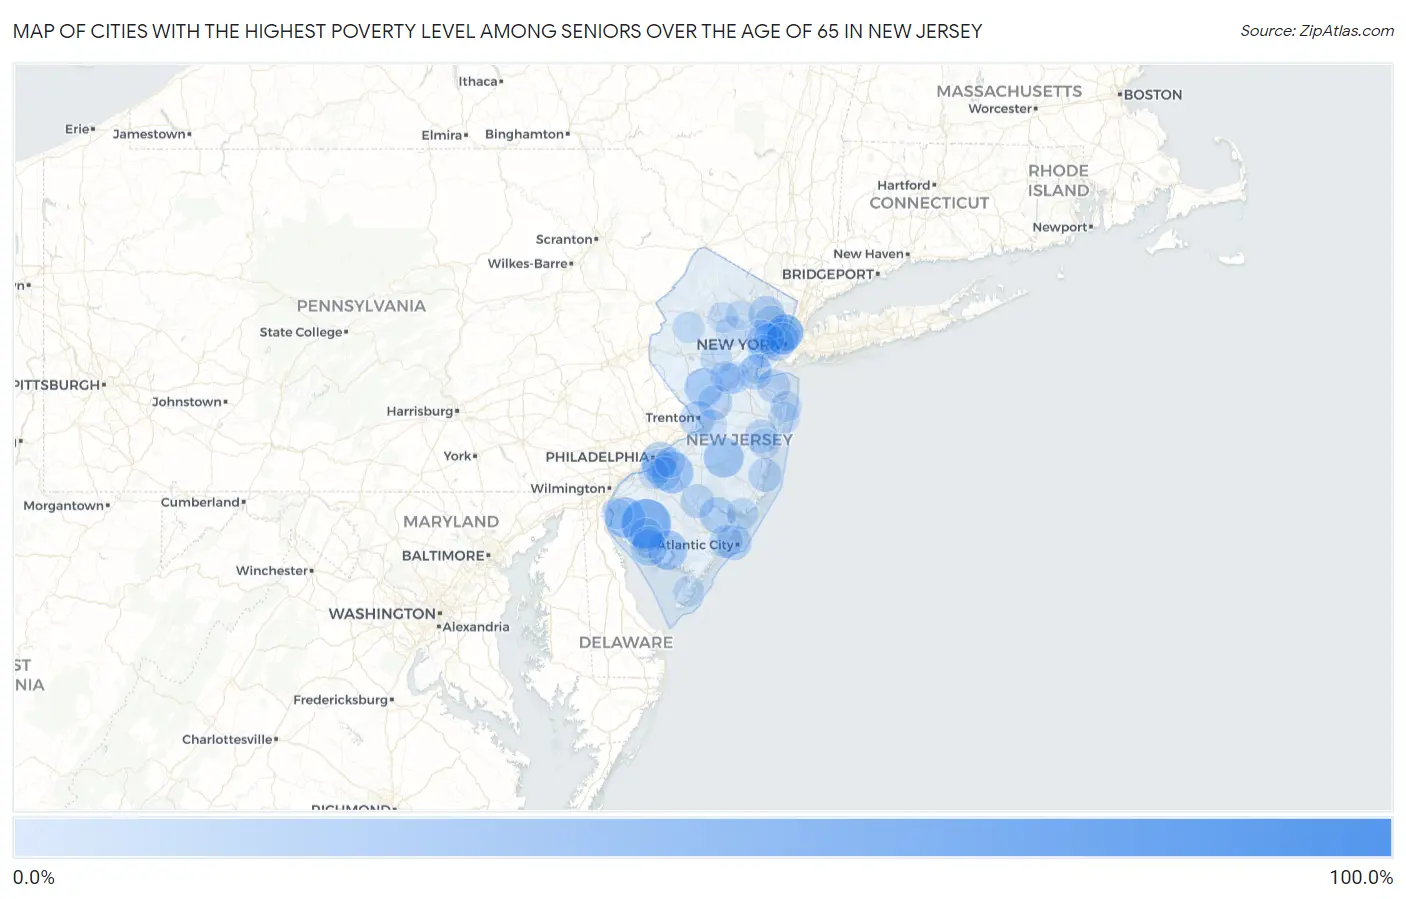
Map of Cities with the Highest Poverty Level Among Seniors Over the Age of 65 in New Jersey
0.0%
100.0%
Cities with the Highest Poverty Level Among Seniors Over the Age of 65 in New Jersey
| City | Senior Poverty | vs State | vs National | |
| 1. | Deerfield Street | 81.8% | 9.1%(+72.7)#1 | 10.0%(+71.9)#271 |
| 2. | Keasbey | 75.4% | 9.1%(+66.3)#2 | 10.0%(+65.5)#312 |
| 3. | Seabrook Farms | 51.3% | 9.1%(+42.2)#3 | 10.0%(+41.3)#718 |
| 4. | Dunellen Borough | 46.0% | 9.1%(+36.9)#4 | 10.0%(+36.1)#936 |
| 5. | Arrowhead Lake | 44.4% | 9.1%(+35.4)#5 | 10.0%(+34.5)#1,002 |
| 6. | Echelon | 35.7% | 9.1%(+26.6)#6 | 10.0%(+25.7)#1,583 |
| 7. | Three Bridges | 33.3% | 9.1%(+24.3)#7 | 10.0%(+23.4)#1,758 |
| 8. | Quinton | 33.3% | 9.1%(+24.3)#8 | 10.0%(+23.4)#1,762 |
| 9. | Country Lake Estates | 32.3% | 9.1%(+23.2)#9 | 10.0%(+22.3)#1,906 |
| 10. | Dividing Creek | 31.2% | 9.1%(+22.1)#10 | 10.0%(+21.2)#2,053 |
| 11. | Laurel Lake | 31.1% | 9.1%(+22.0)#11 | 10.0%(+21.2)#2,058 |
| 12. | Wharton Borough | 30.8% | 9.1%(+21.8)#12 | 10.0%(+20.9)#2,089 |
| 13. | Clementon Borough | 30.1% | 9.1%(+21.0)#13 | 10.0%(+20.2)#2,182 |
| 14. | Newport | 29.9% | 9.1%(+20.8)#14 | 10.0%(+19.9)#2,220 |
| 15. | Skillman | 29.3% | 9.1%(+20.2)#15 | 10.0%(+19.3)#2,313 |
| 16. | Llewellyn Park | 26.4% | 9.1%(+17.3)#16 | 10.0%(+16.5)#2,839 |
| 17. | New Gretna | 26.3% | 9.1%(+17.2)#17 | 10.0%(+16.4)#2,859 |
| 18. | Camden | 25.8% | 9.1%(+16.7)#18 | 10.0%(+15.9)#2,954 |
| 19. | Cedarville | 25.4% | 9.1%(+16.4)#19 | 10.0%(+15.5)#3,059 |
| 20. | Guttenberg | 25.4% | 9.1%(+16.3)#20 | 10.0%(+15.5)#3,063 |
| 21. | West Park | 25.4% | 9.1%(+16.3)#21 | 10.0%(+15.4)#3,065 |
| 22. | Newark | 25.4% | 9.1%(+16.3)#22 | 10.0%(+15.4)#3,074 |
| 23. | West New York | 25.0% | 9.1%(+16.0)#23 | 10.0%(+15.1)#3,135 |
| 24. | Union City | 24.4% | 9.1%(+15.3)#24 | 10.0%(+14.4)#3,346 |
| 25. | Paterson | 24.1% | 9.1%(+15.0)#25 | 10.0%(+14.1)#3,434 |
| 26. | Egg Harbor City | 24.0% | 9.1%(+14.9)#26 | 10.0%(+14.0)#3,458 |
| 27. | Trenton | 23.4% | 9.1%(+14.3)#27 | 10.0%(+13.5)#3,609 |
| 28. | Woodbine Borough | 23.2% | 9.1%(+14.2)#28 | 10.0%(+13.3)#3,659 |
| 29. | Atlantic City | 23.1% | 9.1%(+14.1)#29 | 10.0%(+13.2)#3,680 |
| 30. | Germania | 23.1% | 9.1%(+14.0)#30 | 10.0%(+13.1)#3,697 |
| 31. | Roadstown | 23.1% | 9.1%(+14.0)#31 | 10.0%(+13.1)#3,706 |
| 32. | Jobstown | 23.0% | 9.1%(+13.9)#32 | 10.0%(+13.0)#3,744 |
| 33. | Englishtown Borough | 22.9% | 9.1%(+13.8)#33 | 10.0%(+12.9)#3,761 |
| 34. | Princeton Junction | 22.0% | 9.1%(+13.0)#34 | 10.0%(+12.1)#4,013 |
| 35. | Gloucester City | 21.7% | 9.1%(+12.6)#35 | 10.0%(+11.7)#4,115 |
| 36. | Jersey City | 21.4% | 9.1%(+12.3)#36 | 10.0%(+11.4)#4,212 |
| 37. | Perth Amboy | 21.1% | 9.1%(+12.1)#37 | 10.0%(+11.2)#4,281 |
| 38. | Port Elizabeth | 20.7% | 9.1%(+11.6)#38 | 10.0%(+10.7)#4,450 |
| 39. | Carlls Corner | 20.5% | 9.1%(+11.5)#39 | 10.0%(+10.6)#4,506 |
| 40. | Hammonton | 20.5% | 9.1%(+11.4)#40 | 10.0%(+10.5)#4,530 |
| 41. | Passaic | 20.3% | 9.1%(+11.2)#41 | 10.0%(+10.4)#4,595 |
| 42. | Port Monmouth | 19.8% | 9.1%(+10.7)#42 | 10.0%(+9.83)#4,869 |
| 43. | Bridgeton | 19.7% | 9.1%(+10.7)#43 | 10.0%(+9.80)#4,885 |
| 44. | Glendora | 19.7% | 9.1%(+10.7)#44 | 10.0%(+9.79)#4,889 |
| 45. | Forked River | 19.7% | 9.1%(+10.6)#45 | 10.0%(+9.70)#4,923 |
| 46. | Lakewood | 19.5% | 9.1%(+10.4)#46 | 10.0%(+9.53)#4,992 |
| 47. | Pleasantville | 19.4% | 9.1%(+10.3)#47 | 10.0%(+9.45)#5,039 |
| 48. | East Orange | 18.7% | 9.1%(+9.64)#48 | 10.0%(+8.76)#5,327 |
| 49. | Cape May Point Borough | 18.6% | 9.1%(+9.57)#49 | 10.0%(+8.69)#5,349 |
| 50. | Lodi Borough | 18.3% | 9.1%(+9.22)#50 | 10.0%(+8.34)#5,512 |
| 51. | Union | 18.1% | 9.1%(+9.06)#51 | 10.0%(+8.18)#5,608 |
| 52. | Woodlynne Borough | 18.0% | 9.1%(+8.95)#52 | 10.0%(+8.07)#5,650 |
| 53. | Keyport Borough | 17.8% | 9.1%(+8.74)#53 | 10.0%(+7.86)#5,753 |
| 54. | Penns Grove Borough | 17.8% | 9.1%(+8.71)#54 | 10.0%(+7.83)#5,772 |
| 55. | Franklinville | 17.8% | 9.1%(+8.70)#55 | 10.0%(+7.82)#5,784 |
| 56. | Audubon Park Borough | 17.4% | 9.1%(+8.30)#56 | 10.0%(+7.42)#6,011 |
| 57. | Fairton | 17.4% | 9.1%(+8.29)#57 | 10.0%(+7.41)#6,018 |
| 58. | Elizabeth | 16.8% | 9.1%(+7.72)#58 | 10.0%(+6.84)#6,337 |
| 59. | English Creek | 16.5% | 9.1%(+7.41)#59 | 10.0%(+6.53)#6,545 |
| 60. | Hoboken | 16.4% | 9.1%(+7.36)#60 | 10.0%(+6.48)#6,583 |
| 61. | Palisades Park Borough | 16.4% | 9.1%(+7.31)#61 | 10.0%(+6.43)#6,607 |
| 62. | Mystic Island | 16.4% | 9.1%(+7.28)#62 | 10.0%(+6.40)#6,625 |
| 63. | Green Knoll | 16.2% | 9.1%(+7.13)#63 | 10.0%(+6.25)#6,710 |
| 64. | New Brunswick | 15.9% | 9.1%(+6.83)#64 | 10.0%(+5.95)#6,905 |
| 65. | Robbinsville Center | 15.7% | 9.1%(+6.67)#65 | 10.0%(+5.79)#6,998 |
| 66. | Asbury Park | 15.7% | 9.1%(+6.66)#66 | 10.0%(+5.78)#7,007 |
| 67. | Beattystown | 15.7% | 9.1%(+6.60)#67 | 10.0%(+5.72)#7,041 |
| 68. | Ogdensburg Borough | 15.4% | 9.1%(+6.29)#68 | 10.0%(+5.41)#7,260 |
| 69. | Branchville Borough | 15.2% | 9.1%(+6.10)#69 | 10.0%(+5.22)#7,373 |
| 70. | Collingswood Borough | 15.0% | 9.1%(+5.97)#70 | 10.0%(+5.09)#7,462 |
| 71. | Morristown | 15.0% | 9.1%(+5.97)#71 | 10.0%(+5.09)#7,463 |
| 72. | Sea Bright Borough | 15.0% | 9.1%(+5.94)#72 | 10.0%(+5.06)#7,482 |
| 73. | Voorhees | 14.9% | 9.1%(+5.85)#73 | 10.0%(+4.97)#7,555 |
| 74. | Long Branch | 14.9% | 9.1%(+5.79)#74 | 10.0%(+4.91)#7,604 |
| 75. | Manville Borough | 14.8% | 9.1%(+5.77)#75 | 10.0%(+4.89)#7,616 |
| 76. | Burleigh | 14.8% | 9.1%(+5.74)#76 | 10.0%(+4.86)#7,638 |
| 77. | Groveville | 14.8% | 9.1%(+5.72)#77 | 10.0%(+4.84)#7,656 |
| 78. | Woodbury | 14.5% | 9.1%(+5.38)#78 | 10.0%(+4.50)#7,877 |
| 79. | Salem | 14.4% | 9.1%(+5.35)#79 | 10.0%(+4.47)#7,893 |
| 80. | Dover | 14.3% | 9.1%(+5.26)#80 | 10.0%(+4.38)#7,951 |
| 81. | East Newark Borough | 14.3% | 9.1%(+5.21)#81 | 10.0%(+4.33)#7,980 |
| 82. | Little Ferry Borough | 14.2% | 9.1%(+5.12)#82 | 10.0%(+4.24)#8,107 |
| 83. | Leisure Village | 14.1% | 9.1%(+5.03)#83 | 10.0%(+4.15)#8,183 |
| 84. | Ellisburg | 14.0% | 9.1%(+4.90)#84 | 10.0%(+4.02)#8,283 |
| 85. | Bound Brook Borough | 13.9% | 9.1%(+4.83)#85 | 10.0%(+3.95)#8,335 |
| 86. | Harrison | 13.9% | 9.1%(+4.78)#86 | 10.0%(+3.90)#8,383 |
| 87. | East Rutherford Borough | 13.8% | 9.1%(+4.71)#87 | 10.0%(+3.83)#8,462 |
| 88. | Liberty Corner | 13.7% | 9.1%(+4.61)#88 | 10.0%(+3.73)#8,547 |
| 89. | Middlebush | 13.7% | 9.1%(+4.61)#89 | 10.0%(+3.73)#8,548 |
| 90. | North Arlington Borough | 13.6% | 9.1%(+4.55)#90 | 10.0%(+3.67)#8,618 |
| 91. | Pine Hill Borough | 13.5% | 9.1%(+4.45)#91 | 10.0%(+3.57)#8,684 |
| 92. | Chester Borough | 13.4% | 9.1%(+4.28)#92 | 10.0%(+3.40)#8,840 |
| 93. | Fieldsboro Borough | 13.1% | 9.1%(+4.04)#93 | 10.0%(+3.16)#9,069 |
| 94. | Lindenwold Borough | 13.1% | 9.1%(+3.99)#94 | 10.0%(+3.11)#9,114 |
| 95. | Boonton | 12.8% | 9.1%(+3.78)#95 | 10.0%(+2.90)#9,308 |
| 96. | Prospect Park Borough | 12.8% | 9.1%(+3.73)#96 | 10.0%(+2.85)#9,344 |
| 97. | Thorofare | 12.8% | 9.1%(+3.69)#97 | 10.0%(+2.81)#9,392 |
| 98. | Lawnside Borough | 12.7% | 9.1%(+3.66)#98 | 10.0%(+2.78)#9,422 |
| 99. | Butler Borough | 12.7% | 9.1%(+3.61)#99 | 10.0%(+2.73)#9,472 |
| 100. | Sewaren | 12.6% | 9.1%(+3.58)#100 | 10.0%(+2.70)#9,502 |
Common Questions
What are the Top 10 Cities with the Highest Poverty Level Among Seniors Over the Age of 65 in New Jersey?
Top 10 Cities with the Highest Poverty Level Among Seniors Over the Age of 65 in New Jersey are:
#1
51.3%
#2
35.7%
#3
33.3%
#4
32.3%
#5
31.1%
#6
29.3%
#7
25.8%
#8
25.4%
#9
25.4%
#10
25.4%
What city has the Highest Poverty Level Among Seniors Over the Age of 65 in New Jersey?
Seabrook Farms has the Highest Poverty Level Among Seniors Over the Age of 65 in New Jersey with 51.3%.
What is the Poverty Level Among Seniors Over the Age of 65 in the State of New Jersey?
Poverty Level Among Seniors Over the Age of 65 in New Jersey is 9.1%.
What is the Poverty Level Among Seniors Over the Age of 65 in the United States?
Poverty Level Among Seniors Over the Age of 65 in the United States is 10.0%.