Cities with the Highest Poverty Level Among Females Between Ages 25 and 34 in New Jersey
RELATED REPORTS & OPTIONS
Highest Poverty | Female 25-34
New Jersey
Compare Cities
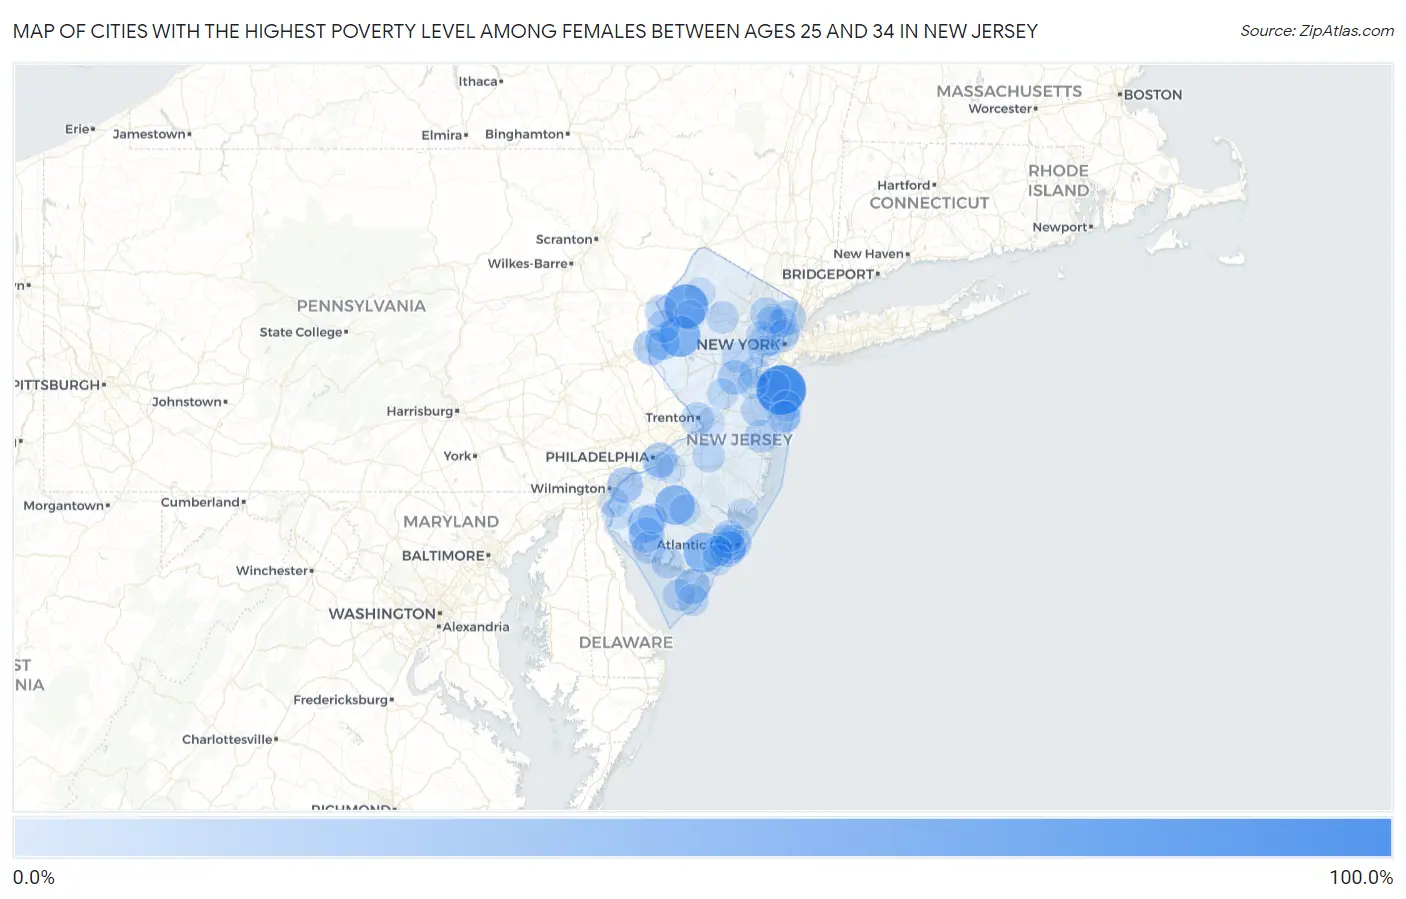
Map of Cities with the Highest Poverty Level Among Females Between Ages 25 and 34 in New Jersey
0.0%
100.0%
Cities with the Highest Poverty Level Among Females Between Ages 25 and 34 in New Jersey
| City | Female Poverty | vs State | vs National | |
| 1. | Navesink | 100.0% | 11.1%(+88.9)#1 | 14.5%(+85.5)#25 |
| 2. | Sunset Lake | 100.0% | 11.1%(+88.9)#2 | 14.5%(+85.5)#105 |
| 3. | Marlboro | 100.0% | 11.1%(+88.9)#3 | 14.5%(+85.5)#593 |
| 4. | Dennisville | 82.1% | 11.1%(+71.0)#4 | 14.5%(+67.6)#874 |
| 5. | Johnsonburg | 75.0% | 11.1%(+63.9)#5 | 14.5%(+60.5)#1,064 |
| 6. | Laurel Heights | 66.7% | 11.1%(+55.5)#6 | 14.5%(+52.2)#1,356 |
| 7. | Anderson | 62.0% | 11.1%(+50.9)#7 | 14.5%(+47.5)#1,610 |
| 8. | Corbin City | 57.6% | 11.1%(+46.5)#8 | 14.5%(+43.1)#1,865 |
| 9. | Victory Lakes | 55.7% | 11.1%(+44.6)#9 | 14.5%(+41.2)#1,985 |
| 10. | Woodbine Borough | 49.4% | 11.1%(+38.3)#10 | 14.5%(+34.9)#2,621 |
| 11. | Newtonville | 46.2% | 11.1%(+35.1)#11 | 14.5%(+31.7)#2,890 |
| 12. | Victory Gardens Borough | 44.7% | 11.1%(+33.6)#12 | 14.5%(+30.2)#3,066 |
| 13. | Shiloh Borough | 44.4% | 11.1%(+33.3)#13 | 14.5%(+30.0)#3,122 |
| 14. | Seabrook Farms | 43.0% | 11.1%(+31.8)#14 | 14.5%(+28.5)#3,284 |
| 15. | Margate City | 42.0% | 11.1%(+30.9)#15 | 14.5%(+27.5)#3,424 |
| 16. | Stockton Borough | 40.0% | 11.1%(+28.9)#16 | 14.5%(+25.5)#3,711 |
| 17. | Rumson Borough | 39.0% | 11.1%(+27.9)#17 | 14.5%(+24.5)#3,897 |
| 18. | Cape May Court House | 38.4% | 11.1%(+27.3)#18 | 14.5%(+23.9)#3,991 |
| 19. | Pedricktown | 37.9% | 11.1%(+26.8)#19 | 14.5%(+23.4)#4,061 |
| 20. | West Wildwood Borough | 37.5% | 11.1%(+26.4)#20 | 14.5%(+23.0)#4,124 |
| 21. | Woodlynne Borough | 37.4% | 11.1%(+26.3)#21 | 14.5%(+22.9)#4,158 |
| 22. | Bridgeton | 37.2% | 11.1%(+26.1)#22 | 14.5%(+22.7)#4,180 |
| 23. | Phillipsburg | 36.7% | 11.1%(+25.5)#23 | 14.5%(+22.2)#4,270 |
| 24. | Atlantic City | 36.5% | 11.1%(+25.3)#24 | 14.5%(+22.0)#4,304 |
| 25. | Dividing Creek | 36.4% | 11.1%(+25.2)#25 | 14.5%(+21.9)#4,328 |
| 26. | New Village | 35.7% | 11.1%(+24.6)#26 | 14.5%(+21.2)#4,448 |
| 27. | Camden | 35.3% | 11.1%(+24.2)#27 | 14.5%(+20.8)#4,527 |
| 28. | New Brunswick | 33.9% | 11.1%(+22.8)#28 | 14.5%(+19.4)#4,772 |
| 29. | Englewood | 33.6% | 11.1%(+22.5)#29 | 14.5%(+19.1)#4,806 |
| 30. | Newport | 33.3% | 11.1%(+22.2)#30 | 14.5%(+18.8)#4,904 |
| 31. | Crosswicks | 33.0% | 11.1%(+21.9)#31 | 14.5%(+18.5)#5,070 |
| 32. | Lakehurst Borough | 32.9% | 11.1%(+21.8)#32 | 14.5%(+18.4)#5,080 |
| 33. | Somerdale Borough | 30.6% | 11.1%(+19.5)#33 | 14.5%(+16.2)#5,536 |
| 34. | Penns Grove Borough | 29.6% | 11.1%(+18.5)#34 | 14.5%(+15.1)#5,748 |
| 35. | Cookstown | 29.0% | 11.1%(+17.9)#35 | 14.5%(+14.5)#5,902 |
| 36. | Neptune City Borough | 28.8% | 11.1%(+17.7)#36 | 14.5%(+14.3)#5,942 |
| 37. | East Newark Borough | 28.8% | 11.1%(+17.6)#37 | 14.5%(+14.3)#5,958 |
| 38. | Lindenwold Borough | 28.5% | 11.1%(+17.4)#38 | 14.5%(+14.0)#6,083 |
| 39. | Pleasantville | 28.4% | 11.1%(+17.3)#39 | 14.5%(+13.9)#6,107 |
| 40. | Lakewood | 27.8% | 11.1%(+16.6)#40 | 14.5%(+13.3)#6,270 |
| 41. | Belvidere | 27.7% | 11.1%(+16.6)#41 | 14.5%(+13.2)#6,287 |
| 42. | Cedarville | 27.7% | 11.1%(+16.5)#42 | 14.5%(+13.2)#6,291 |
| 43. | Trenton | 27.6% | 11.1%(+16.5)#43 | 14.5%(+13.1)#6,313 |
| 44. | Freehold Borough | 27.5% | 11.1%(+16.4)#44 | 14.5%(+13.0)#6,336 |
| 45. | Asbury Park | 27.3% | 11.1%(+16.1)#45 | 14.5%(+12.8)#6,423 |
| 46. | East Freehold | 26.8% | 11.1%(+15.7)#46 | 14.5%(+12.3)#6,529 |
| 47. | Paterson | 26.6% | 11.1%(+15.5)#47 | 14.5%(+12.1)#6,586 |
| 48. | Thorofare | 26.2% | 11.1%(+15.1)#48 | 14.5%(+11.7)#6,688 |
| 49. | Columbia | 26.1% | 11.1%(+15.0)#49 | 14.5%(+11.6)#6,729 |
| 50. | Port Morris | 25.7% | 11.1%(+14.6)#50 | 14.5%(+11.2)#6,825 |
| 51. | Ventnor City | 25.1% | 11.1%(+13.9)#51 | 14.5%(+10.6)#6,991 |
| 52. | Newark | 24.6% | 11.1%(+13.5)#52 | 14.5%(+10.1)#7,236 |
| 53. | Elmwood Park Borough | 24.3% | 11.1%(+13.2)#53 | 14.5%(+9.80)#7,322 |
| 54. | Pemberton Heights | 24.3% | 11.1%(+13.2)#54 | 14.5%(+9.78)#7,328 |
| 55. | Dover | 24.2% | 11.1%(+13.1)#55 | 14.5%(+9.75)#7,347 |
| 56. | Closter Borough | 23.9% | 11.1%(+12.8)#56 | 14.5%(+9.42)#7,442 |
| 57. | Absecon | 23.9% | 11.1%(+12.8)#57 | 14.5%(+9.40)#7,449 |
| 58. | Surf City Borough | 23.5% | 11.1%(+12.4)#58 | 14.5%(+9.04)#7,557 |
| 59. | Villas | 23.2% | 11.1%(+12.1)#59 | 14.5%(+8.71)#7,677 |
| 60. | Wildwood | 23.0% | 11.1%(+11.9)#60 | 14.5%(+8.50)#7,771 |
| 61. | Passaic | 23.0% | 11.1%(+11.9)#61 | 14.5%(+8.49)#7,775 |
| 62. | Port Norris | 22.9% | 11.1%(+11.8)#62 | 14.5%(+8.44)#7,792 |
| 63. | Union City | 22.9% | 11.1%(+11.7)#63 | 14.5%(+8.36)#7,808 |
| 64. | Port Monmouth | 22.5% | 11.1%(+11.4)#64 | 14.5%(+8.06)#7,922 |
| 65. | Seaside Heights Borough | 22.2% | 11.1%(+11.1)#65 | 14.5%(+7.73)#8,012 |
| 66. | Plainfield | 22.0% | 11.1%(+10.9)#66 | 14.5%(+7.54)#8,121 |
| 67. | South River Borough | 22.0% | 11.1%(+10.8)#67 | 14.5%(+7.47)#8,141 |
| 68. | Collings Lakes | 21.8% | 11.1%(+10.7)#68 | 14.5%(+7.30)#8,207 |
| 69. | Perth Amboy | 21.5% | 11.1%(+10.4)#69 | 14.5%(+7.03)#8,310 |
| 70. | Salem | 20.7% | 11.1%(+9.58)#70 | 14.5%(+6.20)#8,605 |
| 71. | Englishtown Borough | 20.2% | 11.1%(+9.07)#71 | 14.5%(+5.70)#8,793 |
| 72. | Monmouth Junction | 20.1% | 11.1%(+8.95)#72 | 14.5%(+5.58)#8,825 |
| 73. | Loch Arbour | 20.0% | 11.1%(+8.88)#73 | 14.5%(+5.51)#8,954 |
| 74. | Stratford Borough | 19.8% | 11.1%(+8.70)#74 | 14.5%(+5.33)#9,021 |
| 75. | Long Branch | 19.5% | 11.1%(+8.41)#75 | 14.5%(+5.03)#9,113 |
| 76. | Haledon Borough | 19.4% | 11.1%(+8.24)#76 | 14.5%(+4.87)#9,165 |
| 77. | Ocean City | 19.0% | 11.1%(+7.86)#77 | 14.5%(+4.49)#9,331 |
| 78. | East Orange | 19.0% | 11.1%(+7.83)#78 | 14.5%(+4.46)#9,347 |
| 79. | Westville Borough | 18.8% | 11.1%(+7.67)#79 | 14.5%(+4.29)#9,404 |
| 80. | Cliffside Park Borough | 18.7% | 11.1%(+7.62)#80 | 14.5%(+4.24)#9,451 |
| 81. | Elizabeth | 18.7% | 11.1%(+7.61)#81 | 14.5%(+4.23)#9,455 |
| 82. | Somers Point | 18.7% | 11.1%(+7.57)#82 | 14.5%(+4.19)#9,464 |
| 83. | Madison Park | 18.4% | 11.1%(+7.31)#83 | 14.5%(+3.93)#9,564 |
| 84. | Vauxhall | 18.3% | 11.1%(+7.16)#84 | 14.5%(+3.79)#9,617 |
| 85. | Pennsville | 18.1% | 11.1%(+6.95)#85 | 14.5%(+3.57)#9,760 |
| 86. | Highlands Borough | 17.2% | 11.1%(+6.11)#86 | 14.5%(+2.74)#10,112 |
| 87. | Olivet | 17.2% | 11.1%(+6.08)#87 | 14.5%(+2.71)#10,120 |
| 88. | Mountain Lakes Borough | 17.2% | 11.1%(+6.07)#88 | 14.5%(+2.69)#10,127 |
| 89. | Newton | 17.1% | 11.1%(+5.93)#89 | 14.5%(+2.56)#10,183 |
| 90. | Gouldtown | 17.0% | 11.1%(+5.90)#90 | 14.5%(+2.53)#10,190 |
| 91. | Mystic Island | 16.8% | 11.1%(+5.69)#91 | 14.5%(+2.32)#10,263 |
| 92. | Panther Valley | 16.8% | 11.1%(+5.64)#92 | 14.5%(+2.27)#10,283 |
| 93. | Glassboro Borough | 16.4% | 11.1%(+5.30)#93 | 14.5%(+1.93)#10,479 |
| 94. | Highland Park Borough | 15.5% | 11.1%(+4.40)#94 | 14.5%(+1.03)#10,867 |
| 95. | Ridgefield Park | 15.4% | 11.1%(+4.30)#95 | 14.5%(+0.928)#10,907 |
| 96. | West New York | 15.2% | 11.1%(+4.13)#96 | 14.5%(+0.756)#11,037 |
| 97. | Yardville | 15.1% | 11.1%(+3.99)#97 | 14.5%(+0.616)#11,094 |
| 98. | Garfield | 15.0% | 11.1%(+3.89)#98 | 14.5%(+0.512)#11,134 |
| 99. | Ashland | 14.7% | 11.1%(+3.57)#99 | 14.5%(+0.195)#11,299 |
| 100. | Gloucester City | 14.7% | 11.1%(+3.55)#100 | 14.5%(+0.181)#11,303 |
Common Questions
What are the Top 10 Cities with the Highest Poverty Level Among Females Between Ages 25 and 34 in New Jersey?
Top 10 Cities with the Highest Poverty Level Among Females Between Ages 25 and 34 in New Jersey are:
#1
100.0%
#2
75.0%
#3
62.0%
#4
57.6%
#5
55.7%
#6
43.0%
#7
42.0%
#8
38.4%
#9
37.9%
#10
37.2%
What city has the Highest Poverty Level Among Females Between Ages 25 and 34 in New Jersey?
Navesink has the Highest Poverty Level Among Females Between Ages 25 and 34 in New Jersey with 100.0%.
What is the Poverty Level Among Females Between Ages 25 and 34 in the State of New Jersey?
Poverty Level Among Females Between Ages 25 and 34 in New Jersey is 11.1%.
What is the Poverty Level Among Females Between Ages 25 and 34 in the United States?
Poverty Level Among Females Between Ages 25 and 34 in the United States is 14.5%.