Cities with the Lowest Poverty Level Among Married Couples in New Jersey
RELATED REPORTS & OPTIONS
Lowest Poverty | Married Couple
New Jersey
Compare Cities
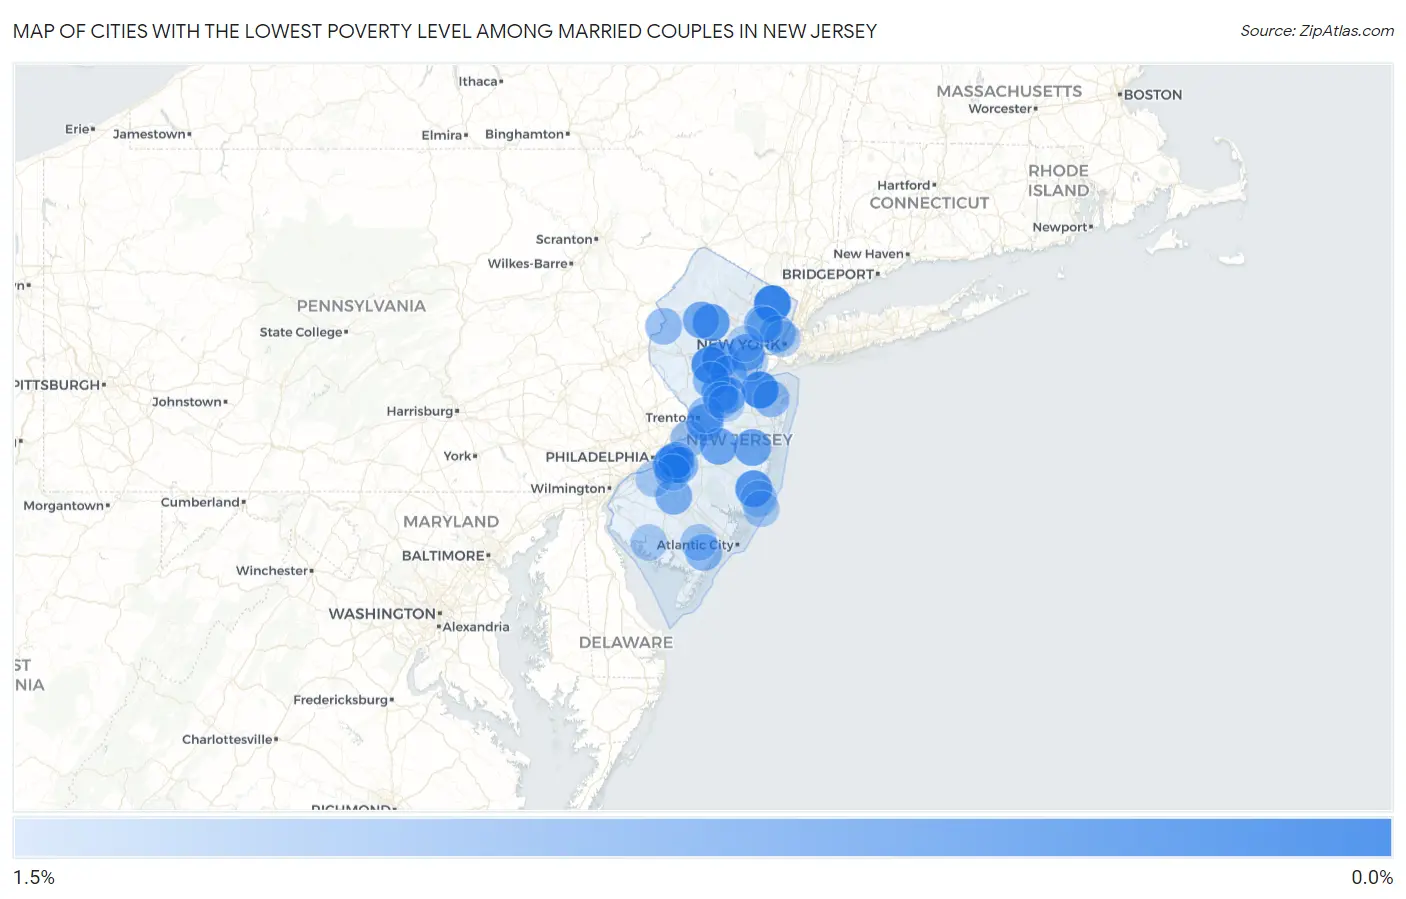
Map of Cities with the Lowest Poverty Level Among Married Couples in New Jersey
1.5%
0.0%
Cities with the Lowest Poverty Level Among Married Couples in New Jersey
| City | Married Couples Poverty | vs State | vs National | |
| 1. | Ridgewood | 0.13% | 3.4%(-3.30)#1 | 4.5%(-4.33)#15 |
| 2. | Oakland Borough | 0.16% | 3.4%(-3.27)#2 | 4.5%(-4.30)#23 |
| 3. | Strathmore | 0.22% | 3.4%(-3.21)#3 | 4.5%(-4.24)#38 |
| 4. | Haddon Heights Borough | 0.25% | 3.4%(-3.18)#4 | 4.5%(-4.22)#46 |
| 5. | Bradley Gardens | 0.29% | 3.4%(-3.14)#5 | 4.5%(-4.17)#62 |
| 6. | Westmont | 0.34% | 3.4%(-3.09)#6 | 4.5%(-4.12)#90 |
| 7. | Essex Fells Borough | 0.34% | 3.4%(-3.09)#7 | 4.5%(-4.12)#96 |
| 8. | Morris Plains Borough | 0.37% | 3.4%(-3.06)#8 | 4.5%(-4.10)#110 |
| 9. | Norwood Borough | 0.39% | 3.4%(-3.04)#9 | 4.5%(-4.08)#125 |
| 10. | Farmingdale Borough | 0.39% | 3.4%(-3.04)#10 | 4.5%(-4.08)#126 |
| 11. | Ocean Acres | 0.41% | 3.4%(-3.02)#11 | 4.5%(-4.05)#152 |
| 12. | Barclay | 0.42% | 3.4%(-3.01)#12 | 4.5%(-4.04)#162 |
| 13. | Spotswood Borough | 0.43% | 3.4%(-3.00)#13 | 4.5%(-4.03)#176 |
| 14. | Succasunna | 0.45% | 3.4%(-2.98)#14 | 4.5%(-4.01)#188 |
| 15. | Gibbsboro Borough | 0.45% | 3.4%(-2.98)#15 | 4.5%(-4.01)#193 |
| 16. | Woodbury Heights Borough | 0.46% | 3.4%(-2.97)#16 | 4.5%(-4.00)#205 |
| 17. | Somerville Borough | 0.50% | 3.4%(-2.93)#17 | 4.5%(-3.97)#237 |
| 18. | Butler Borough | 0.50% | 3.4%(-2.93)#18 | 4.5%(-3.97)#240 |
| 19. | Bernardsville Borough | 0.50% | 3.4%(-2.93)#19 | 4.5%(-3.96)#241 |
| 20. | Martinsville | 0.50% | 3.4%(-2.93)#20 | 4.5%(-3.96)#245 |
| 21. | Tenafly Borough | 0.51% | 3.4%(-2.92)#21 | 4.5%(-3.96)#252 |
| 22. | Preakness | 0.54% | 3.4%(-2.88)#22 | 4.5%(-3.92)#302 |
| 23. | Leonia Borough | 0.57% | 3.4%(-2.86)#23 | 4.5%(-3.90)#330 |
| 24. | White Horse | 0.59% | 3.4%(-2.84)#24 | 4.5%(-3.87)#358 |
| 25. | Heathcote | 0.61% | 3.4%(-2.82)#25 | 4.5%(-3.85)#386 |
| 26. | Bogota Borough | 0.61% | 3.4%(-2.82)#26 | 4.5%(-3.85)#387 |
| 27. | Leisure Knoll | 0.61% | 3.4%(-2.82)#27 | 4.5%(-3.85)#390 |
| 28. | Kingston Estates | 0.61% | 3.4%(-2.82)#28 | 4.5%(-3.85)#393 |
| 29. | Saddle River Borough | 0.62% | 3.4%(-2.81)#29 | 4.5%(-3.84)#409 |
| 30. | Mcguire Afb | 0.63% | 3.4%(-2.80)#30 | 4.5%(-3.83)#418 |
| 31. | Landing | 0.65% | 3.4%(-2.78)#31 | 4.5%(-3.81)#439 |
| 32. | Audubon Borough | 0.65% | 3.4%(-2.78)#32 | 4.5%(-3.81)#442 |
| 33. | Westfield | 0.66% | 3.4%(-2.77)#33 | 4.5%(-3.81)#447 |
| 34. | Bound Brook Borough | 0.67% | 3.4%(-2.76)#34 | 4.5%(-3.79)#482 |
| 35. | Glen Gardner Borough | 0.69% | 3.4%(-2.74)#35 | 4.5%(-3.77)#517 |
| 36. | Madison Borough | 0.70% | 3.4%(-2.73)#36 | 4.5%(-3.76)#524 |
| 37. | Budd Lake | 0.71% | 3.4%(-2.72)#37 | 4.5%(-3.76)#535 |
| 38. | Surf City Borough | 0.72% | 3.4%(-2.71)#38 | 4.5%(-3.74)#573 |
| 39. | Demarest Borough | 0.74% | 3.4%(-2.69)#39 | 4.5%(-3.72)#607 |
| 40. | Upper Montclair | 0.76% | 3.4%(-2.67)#40 | 4.5%(-3.71)#638 |
| 41. | Rutherford Borough | 0.76% | 3.4%(-2.67)#41 | 4.5%(-3.70)#650 |
| 42. | Alpine Borough | 0.77% | 3.4%(-2.66)#42 | 4.5%(-3.69)#665 |
| 43. | Williamstown | 0.77% | 3.4%(-2.66)#43 | 4.5%(-3.69)#670 |
| 44. | Keyport Borough | 0.78% | 3.4%(-2.65)#44 | 4.5%(-3.68)#695 |
| 45. | Somerset | 0.79% | 3.4%(-2.64)#45 | 4.5%(-3.67)#727 |
| 46. | Glen Rock Borough | 0.80% | 3.4%(-2.63)#46 | 4.5%(-3.66)#759 |
| 47. | Allentown Borough | 0.80% | 3.4%(-2.63)#47 | 4.5%(-3.66)#761 |
| 48. | Chatham Borough | 0.80% | 3.4%(-2.63)#48 | 4.5%(-3.66)#763 |
| 49. | Cresskill Borough | 0.81% | 3.4%(-2.62)#49 | 4.5%(-3.65)#771 |
| 50. | Roosevelt Borough | 0.81% | 3.4%(-2.62)#50 | 4.5%(-3.65)#775 |
| 51. | Dayton | 0.82% | 3.4%(-2.61)#51 | 4.5%(-3.65)#787 |
| 52. | Secaucus | 0.83% | 3.4%(-2.60)#52 | 4.5%(-3.63)#821 |
| 53. | Flanders | 0.83% | 3.4%(-2.60)#53 | 4.5%(-3.63)#829 |
| 54. | Greentree | 0.85% | 3.4%(-2.58)#54 | 4.5%(-3.61)#859 |
| 55. | Metuchen Borough | 0.85% | 3.4%(-2.58)#55 | 4.5%(-3.61)#866 |
| 56. | Roselle Borough | 0.85% | 3.4%(-2.58)#56 | 4.5%(-3.61)#870 |
| 57. | Englewood Cliffs Borough | 0.86% | 3.4%(-2.57)#57 | 4.5%(-3.60)#887 |
| 58. | Belle Mead | 0.88% | 3.4%(-2.55)#58 | 4.5%(-3.58)#919 |
| 59. | Park Ridge Borough | 0.90% | 3.4%(-2.53)#59 | 4.5%(-3.56)#949 |
| 60. | Helmetta Borough | 0.90% | 3.4%(-2.53)#60 | 4.5%(-3.56)#951 |
| 61. | Corbin City | 0.90% | 3.4%(-2.53)#61 | 4.5%(-3.56)#958 |
| 62. | Roselle Park Borough | 0.91% | 3.4%(-2.52)#62 | 4.5%(-3.56)#970 |
| 63. | Burlington | 0.91% | 3.4%(-2.52)#63 | 4.5%(-3.55)#983 |
| 64. | Marlton | 0.91% | 3.4%(-2.52)#64 | 4.5%(-3.55)#985 |
| 65. | High Bridge Borough | 0.92% | 3.4%(-2.51)#65 | 4.5%(-3.55)#994 |
| 66. | Haddonfield Borough | 0.92% | 3.4%(-2.51)#66 | 4.5%(-3.54)#1,009 |
| 67. | Shrewsbury Borough | 0.92% | 3.4%(-2.51)#67 | 4.5%(-3.54)#1,015 |
| 68. | Lincroft | 0.94% | 3.4%(-2.49)#68 | 4.5%(-3.53)#1,044 |
| 69. | Belvidere | 0.97% | 3.4%(-2.46)#69 | 4.5%(-3.49)#1,142 |
| 70. | Beachwood Borough | 0.97% | 3.4%(-2.46)#70 | 4.5%(-3.49)#1,144 |
| 71. | Island Heights Borough | 0.99% | 3.4%(-2.44)#71 | 4.5%(-3.47)#1,183 |
| 72. | Newfield Borough | 1.00% | 3.4%(-2.43)#72 | 4.5%(-3.47)#1,195 |
| 73. | Lake Hopatcong | 1.0% | 3.4%(-2.42)#73 | 4.5%(-3.45)#1,227 |
| 74. | Mercerville | 1.0% | 3.4%(-2.42)#74 | 4.5%(-3.45)#1,228 |
| 75. | Ramblewood | 1.0% | 3.4%(-2.41)#75 | 4.5%(-3.44)#1,253 |
| 76. | Woodcliff Lake Borough | 1.1% | 3.4%(-2.37)#76 | 4.5%(-3.40)#1,348 |
| 77. | Laurel Springs Borough | 1.1% | 3.4%(-2.36)#77 | 4.5%(-3.39)#1,371 |
| 78. | Milltown Borough | 1.1% | 3.4%(-2.36)#78 | 4.5%(-3.39)#1,375 |
| 79. | Estell Manor | 1.1% | 3.4%(-2.35)#79 | 4.5%(-3.38)#1,388 |
| 80. | Mount Hope | 1.1% | 3.4%(-2.34)#80 | 4.5%(-3.37)#1,399 |
| 81. | Beach Haven West | 1.1% | 3.4%(-2.33)#81 | 4.5%(-3.36)#1,432 |
| 82. | Princeton Meadows | 1.1% | 3.4%(-2.32)#82 | 4.5%(-3.35)#1,460 |
| 83. | Oak Valley | 1.1% | 3.4%(-2.32)#83 | 4.5%(-3.35)#1,461 |
| 84. | Chester Borough | 1.1% | 3.4%(-2.32)#84 | 4.5%(-3.35)#1,464 |
| 85. | Far Hills Borough | 1.1% | 3.4%(-2.31)#85 | 4.5%(-3.34)#1,471 |
| 86. | Ringwood Borough | 1.1% | 3.4%(-2.30)#86 | 4.5%(-3.33)#1,496 |
| 87. | Hoboken | 1.1% | 3.4%(-2.29)#87 | 4.5%(-3.33)#1,511 |
| 88. | Fairton | 1.1% | 3.4%(-2.29)#88 | 4.5%(-3.32)#1,535 |
| 89. | North Beach Haven | 1.2% | 3.4%(-2.28)#89 | 4.5%(-3.31)#1,563 |
| 90. | Colonia | 1.2% | 3.4%(-2.25)#90 | 4.5%(-3.28)#1,630 |
| 91. | Brookdale | 1.2% | 3.4%(-2.24)#91 | 4.5%(-3.27)#1,648 |
| 92. | Echelon | 1.2% | 3.4%(-2.24)#92 | 4.5%(-3.27)#1,649 |
| 93. | Cranbury | 1.2% | 3.4%(-2.23)#93 | 4.5%(-3.26)#1,686 |
| 94. | Lake Como Borough | 1.2% | 3.4%(-2.22)#94 | 4.5%(-3.26)#1,693 |
| 95. | Upper Greenwood Lake | 1.2% | 3.4%(-2.22)#95 | 4.5%(-3.26)#1,702 |
| 96. | Summit | 1.2% | 3.4%(-2.22)#96 | 4.5%(-3.25)#1,721 |
| 97. | Point Pleasant Borough | 1.2% | 3.4%(-2.20)#97 | 4.5%(-3.24)#1,741 |
| 98. | Emerson Borough | 1.3% | 3.4%(-2.18)#98 | 4.5%(-3.21)#1,795 |
| 99. | Wenonah Borough | 1.3% | 3.4%(-2.17)#99 | 4.5%(-3.20)#1,813 |
| 100. | Oak Ridge | 1.3% | 3.4%(-2.15)#100 | 4.5%(-3.19)#1,869 |
Common Questions
What are the Top 10 Cities with the Lowest Poverty Level Among Married Couples in New Jersey?
Top 10 Cities with the Lowest Poverty Level Among Married Couples in New Jersey are:
#1
0.13%
#2
0.22%
#3
0.29%
#4
0.41%
#5
0.42%
#6
0.45%
#7
0.50%
#8
0.59%
#9
0.61%
#10
0.61%
What city has the Lowest Poverty Level Among Married Couples in New Jersey?
Ridgewood has the Lowest Poverty Level Among Married Couples in New Jersey with 0.13%.
What is the Poverty Level Among Married Couples in the State of New Jersey?
Poverty Level Among Married Couples in New Jersey is 3.4%.
What is the Poverty Level Among Married Couples in the United States?
Poverty Level Among Married Couples in the United States is 4.5%.