Cities with the Highest Percentage of Irish Population in New Jersey
RELATED REPORTS & OPTIONS
Irish
New Jersey
Compare Cities
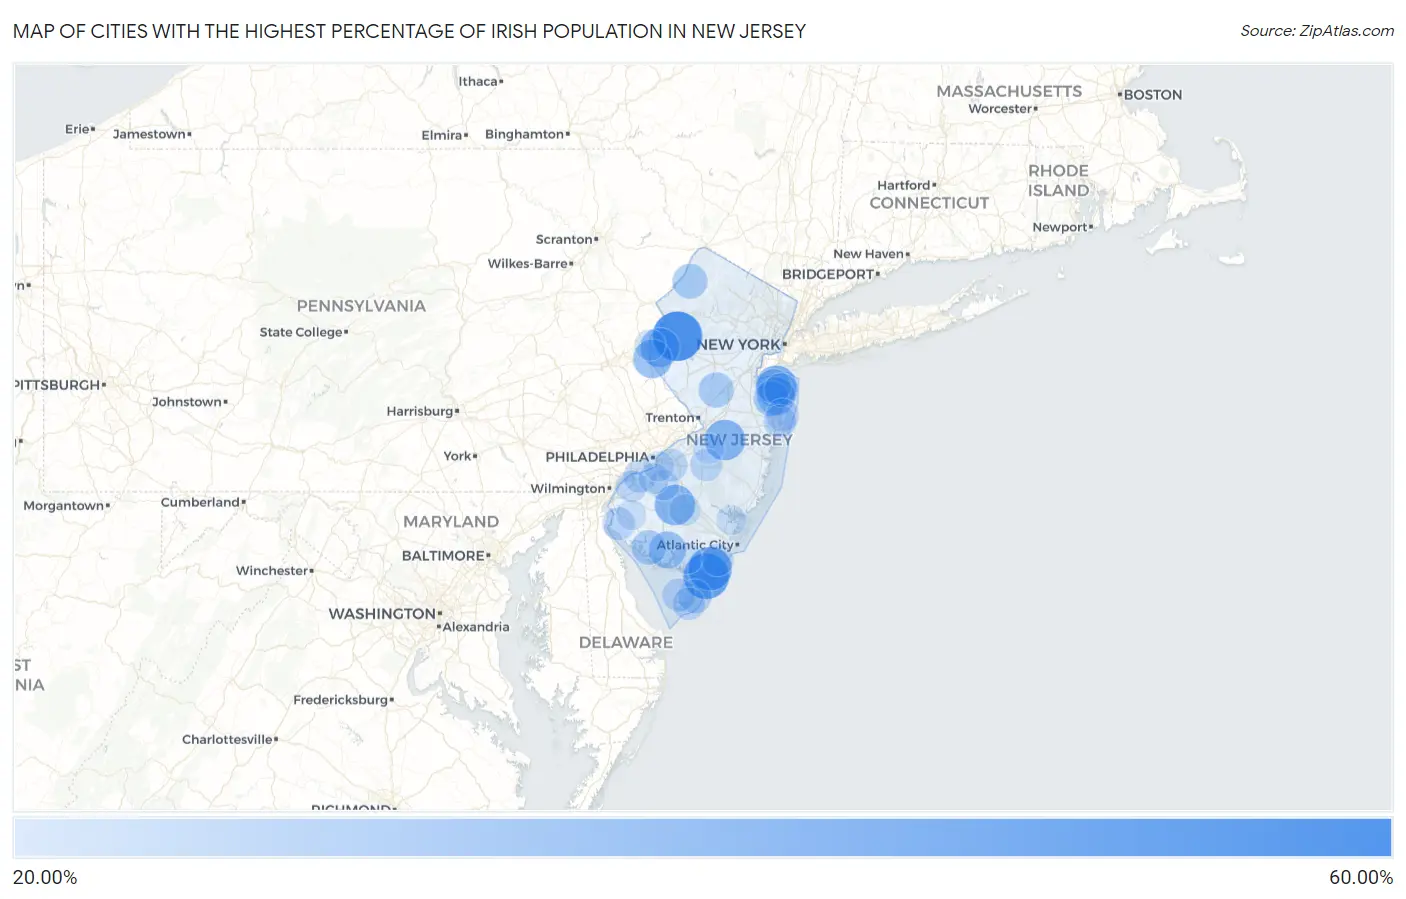
Map of Cities with the Highest Percentage of Irish Population in New Jersey
0.00%
60.00%
Cities with the Highest Percentage of Irish Population in New Jersey
| City | Irish | vs State | vs National | |
| 1. | Port Colden | 52.00% | 12.49%(+39.5)#1 | 9.46%(+42.5)#187 |
| 2. | Hewitt | 47.95% | 12.49%(+35.5)#2 | 9.46%(+38.5)#254 |
| 3. | Sea Girt Borough | 47.17% | 12.49%(+34.7)#3 | 9.46%(+37.7)#270 |
| 4. | Sea Isle City | 47.14% | 12.49%(+34.7)#4 | 9.46%(+37.7)#272 |
| 5. | Sweetwater | 45.15% | 12.49%(+32.7)#5 | 9.46%(+35.7)#318 |
| 6. | Strathmere | 44.63% | 12.49%(+32.1)#6 | 9.46%(+35.2)#327 |
| 7. | Dennisville | 41.99% | 12.49%(+29.5)#7 | 9.46%(+32.5)#386 |
| 8. | Belford | 41.71% | 12.49%(+29.2)#8 | 9.46%(+32.2)#395 |
| 9. | New Egypt | 40.79% | 12.49%(+28.3)#9 | 9.46%(+31.3)#421 |
| 10. | Victory Lakes | 40.62% | 12.49%(+28.1)#10 | 9.46%(+31.2)#432 |
| 11. | Woodbury Heights Borough | 39.97% | 12.49%(+27.5)#11 | 9.46%(+30.5)#460 |
| 12. | Manasquan Borough | 39.74% | 12.49%(+27.3)#12 | 9.46%(+30.3)#470 |
| 13. | Stewartsville | 39.12% | 12.49%(+26.6)#13 | 9.46%(+29.7)#487 |
| 14. | Palermo | 38.63% | 12.49%(+26.1)#14 | 9.46%(+29.2)#502 |
| 15. | Finesville | 38.37% | 12.49%(+25.9)#15 | 9.46%(+28.9)#517 |
| 16. | Grenloch | 38.27% | 12.49%(+25.8)#16 | 9.46%(+28.8)#522 |
| 17. | New Gretna | 38.10% | 12.49%(+25.6)#17 | 9.46%(+28.6)#530 |
| 18. | Avon By The Sea Borough | 38.00% | 12.49%(+25.5)#18 | 9.46%(+28.5)#535 |
| 19. | Fairview | 37.79% | 12.49%(+25.3)#19 | 9.46%(+28.3)#550 |
| 20. | Spring Lake Heights Borough | 37.69% | 12.49%(+25.2)#20 | 9.46%(+28.2)#554 |
| 21. | National Park Borough | 37.12% | 12.49%(+24.6)#21 | 9.46%(+27.7)#570 |
| 22. | Fair Haven Borough | 37.08% | 12.49%(+24.6)#22 | 9.46%(+27.6)#572 |
| 23. | Gandys Beach | 36.67% | 12.49%(+24.2)#23 | 9.46%(+27.2)#590 |
| 24. | Laurel Lake | 36.53% | 12.49%(+24.0)#24 | 9.46%(+27.1)#600 |
| 25. | Dorchester | 36.20% | 12.49%(+23.7)#25 | 9.46%(+26.7)#615 |
| 26. | Sunset Lake | 36.16% | 12.49%(+23.7)#26 | 9.46%(+26.7)#621 |
| 27. | West Wildwood Borough | 35.36% | 12.49%(+22.9)#27 | 9.46%(+25.9)#659 |
| 28. | Audubon Park Borough | 35.31% | 12.49%(+22.8)#28 | 9.46%(+25.8)#661 |
| 29. | Port Elizabeth | 35.27% | 12.49%(+22.8)#29 | 9.46%(+25.8)#666 |
| 30. | Spring Lake Borough | 35.04% | 12.49%(+22.6)#30 | 9.46%(+25.6)#671 |
| 31. | Westmont | 35.00% | 12.49%(+22.5)#31 | 9.46%(+25.5)#673 |
| 32. | Ocean Gate Borough | 34.96% | 12.49%(+22.5)#32 | 9.46%(+25.5)#677 |
| 33. | Laurel Springs Borough | 34.38% | 12.49%(+21.9)#33 | 9.46%(+24.9)#712 |
| 34. | South Dennis | 34.33% | 12.49%(+21.8)#34 | 9.46%(+24.9)#715 |
| 35. | Barrington Borough | 34.12% | 12.49%(+21.6)#35 | 9.46%(+24.7)#727 |
| 36. | Marshallville | 34.07% | 12.49%(+21.6)#36 | 9.46%(+24.6)#731 |
| 37. | East Rocky Hill | 34.06% | 12.49%(+21.6)#37 | 9.46%(+24.6)#732 |
| 38. | Lincroft | 33.96% | 12.49%(+21.5)#38 | 9.46%(+24.5)#740 |
| 39. | Crandon Lakes | 33.83% | 12.49%(+21.3)#39 | 9.46%(+24.4)#750 |
| 40. | Mount Ephraim Borough | 33.48% | 12.49%(+21.0)#40 | 9.46%(+24.0)#769 |
| 41. | Cedarville | 33.46% | 12.49%(+21.0)#41 | 9.46%(+24.0)#772 |
| 42. | Cumberland-Hesstown | 33.33% | 12.49%(+20.8)#42 | 9.46%(+23.9)#776 |
| 43. | Port Monmouth | 32.90% | 12.49%(+20.4)#43 | 9.46%(+23.4)#816 |
| 44. | Crosswicks | 32.84% | 12.49%(+20.4)#44 | 9.46%(+23.4)#822 |
| 45. | Haddon Heights Borough | 32.62% | 12.49%(+20.1)#45 | 9.46%(+23.2)#838 |
| 46. | Harrisonville | 32.48% | 12.49%(+20.0)#46 | 9.46%(+23.0)#850 |
| 47. | Bedminster | 32.32% | 12.49%(+19.8)#47 | 9.46%(+22.9)#864 |
| 48. | North Wildwood | 32.26% | 12.49%(+19.8)#48 | 9.46%(+22.8)#871 |
| 49. | Belmar Borough | 32.26% | 12.49%(+19.8)#49 | 9.46%(+22.8)#872 |
| 50. | Navesink | 32.25% | 12.49%(+19.8)#50 | 9.46%(+22.8)#873 |
| 51. | Little Silver Borough | 32.19% | 12.49%(+19.7)#51 | 9.46%(+22.7)#879 |
| 52. | Stone Harbor Borough | 32.13% | 12.49%(+19.6)#52 | 9.46%(+22.7)#886 |
| 53. | Audubon Borough | 32.05% | 12.49%(+19.6)#53 | 9.46%(+22.6)#894 |
| 54. | Medford Lakes Borough | 32.02% | 12.49%(+19.5)#54 | 9.46%(+22.6)#898 |
| 55. | Pine Beach Borough | 31.89% | 12.49%(+19.4)#55 | 9.46%(+22.4)#912 |
| 56. | West Cape May Borough | 31.82% | 12.49%(+19.3)#56 | 9.46%(+22.4)#918 |
| 57. | Oaklyn Borough | 31.75% | 12.49%(+19.3)#57 | 9.46%(+22.3)#927 |
| 58. | Lake Como Borough | 31.70% | 12.49%(+19.2)#58 | 9.46%(+22.2)#934 |
| 59. | Villas | 31.58% | 12.49%(+19.1)#59 | 9.46%(+22.1)#945 |
| 60. | Gibbstown | 31.52% | 12.49%(+19.0)#60 | 9.46%(+22.1)#949 |
| 61. | Waldwick Borough | 31.42% | 12.49%(+18.9)#61 | 9.46%(+22.0)#957 |
| 62. | Wanamassa | 31.28% | 12.49%(+18.8)#62 | 9.46%(+21.8)#965 |
| 63. | Bay Head Borough | 31.20% | 12.49%(+18.7)#63 | 9.46%(+21.7)#978 |
| 64. | Shark River Hills | 31.16% | 12.49%(+18.7)#64 | 9.46%(+21.7)#982 |
| 65. | Oceanville | 31.11% | 12.49%(+18.6)#65 | 9.46%(+21.7)#990 |
| 66. | Hancocks Bridge | 31.03% | 12.49%(+18.5)#66 | 9.46%(+21.6)#999 |
| 67. | Diamond Beach | 30.97% | 12.49%(+18.5)#67 | 9.46%(+21.5)#1,006 |
| 68. | Seaville | 30.85% | 12.49%(+18.4)#68 | 9.46%(+21.4)#1,022 |
| 69. | Barclay | 30.75% | 12.49%(+18.3)#69 | 9.46%(+21.3)#1,033 |
| 70. | Leisuretowne | 30.71% | 12.49%(+18.2)#70 | 9.46%(+21.2)#1,038 |
| 71. | Ocean City | 30.66% | 12.49%(+18.2)#71 | 9.46%(+21.2)#1,042 |
| 72. | Silver Lake Cdp Warren County | 30.56% | 12.49%(+18.1)#72 | 9.46%(+21.1)#1,058 |
| 73. | Milmay | 30.23% | 12.49%(+17.7)#73 | 9.46%(+20.8)#1,099 |
| 74. | Interlaken Borough | 30.05% | 12.49%(+17.6)#74 | 9.46%(+20.6)#1,119 |
| 75. | Beckett | 29.91% | 12.49%(+17.4)#75 | 9.46%(+20.5)#1,134 |
| 76. | Malaga | 29.87% | 12.49%(+17.4)#76 | 9.46%(+20.4)#1,139 |
| 77. | Collings Lakes | 29.75% | 12.49%(+17.3)#77 | 9.46%(+20.3)#1,158 |
| 78. | Dutch Neck | 29.66% | 12.49%(+17.2)#78 | 9.46%(+20.2)#1,168 |
| 79. | Sewell | 29.50% | 12.49%(+17.0)#79 | 9.46%(+20.0)#1,192 |
| 80. | Mantoloking Borough | 29.50% | 12.49%(+17.0)#80 | 9.46%(+20.0)#1,193 |
| 81. | Farmingdale Borough | 29.41% | 12.49%(+16.9)#81 | 9.46%(+20.0)#1,207 |
| 82. | Pitman Borough | 29.14% | 12.49%(+16.7)#82 | 9.46%(+19.7)#1,242 |
| 83. | West Berlin | 29.13% | 12.49%(+16.6)#83 | 9.46%(+19.7)#1,243 |
| 84. | Point Pleasant Beach Borough | 29.13% | 12.49%(+16.6)#84 | 9.46%(+19.7)#1,244 |
| 85. | Lower Berkshire Valley | 29.09% | 12.49%(+16.6)#85 | 9.46%(+19.6)#1,252 |
| 86. | Delaware Park | 29.07% | 12.49%(+16.6)#86 | 9.46%(+19.6)#1,256 |
| 87. | Turnersville | 29.01% | 12.49%(+16.5)#87 | 9.46%(+19.5)#1,266 |
| 88. | Seaside Park Borough | 28.85% | 12.49%(+16.4)#88 | 9.46%(+19.4)#1,285 |
| 89. | Goshen | 28.84% | 12.49%(+16.4)#89 | 9.46%(+19.4)#1,288 |
| 90. | Oak Valley | 28.69% | 12.49%(+16.2)#90 | 9.46%(+19.2)#1,305 |
| 91. | Keansburg Borough | 28.65% | 12.49%(+16.2)#91 | 9.46%(+19.2)#1,311 |
| 92. | Gloucester City | 28.44% | 12.49%(+16.0)#92 | 9.46%(+19.0)#1,341 |
| 93. | Chatham Borough | 28.44% | 12.49%(+16.0)#93 | 9.46%(+19.0)#1,343 |
| 94. | Juliustown | 28.36% | 12.49%(+15.9)#94 | 9.46%(+18.9)#1,357 |
| 95. | Port Republic | 28.27% | 12.49%(+15.8)#95 | 9.46%(+18.8)#1,372 |
| 96. | Branchville Borough | 28.11% | 12.49%(+15.6)#96 | 9.46%(+18.6)#1,407 |
| 97. | Belleplain | 28.08% | 12.49%(+15.6)#97 | 9.46%(+18.6)#1,410 |
| 98. | Allentown Borough | 28.01% | 12.49%(+15.5)#98 | 9.46%(+18.6)#1,425 |
| 99. | Alloway | 28.01% | 12.49%(+15.5)#99 | 9.46%(+18.6)#1,426 |
| 100. | Sea Bright Borough | 27.99% | 12.49%(+15.5)#100 | 9.46%(+18.5)#1,433 |
Common Questions
What are the Top 10 Cities with the Highest Percentage of Irish Population in New Jersey?
Top 10 Cities with the Highest Percentage of Irish Population in New Jersey are:
#1
52.00%
#2
47.14%
#3
44.63%
#4
41.71%
#5
40.79%
#6
40.62%
#7
39.12%
#8
38.37%
#9
37.79%
#10
36.53%
What city has the Highest Percentage of Irish Population in New Jersey?
Port Colden has the Highest Percentage of Irish Population in New Jersey with 52.00%.
What is the Percentage of Irish Population in the State of New Jersey?
Percentage of Irish Population in New Jersey is 12.49%.
What is the Percentage of Irish Population in the United States?
Percentage of Irish Population in the United States is 9.46%.