Lake Telemark, NJ Map & Demographics
Lake Telemark Map
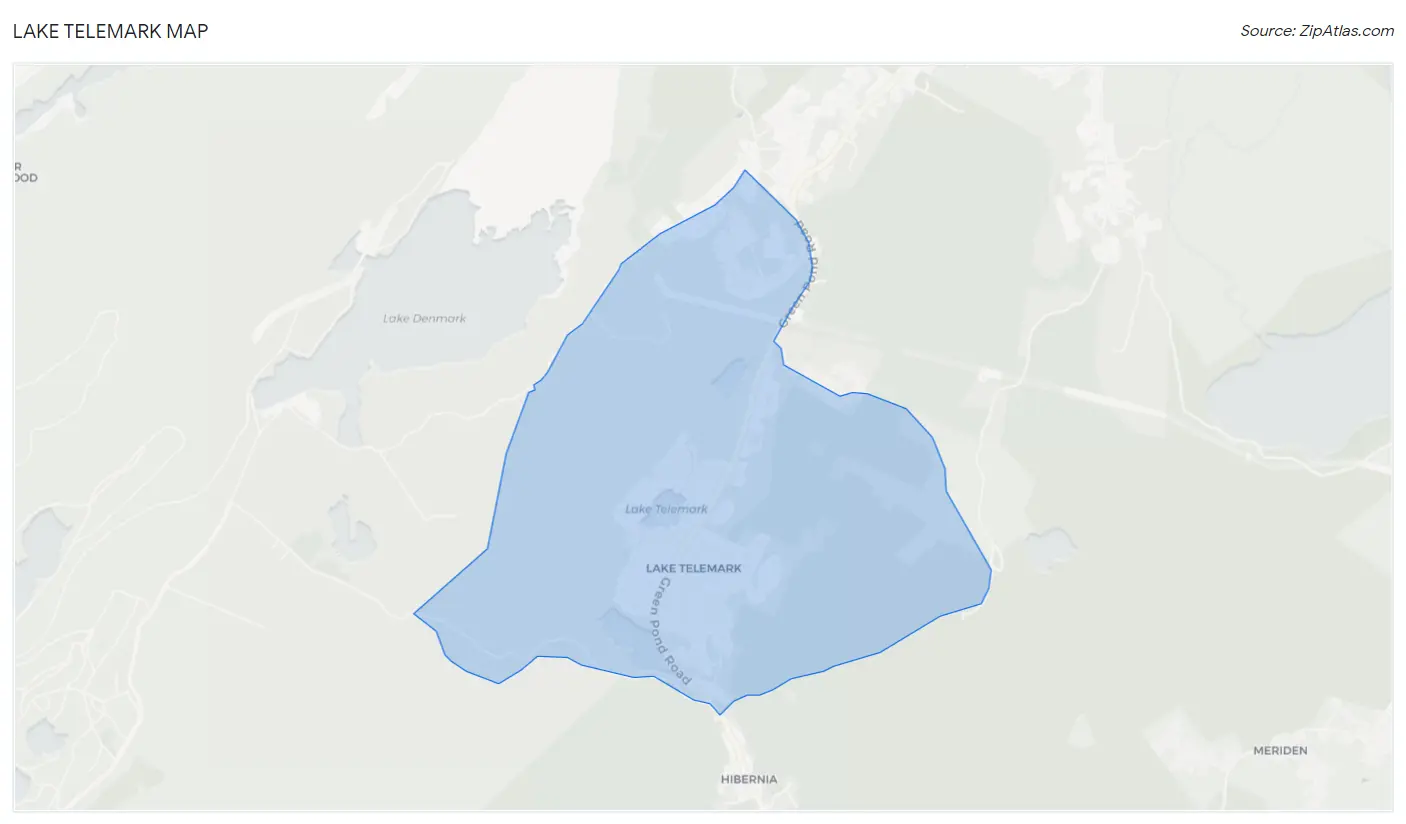
Lake Telemark Overview
$55,468
PER CAPITA INCOME
$184,091
AVG FAMILY INCOME
$168,448
AVG HOUSEHOLD INCOME
29.1%
WAGE / INCOME GAP [ % ]
70.9¢/ $1
WAGE / INCOME GAP [ $ ]
0.39
INEQUALITY / GINI INDEX
1,301
TOTAL POPULATION
638
MALE POPULATION
663
FEMALE POPULATION
96.23
MALES / 100 FEMALES
103.92
FEMALES / 100 MALES
38.8
MEDIAN AGE
3.5
AVG FAMILY SIZE
2.8
AVG HOUSEHOLD SIZE
812
LABOR FORCE [ PEOPLE ]
72.2%
PERCENT IN LABOR FORCE
2.5%
UNEMPLOYMENT RATE
Income in Lake Telemark
Income Overview in Lake Telemark
Per Capita Income in Lake Telemark is $55,468, while median incomes of families and households are $184,091 and $168,448 respectively.
| Characteristic | Number | Measure |
| Per Capita Income | 1,301 | $55,468 |
| Median Family Income | 324 | $184,091 |
| Mean Family Income | 324 | $188,442 |
| Median Household Income | 458 | $168,448 |
| Mean Household Income | 458 | $156,274 |
| Income Deficit | 324 | $0 |
| Wage / Income Gap (%) | 1,301 | 29.06% |
| Wage / Income Gap ($) | 1,301 | 70.94¢ per $1 |
| Gini / Inequality Index | 1,301 | 0.39 |
Earnings by Sex in Lake Telemark
Average Earnings in Lake Telemark are $53,152, $59,205 for men and $42,000 for women, a difference of 29.1%.
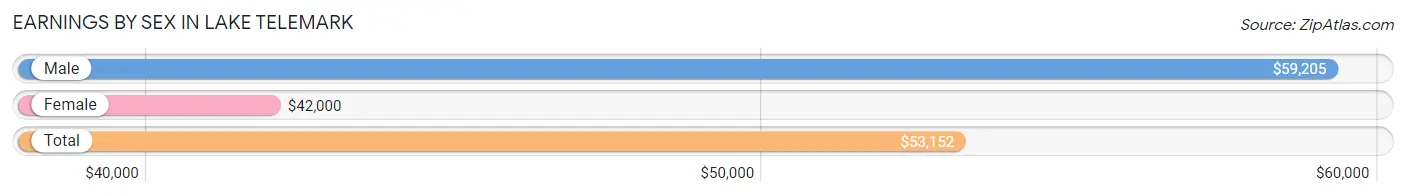
| Sex | Number | Average Earnings |
| Male | 444 (52.9%) | $59,205 |
| Female | 396 (47.1%) | $42,000 |
| Total | 840 (100.0%) | $53,152 |
Earnings by Sex by Income Bracket in Lake Telemark
The most common earnings brackets in Lake Telemark are $100,000+ for men (152 | 34.2%) and $100,000+ for women (75 | 18.9%).
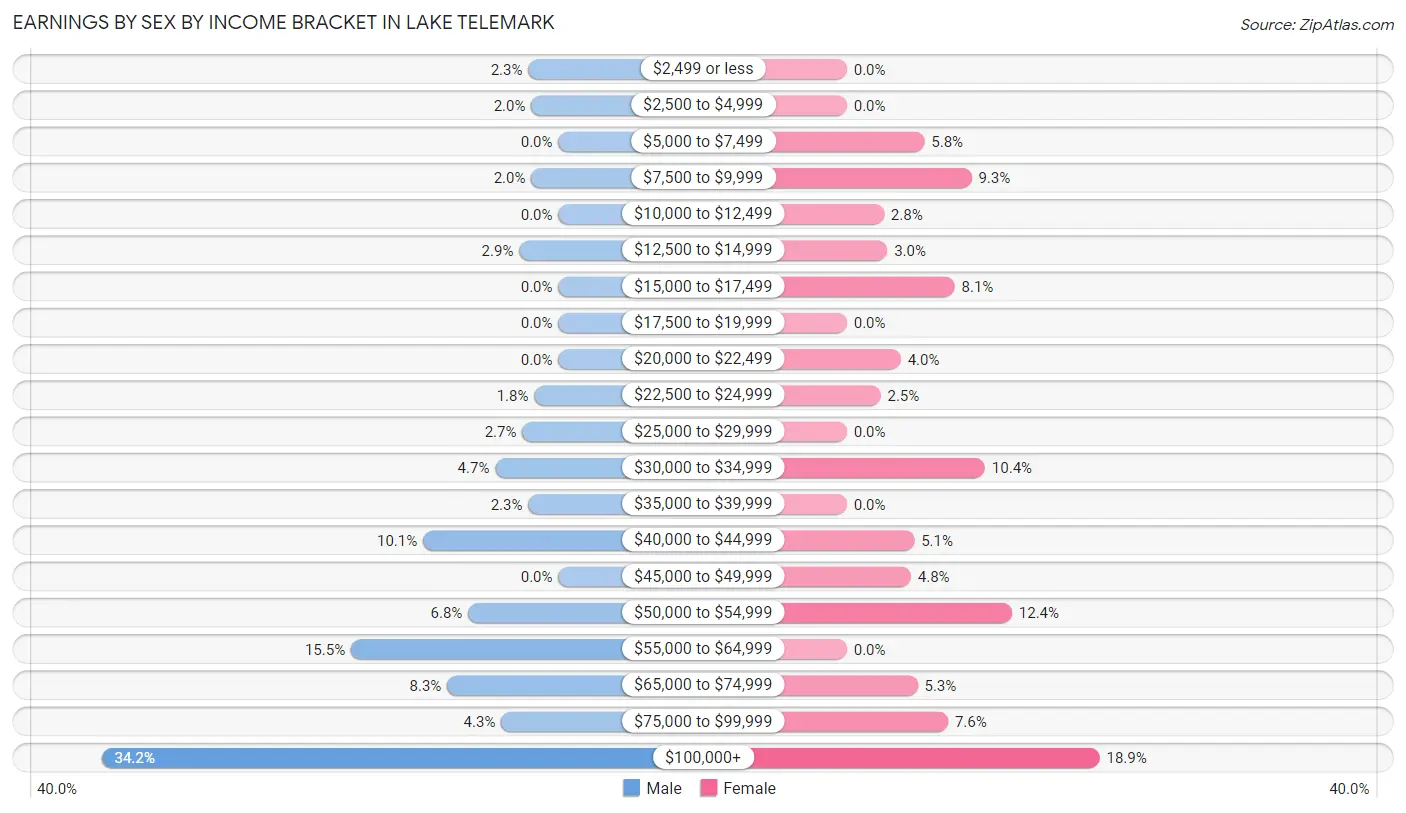
| Income | Male | Female |
| $2,499 or less | 10 (2.2%) | 0 (0.0%) |
| $2,500 to $4,999 | 9 (2.0%) | 0 (0.0%) |
| $5,000 to $7,499 | 0 (0.0%) | 23 (5.8%) |
| $7,500 to $9,999 | 9 (2.0%) | 37 (9.3%) |
| $10,000 to $12,499 | 0 (0.0%) | 11 (2.8%) |
| $12,500 to $14,999 | 13 (2.9%) | 12 (3.0%) |
| $15,000 to $17,499 | 0 (0.0%) | 32 (8.1%) |
| $17,500 to $19,999 | 0 (0.0%) | 0 (0.0%) |
| $20,000 to $22,499 | 0 (0.0%) | 16 (4.0%) |
| $22,500 to $24,999 | 8 (1.8%) | 10 (2.5%) |
| $25,000 to $29,999 | 12 (2.7%) | 0 (0.0%) |
| $30,000 to $34,999 | 21 (4.7%) | 41 (10.3%) |
| $35,000 to $39,999 | 10 (2.2%) | 0 (0.0%) |
| $40,000 to $44,999 | 45 (10.1%) | 20 (5.1%) |
| $45,000 to $49,999 | 0 (0.0%) | 19 (4.8%) |
| $50,000 to $54,999 | 30 (6.8%) | 49 (12.4%) |
| $55,000 to $64,999 | 69 (15.5%) | 0 (0.0%) |
| $65,000 to $74,999 | 37 (8.3%) | 21 (5.3%) |
| $75,000 to $99,999 | 19 (4.3%) | 30 (7.6%) |
| $100,000+ | 152 (34.2%) | 75 (18.9%) |
| Total | 444 (100.0%) | 396 (100.0%) |
Earnings by Sex by Educational Attainment in Lake Telemark
Average earnings in Lake Telemark are $72,703 for men and $50,510 for women, a difference of 30.5%. Men with an educational attainment of graduate degree enjoy the highest average annual earnings of $144,615, while those with high school diploma education earn the least with $53,370. Women with an educational attainment of graduate degree earn the most with the average annual earnings of $109,531, while those with bachelor's degree education have the smallest earnings of $51,403.
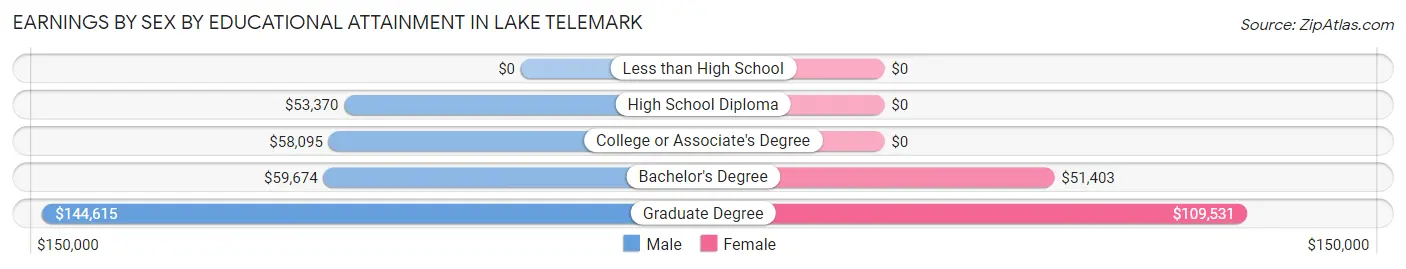
| Educational Attainment | Male Income | Female Income |
| Less than High School | - | - |
| High School Diploma | $53,370 | $0 |
| College or Associate's Degree | $58,095 | $0 |
| Bachelor's Degree | $59,674 | $51,403 |
| Graduate Degree | $144,615 | $109,531 |
| Total | $72,703 | $50,510 |
Family Income in Lake Telemark
Family Income Brackets in Lake Telemark
According to the Lake Telemark family income data, there are 137 families falling into the $150,000 to $199,999 income range, which is the most common income bracket and makes up 42.3% of all families.
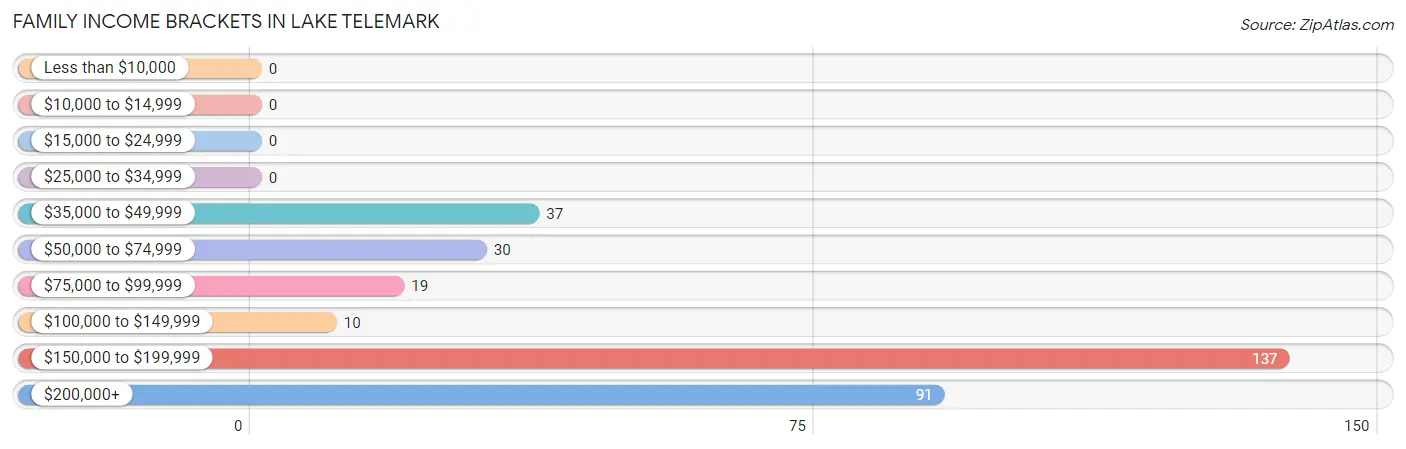
| Income Bracket | # Families | % Families |
| Less than $10,000 | 0 | 0.0% |
| $10,000 to $14,999 | 0 | 0.0% |
| $15,000 to $24,999 | 0 | 0.0% |
| $25,000 to $34,999 | 0 | 0.0% |
| $35,000 to $49,999 | 37 | 11.4% |
| $50,000 to $74,999 | 30 | 9.3% |
| $75,000 to $99,999 | 19 | 5.9% |
| $100,000 to $149,999 | 10 | 3.1% |
| $150,000 to $199,999 | 137 | 42.3% |
| $200,000+ | 91 | 28.1% |
Family Income by Famaliy Size in Lake Telemark
4-person families (92 | 28.4%) account for the highest median family income in Lake Telemark with $192,917 per family, while 3-person families (86 | 26.5%) have the highest median income of $63,908 per family member.
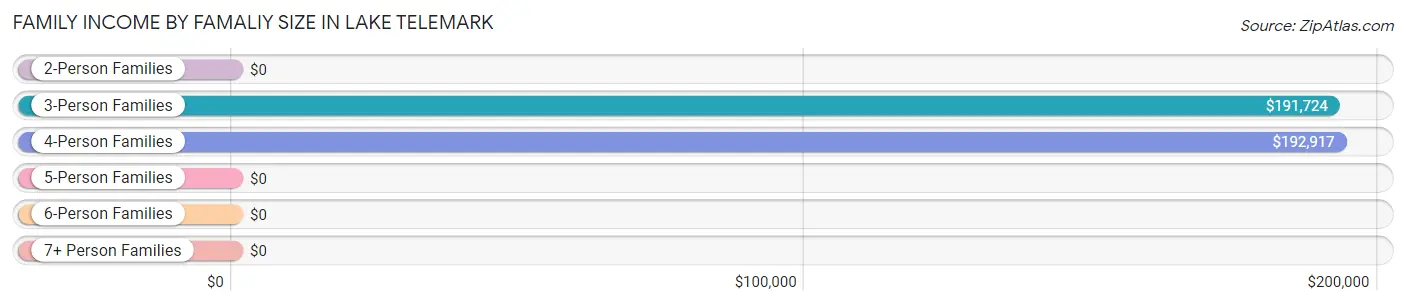
| Income Bracket | # Families | Median Income |
| 2-Person Families | 103 (31.8%) | $0 |
| 3-Person Families | 86 (26.5%) | $191,724 |
| 4-Person Families | 92 (28.4%) | $192,917 |
| 5-Person Families | 29 (8.9%) | $0 |
| 6-Person Families | 14 (4.3%) | $0 |
| 7+ Person Families | 0 (0.0%) | $0 |
| Total | 324 (100.0%) | $184,091 |
Family Income by Number of Earners in Lake Telemark
The median family income in Lake Telemark is $184,091, with families comprising 3+ earners (109) having the highest median family income of $203,155, while families with no earners (55) have the lowest median family income of $58,854, accounting for 33.6% and 17.0% of families, respectively.
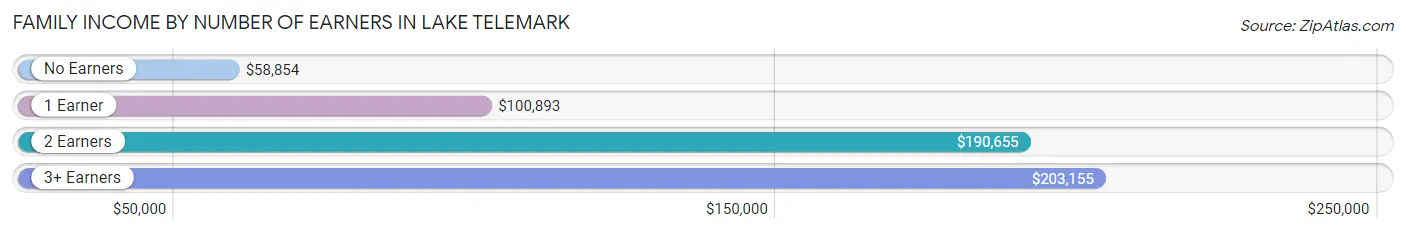
| Number of Earners | # Families | Median Income |
| No Earners | 55 (17.0%) | $58,854 |
| 1 Earner | 35 (10.8%) | $100,893 |
| 2 Earners | 125 (38.6%) | $190,655 |
| 3+ Earners | 109 (33.6%) | $203,155 |
| Total | 324 (100.0%) | $184,091 |
Household Income in Lake Telemark
Household Income Brackets in Lake Telemark
With 137 households falling in the category, the $150,000 to $199,999 income range is the most frequent in Lake Telemark, accounting for 29.9% of all households.
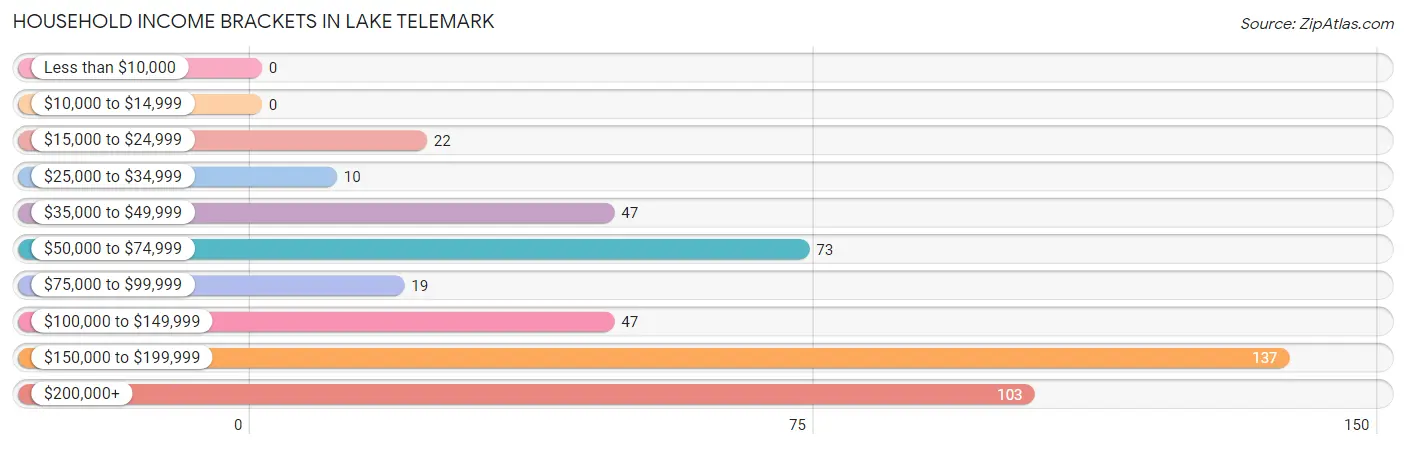
| Income Bracket | # Households | % Households |
| Less than $10,000 | 0 | 0.0% |
| $10,000 to $14,999 | 0 | 0.0% |
| $15,000 to $24,999 | 22 | 4.8% |
| $25,000 to $34,999 | 10 | 2.2% |
| $35,000 to $49,999 | 47 | 10.3% |
| $50,000 to $74,999 | 73 | 15.9% |
| $75,000 to $99,999 | 19 | 4.1% |
| $100,000 to $149,999 | 47 | 10.3% |
| $150,000 to $199,999 | 137 | 29.9% |
| $200,000+ | 103 | 22.5% |
Household Income by Householder Age in Lake Telemark
The median household income in Lake Telemark is $168,448, with the highest median household income of $191,897 found in the 45 to 64 years age bracket for the primary householder. A total of 210 households (45.9%) fall into this category.
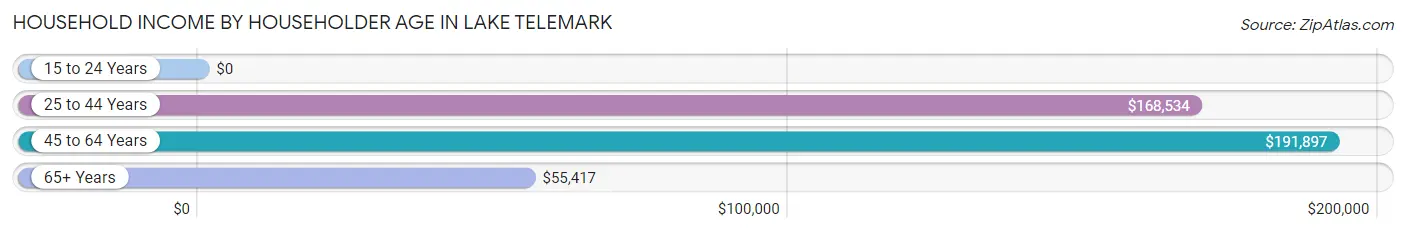
| Income Bracket | # Households | Median Income |
| 15 to 24 Years | 0 (0.0%) | $0 |
| 25 to 44 Years | 122 (26.6%) | $168,534 |
| 45 to 64 Years | 210 (45.9%) | $191,897 |
| 65+ Years | 126 (27.5%) | $55,417 |
| Total | 458 (100.0%) | $168,448 |
Poverty in Lake Telemark
Income Below Poverty by Sex and Age in Lake Telemark
With 1.4% poverty level for males and 1.8% for females among the residents of Lake Telemark, 65 to 74 year old males and 55 to 64 year old females are the most vulnerable to poverty, with 9 males (17.6%) and 12 females (8.8%) in their respective age groups living below the poverty level.
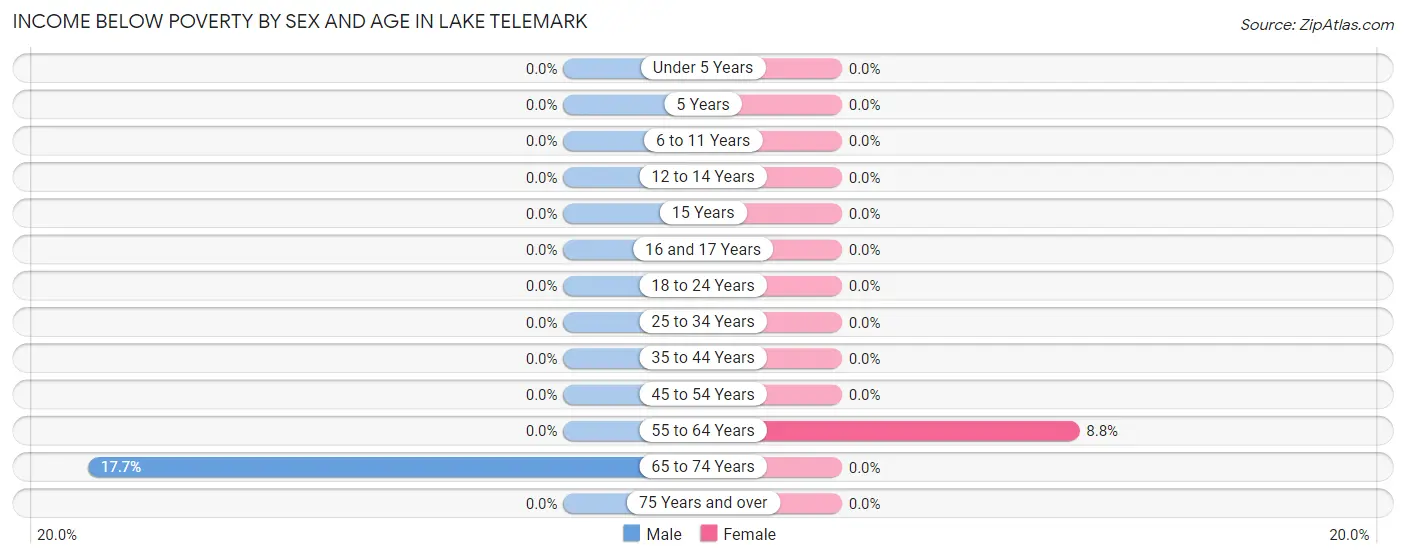
| Age Bracket | Male | Female |
| Under 5 Years | 0 (0.0%) | 0 (0.0%) |
| 5 Years | 0 (0.0%) | 0 (0.0%) |
| 6 to 11 Years | 0 (0.0%) | 0 (0.0%) |
| 12 to 14 Years | 0 (0.0%) | 0 (0.0%) |
| 15 Years | 0 (0.0%) | 0 (0.0%) |
| 16 and 17 Years | 0 (0.0%) | 0 (0.0%) |
| 18 to 24 Years | 0 (0.0%) | 0 (0.0%) |
| 25 to 34 Years | 0 (0.0%) | 0 (0.0%) |
| 35 to 44 Years | 0 (0.0%) | 0 (0.0%) |
| 45 to 54 Years | 0 (0.0%) | 0 (0.0%) |
| 55 to 64 Years | 0 (0.0%) | 12 (8.8%) |
| 65 to 74 Years | 9 (17.6%) | 0 (0.0%) |
| 75 Years and over | 0 (0.0%) | 0 (0.0%) |
| Total | 9 (1.4%) | 12 (1.8%) |
Income Above Poverty by Sex and Age in Lake Telemark
According to the poverty statistics in Lake Telemark, males aged 6 to 11 years and females aged under 5 years are the age groups that are most secure financially, with 100.0% of males and 100.0% of females in these age groups living above the poverty line.
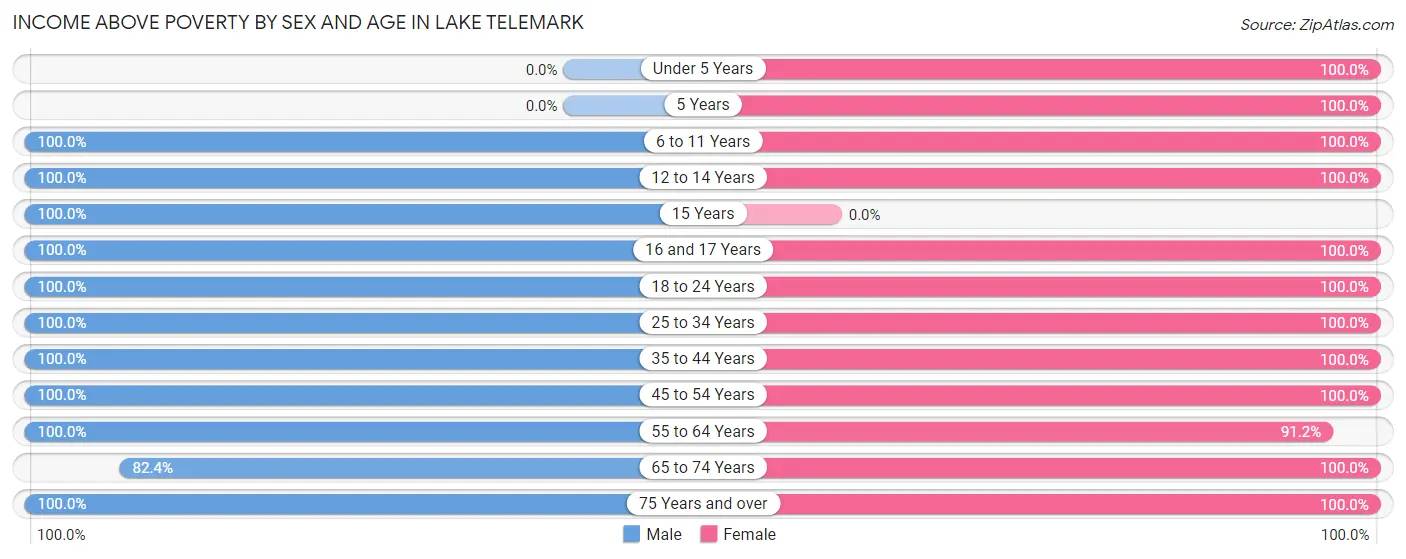
| Age Bracket | Male | Female |
| Under 5 Years | 0 (0.0%) | 41 (100.0%) |
| 5 Years | 0 (0.0%) | 23 (100.0%) |
| 6 to 11 Years | 30 (100.0%) | 27 (100.0%) |
| 12 to 14 Years | 7 (100.0%) | 31 (100.0%) |
| 15 Years | 17 (100.0%) | 0 (0.0%) |
| 16 and 17 Years | 7 (100.0%) | 12 (100.0%) |
| 18 to 24 Years | 122 (100.0%) | 79 (100.0%) |
| 25 to 34 Years | 94 (100.0%) | 85 (100.0%) |
| 35 to 44 Years | 90 (100.0%) | 62 (100.0%) |
| 45 to 54 Years | 36 (100.0%) | 63 (100.0%) |
| 55 to 64 Years | 152 (100.0%) | 124 (91.2%) |
| 65 to 74 Years | 42 (82.4%) | 41 (100.0%) |
| 75 Years and over | 32 (100.0%) | 63 (100.0%) |
| Total | 629 (98.6%) | 651 (98.2%) |
Income Below Poverty Among Married-Couple Families in Lake Telemark
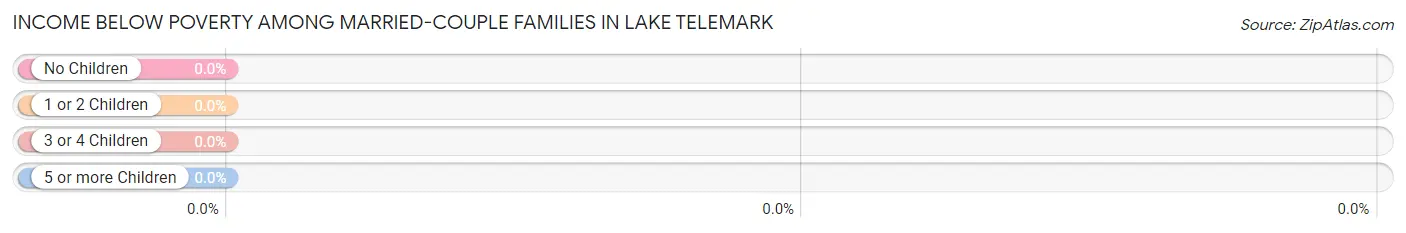
| Children | Above Poverty | Below Poverty |
| No Children | 194 (100.0%) | 0 (0.0%) |
| 1 or 2 Children | 63 (100.0%) | 0 (0.0%) |
| 3 or 4 Children | 14 (100.0%) | 0 (0.0%) |
| 5 or more Children | 0 (0.0%) | 0 (0.0%) |
| Total | 271 (100.0%) | 0 (0.0%) |
Income Below Poverty Among Single-Parent Households in Lake Telemark
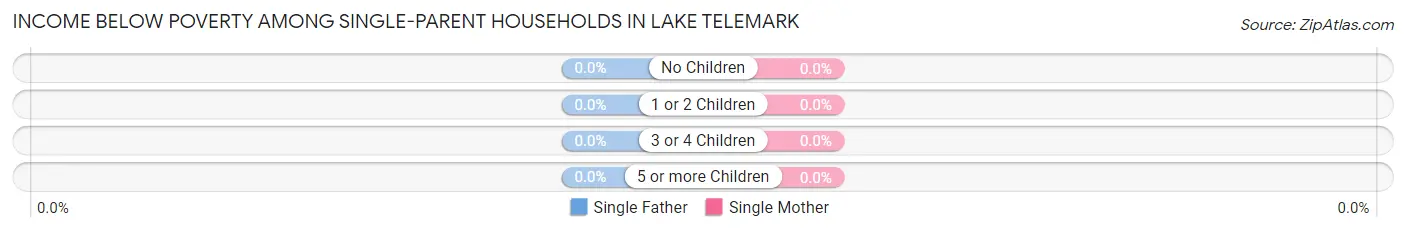
| Children | Single Father | Single Mother |
| No Children | 0 (0.0%) | 0 (0.0%) |
| 1 or 2 Children | 0 (0.0%) | 0 (0.0%) |
| 3 or 4 Children | 0 (0.0%) | 0 (0.0%) |
| 5 or more Children | 0 (0.0%) | 0 (0.0%) |
| Total | 0 (0.0%) | 0 (0.0%) |
Income Below Poverty Among Married-Couple vs Single-Parent Households in Lake Telemark
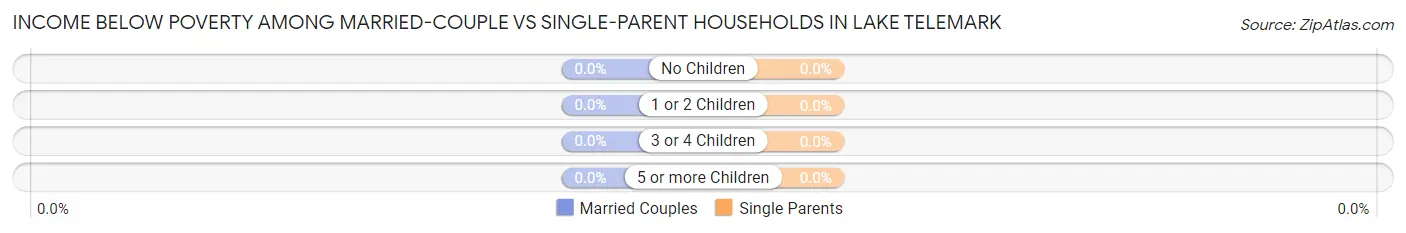
| Children | Married-Couple Families | Single-Parent Households |
| No Children | 0 (0.0%) | 0 (0.0%) |
| 1 or 2 Children | 0 (0.0%) | 0 (0.0%) |
| 3 or 4 Children | 0 (0.0%) | 0 (0.0%) |
| 5 or more Children | 0 (0.0%) | 0 (0.0%) |
| Total | 0 (0.0%) | 0 (0.0%) |
Race in Lake Telemark
The most populous races in Lake Telemark are White / Caucasian (1,250 | 96.1%), Hispanic or Latino (87 | 6.7%), and Asian (48 | 3.7%).
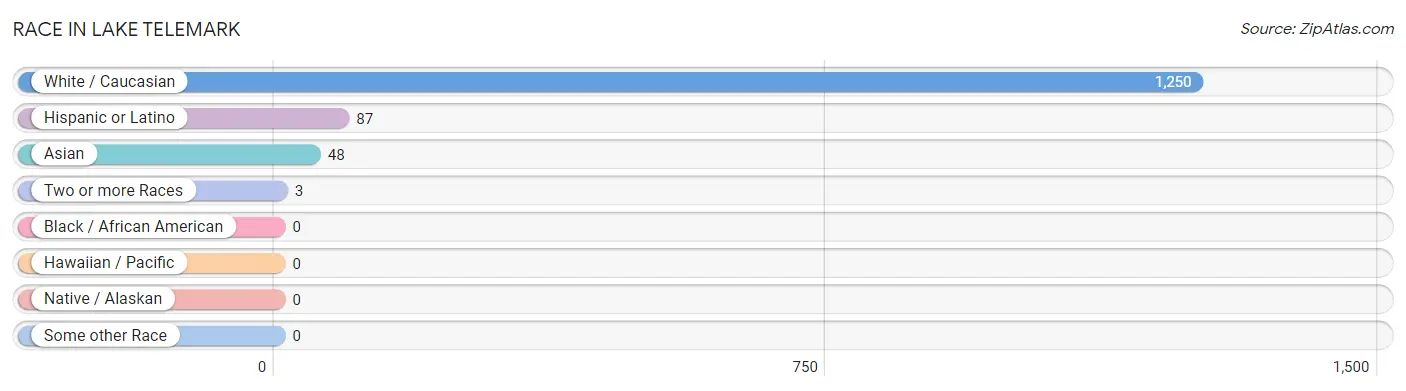
| Race | # Population | % Population |
| Asian | 48 | 3.7% |
| Black / African American | 0 | 0.0% |
| Hawaiian / Pacific | 0 | 0.0% |
| Hispanic or Latino | 87 | 6.7% |
| Native / Alaskan | 0 | 0.0% |
| White / Caucasian | 1,250 | 96.1% |
| Two or more Races | 3 | 0.2% |
| Some other Race | 0 | 0.0% |
| Total | 1,301 | 100.0% |
Ancestry in Lake Telemark
The most populous ancestries reported in Lake Telemark are Irish (289 | 22.2%), German (241 | 18.5%), Italian (207 | 15.9%), English (172 | 13.2%), and Polish (159 | 12.2%), together accounting for 82.1% of all Lake Telemark residents.
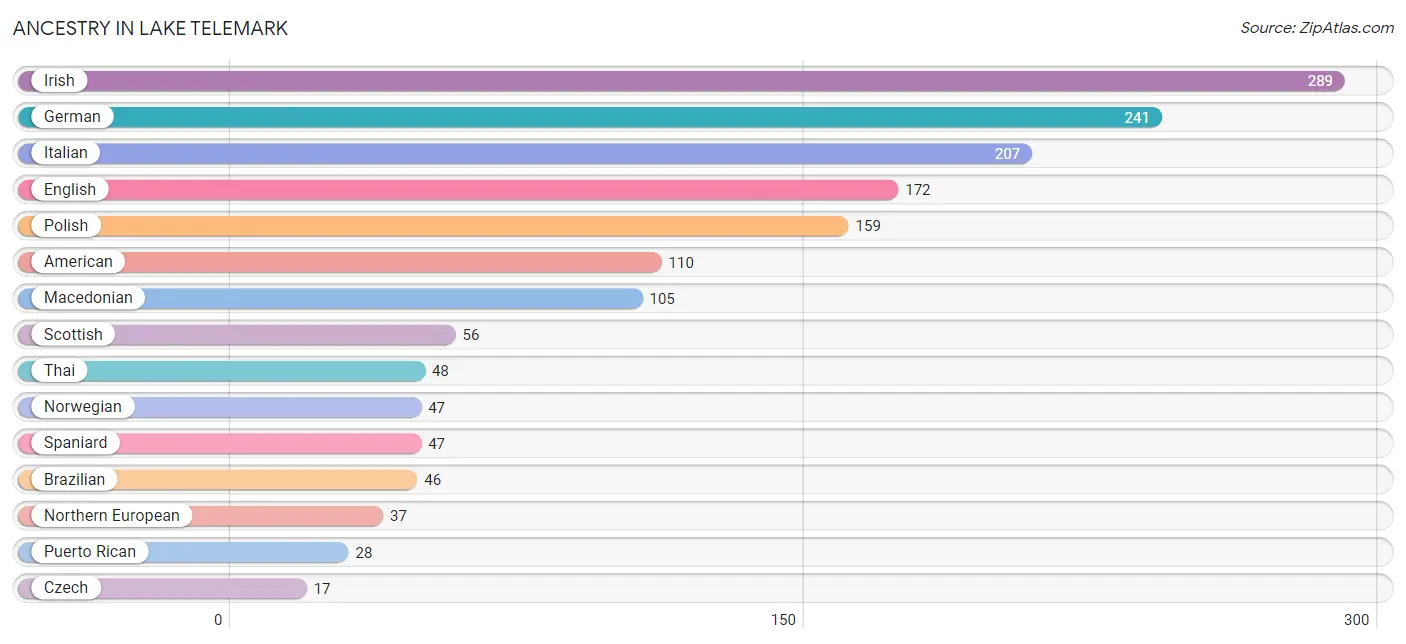
| Ancestry | # Population | % Population |
| American | 110 | 8.5% |
| Belgian | 12 | 0.9% |
| Brazilian | 46 | 3.5% |
| Canadian | 12 | 0.9% |
| Czech | 17 | 1.3% |
| Danish | 9 | 0.7% |
| English | 172 | 13.2% |
| Finnish | 12 | 0.9% |
| French Canadian | 7 | 0.5% |
| German | 241 | 18.5% |
| Hungarian | 8 | 0.6% |
| Irish | 289 | 22.2% |
| Italian | 207 | 15.9% |
| Macedonian | 105 | 8.1% |
| Mexican | 12 | 0.9% |
| Northern European | 37 | 2.8% |
| Norwegian | 47 | 3.6% |
| Polish | 159 | 12.2% |
| Puerto Rican | 28 | 2.1% |
| Russian | 13 | 1.0% |
| Scotch-Irish | 12 | 0.9% |
| Scottish | 56 | 4.3% |
| Slovak | 10 | 0.8% |
| Spaniard | 47 | 3.6% |
| Swedish | 8 | 0.6% |
| Swiss | 12 | 0.9% |
| Thai | 48 | 3.7% | View All 27 Rows |
Immigrants in Lake Telemark
The most numerous immigrant groups reported in Lake Telemark came from Europe (164 | 12.6%), Eastern Europe (144 | 11.1%), North Macedonia (105 | 8.1%), Poland (39 | 3.0%), and Asia (24 | 1.8%), together accounting for 36.6% of all Lake Telemark residents.
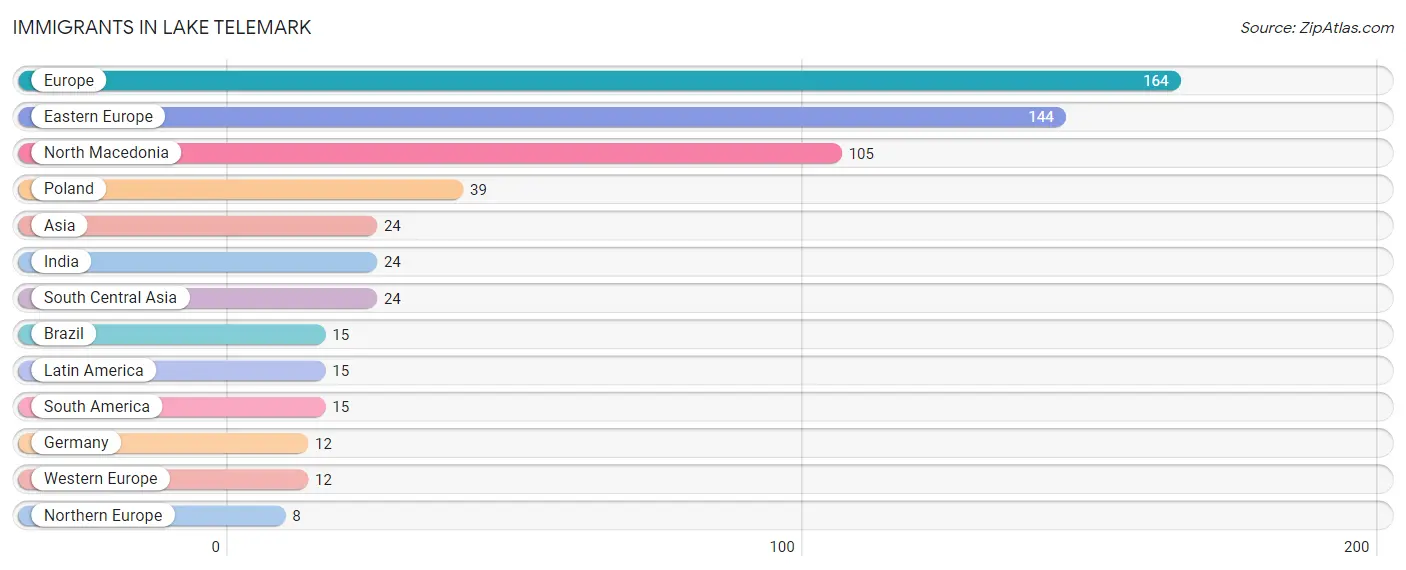
| Immigration Origin | # Population | % Population |
| Asia | 24 | 1.8% |
| Brazil | 15 | 1.1% |
| Eastern Europe | 144 | 11.1% |
| Europe | 164 | 12.6% |
| Germany | 12 | 0.9% |
| India | 24 | 1.8% |
| Latin America | 15 | 1.1% |
| North Macedonia | 105 | 8.1% |
| Northern Europe | 8 | 0.6% |
| Poland | 39 | 3.0% |
| South America | 15 | 1.1% |
| South Central Asia | 24 | 1.8% |
| Western Europe | 12 | 0.9% | View All 13 Rows |
Sex and Age in Lake Telemark
Sex and Age in Lake Telemark
The most populous age groups in Lake Telemark are 20 to 24 Years (106 | 16.6%) for men and 55 to 59 Years (84 | 12.7%) for women.
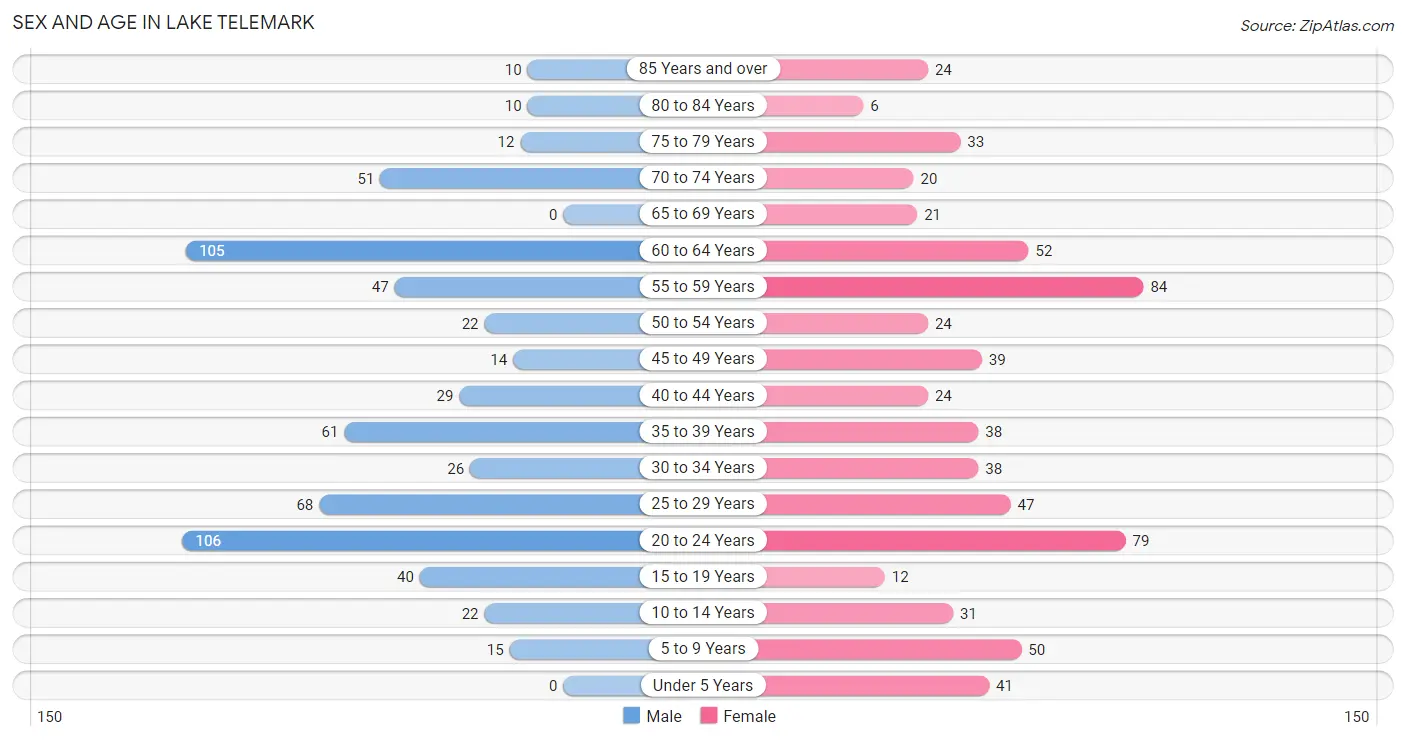
| Age Bracket | Male | Female |
| Under 5 Years | 0 (0.0%) | 41 (6.2%) |
| 5 to 9 Years | 15 (2.4%) | 50 (7.5%) |
| 10 to 14 Years | 22 (3.5%) | 31 (4.7%) |
| 15 to 19 Years | 40 (6.3%) | 12 (1.8%) |
| 20 to 24 Years | 106 (16.6%) | 79 (11.9%) |
| 25 to 29 Years | 68 (10.7%) | 47 (7.1%) |
| 30 to 34 Years | 26 (4.1%) | 38 (5.7%) |
| 35 to 39 Years | 61 (9.6%) | 38 (5.7%) |
| 40 to 44 Years | 29 (4.5%) | 24 (3.6%) |
| 45 to 49 Years | 14 (2.2%) | 39 (5.9%) |
| 50 to 54 Years | 22 (3.5%) | 24 (3.6%) |
| 55 to 59 Years | 47 (7.4%) | 84 (12.7%) |
| 60 to 64 Years | 105 (16.5%) | 52 (7.8%) |
| 65 to 69 Years | 0 (0.0%) | 21 (3.2%) |
| 70 to 74 Years | 51 (8.0%) | 20 (3.0%) |
| 75 to 79 Years | 12 (1.9%) | 33 (5.0%) |
| 80 to 84 Years | 10 (1.6%) | 6 (0.9%) |
| 85 Years and over | 10 (1.6%) | 24 (3.6%) |
| Total | 638 (100.0%) | 663 (100.0%) |
Families and Households in Lake Telemark
Median Family Size in Lake Telemark
The median family size in Lake Telemark is 3.49 persons per family, with married-couple families (271 | 83.6%) accounting for the largest median family size of 3.67 persons per family. On the other hand, single male/father families (37 | 11.4%) represent the smallest median family size with 2.32 persons per family.
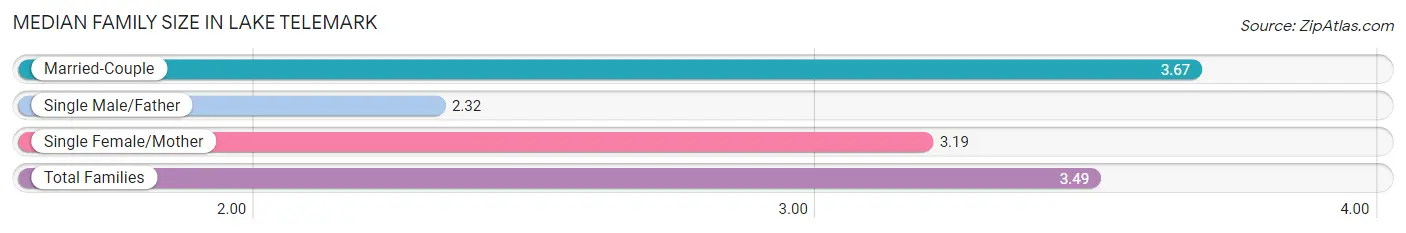
| Family Type | # Families | Family Size |
| Married-Couple | 271 (83.6%) | 3.67 |
| Single Male/Father | 37 (11.4%) | 2.32 |
| Single Female/Mother | 16 (4.9%) | 3.19 |
| Total Families | 324 (100.0%) | 3.49 |
Median Household Size in Lake Telemark
The median household size in Lake Telemark is 2.84 persons per household, with married-couple households (271 | 59.2%) accounting for the largest median household size of 3.67 persons per household. non-family households (134 | 29.3%) represent the smallest median household size with 1.26 persons per household.
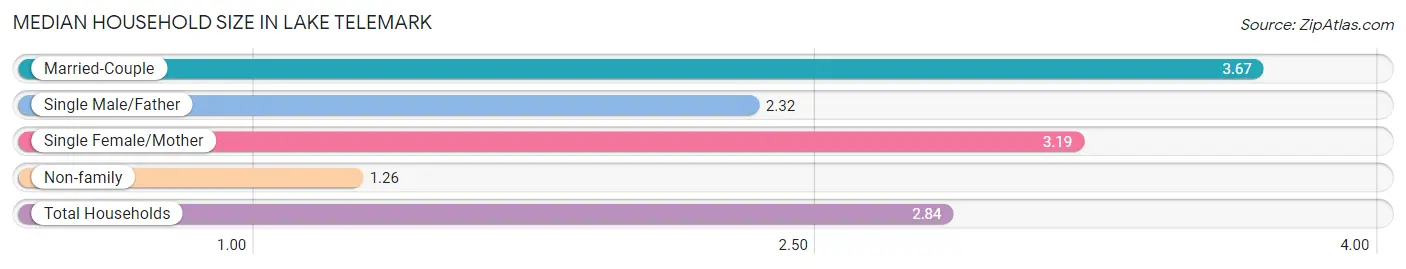
| Household Type | # Households | Household Size |
| Married-Couple | 271 (59.2%) | 3.67 |
| Single Male/Father | 37 (8.1%) | 2.32 |
| Single Female/Mother | 16 (3.5%) | 3.19 |
| Non-family | 134 (29.3%) | 1.26 |
| Total Households | 458 (100.0%) | 2.84 |
Household Size by Marriage Status in Lake Telemark
Out of a total of 458 households in Lake Telemark, 324 (70.7%) are family households, while 134 (29.3%) are nonfamily households. The most numerous type of family households are 2-person households, comprising 103, and the most common type of nonfamily households are 1-person households, comprising 99.
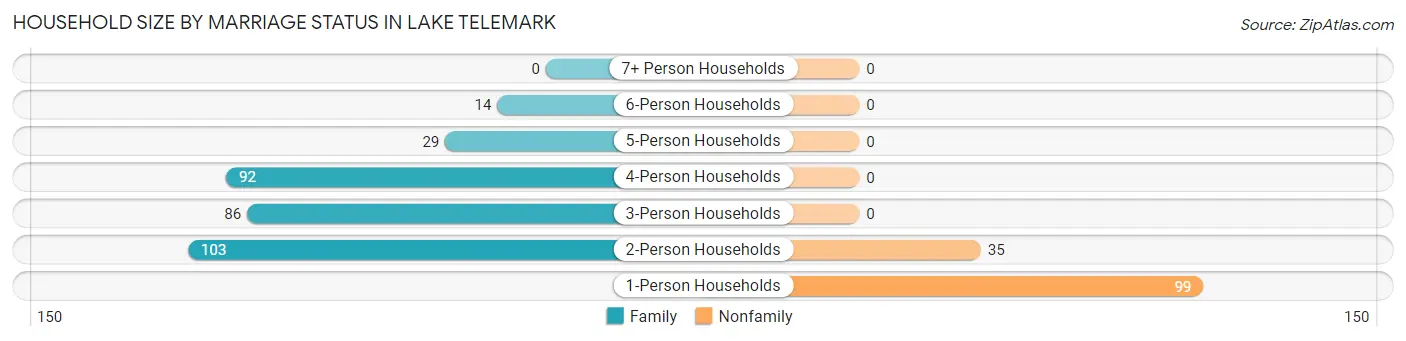
| Household Size | Family Households | Nonfamily Households |
| 1-Person Households | - | 99 (21.6%) |
| 2-Person Households | 103 (22.5%) | 35 (7.6%) |
| 3-Person Households | 86 (18.8%) | 0 (0.0%) |
| 4-Person Households | 92 (20.1%) | 0 (0.0%) |
| 5-Person Households | 29 (6.3%) | 0 (0.0%) |
| 6-Person Households | 14 (3.1%) | 0 (0.0%) |
| 7+ Person Households | 0 (0.0%) | 0 (0.0%) |
| Total | 324 (70.7%) | 134 (29.3%) |
Female Fertility in Lake Telemark
Fertility by Age in Lake Telemark
| Age Bracket | Women with Births | Births / 1,000 Women |
| 15 to 19 years | 0 (0.0%) | 0.0 |
| 20 to 34 years | 0 (0.0%) | 0.0 |
| 35 to 50 years | 0 (0.0%) | 0.0 |
| Total | 0 (0.0%) | 0.0 |
Fertility by Age by Marriage Status in Lake Telemark
| Age Bracket | Married | Unmarried |
| 15 to 19 years | 0 (0.0%) | 0 (0.0%) |
| 20 to 34 years | 0 (0.0%) | 0 (0.0%) |
| 35 to 50 years | 0 (0.0%) | 0 (0.0%) |
| Total | 0 (0.0%) | 0 (0.0%) |
Fertility by Education in Lake Telemark
| Educational Attainment | Women with Births | Births / 1,000 Women |
| Less than High School | 0 (0.0%) | 0.0 |
| High School Diploma | 0 (0.0%) | 0.0 |
| College or Associate's Degree | 0 (0.0%) | 0.0 |
| Bachelor's Degree | 0 (0.0%) | 0.0 |
| Graduate Degree | 0 (0.0%) | 0.0 |
| Total | 0 (0.0%) | 0.0 |
Fertility by Education by Marriage Status in Lake Telemark
| Educational Attainment | Married | Unmarried |
| Less than High School | 0 (0.0%) | 0 (0.0%) |
| High School Diploma | 0 (0.0%) | 0 (0.0%) |
| College or Associate's Degree | 0 (0.0%) | 0 (0.0%) |
| Bachelor's Degree | 0 (0.0%) | 0 (0.0%) |
| Graduate Degree | 0 (0.0%) | 0 (0.0%) |
| Total | 0 (0.0%) | 0 (0.0%) |
Employment Characteristics in Lake Telemark
Employment by Class of Employer in Lake Telemark
Among the 768 employed individuals in Lake Telemark, private company employees (613 | 79.8%), local government employees (69 | 9.0%), and not-for-profit organizations (64 | 8.3%) make up the most common classes of employment.
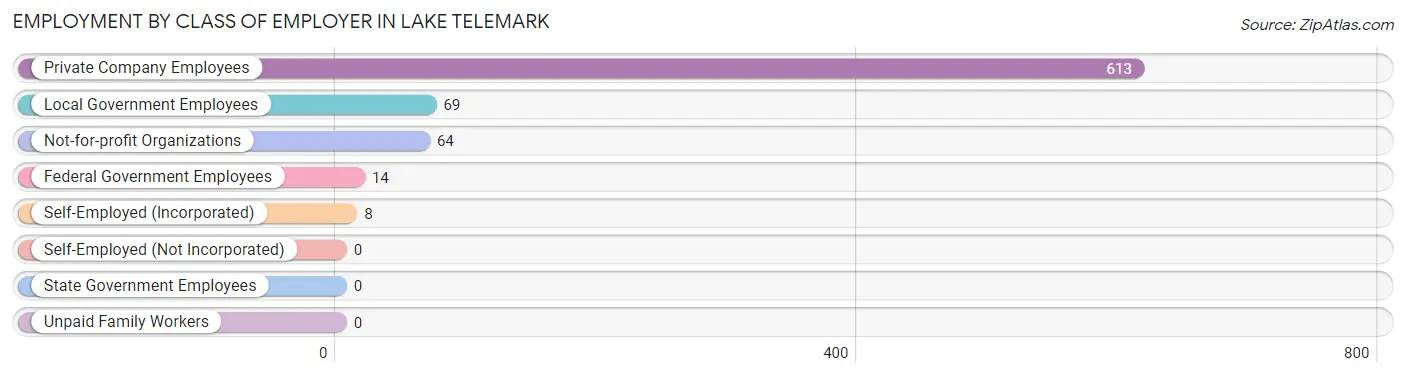
| Employer Class | # Employees | % Employees |
| Private Company Employees | 613 | 79.8% |
| Self-Employed (Incorporated) | 8 | 1.0% |
| Self-Employed (Not Incorporated) | 0 | 0.0% |
| Not-for-profit Organizations | 64 | 8.3% |
| Local Government Employees | 69 | 9.0% |
| State Government Employees | 0 | 0.0% |
| Federal Government Employees | 14 | 1.8% |
| Unpaid Family Workers | 0 | 0.0% |
| Total | 768 | 100.0% |
Employment Status by Age in Lake Telemark
According to the labor force statistics for Lake Telemark, out of the total population over 16 years of age (1,125), 72.2% or 812 individuals are in the labor force, with 2.5% or 20 of them unemployed. The age group with the highest labor force participation rate is 25 to 29 years, with 100.0% or 115 individuals in the labor force. Within the labor force, the 60 to 64 years age range has the highest percentage of unemployed individuals, with 8.5% or 12 of them being unemployed.
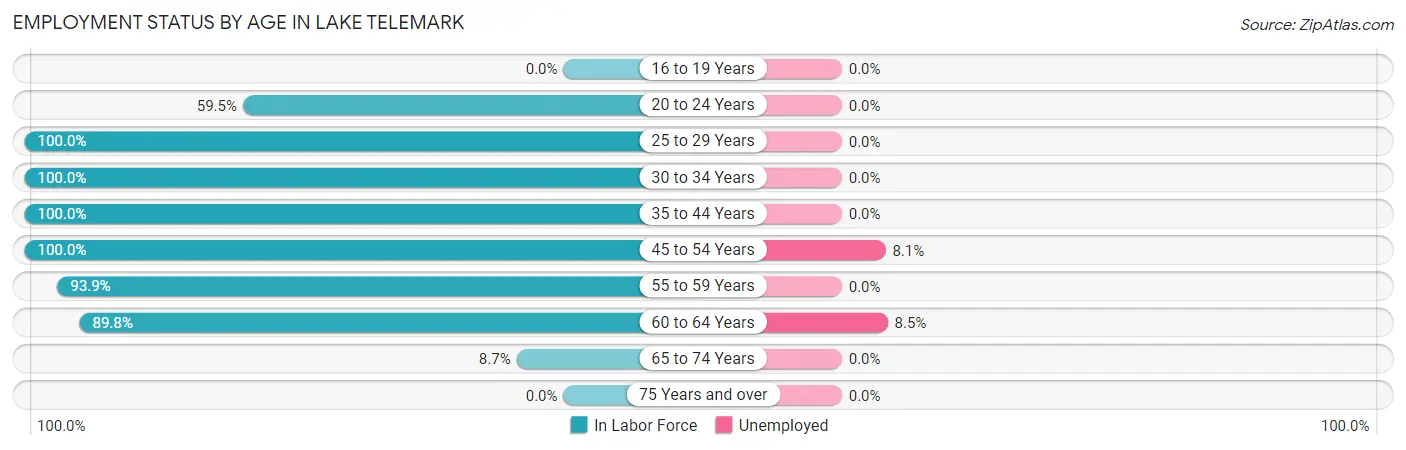
| Age Bracket | In Labor Force | Unemployed |
| 16 to 19 Years | 0 (0.0%) | 0 (0.0%) |
| 20 to 24 Years | 110 (59.5%) | 0 (0.0%) |
| 25 to 29 Years | 115 (100.0%) | 0 (0.0%) |
| 30 to 34 Years | 64 (100.0%) | 0 (0.0%) |
| 35 to 44 Years | 152 (100.0%) | 0 (0.0%) |
| 45 to 54 Years | 99 (100.0%) | 8 (8.1%) |
| 55 to 59 Years | 123 (93.9%) | 0 (0.0%) |
| 60 to 64 Years | 141 (89.8%) | 12 (8.5%) |
| 65 to 74 Years | 8 (8.7%) | 0 (0.0%) |
| 75 Years and over | 0 (0.0%) | 0 (0.0%) |
| Total | 812 (72.2%) | 20 (2.5%) |
Employment Status by Educational Attainment in Lake Telemark
According to labor force statistics for Lake Telemark, 96.7% of individuals (694) out of the total population between 25 and 64 years of age (718) are in the labor force, with 2.9% or 20 of them being unemployed. The group with the highest labor force participation rate are those with the educational attainment of high school diploma, with 100.0% or 121 individuals in the labor force. Within the labor force, individuals with high school diploma education have the highest percentage of unemployment, with 9.9% or 12 of them being unemployed.
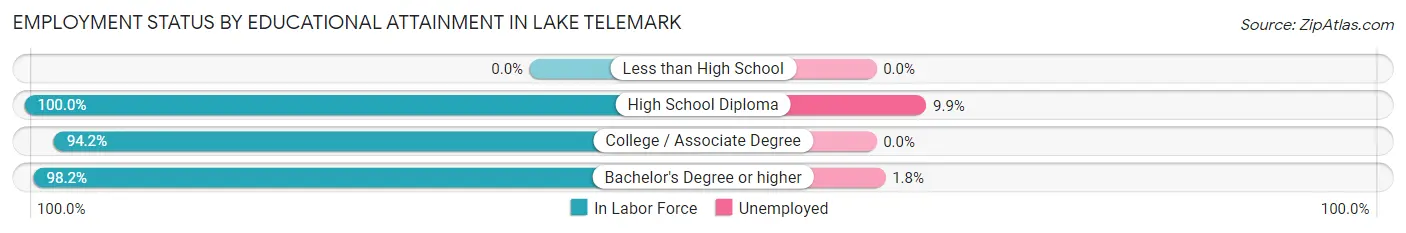
| Educational Attainment | In Labor Force | Unemployed |
| Less than High School | 0 (0.0%) | 0 (0.0%) |
| High School Diploma | 121 (100.0%) | 12 (9.9%) |
| College / Associate Degree | 131 (94.2%) | 0 (0.0%) |
| Bachelor's Degree or higher | 442 (98.2%) | 8 (1.8%) |
| Total | 694 (96.7%) | 21 (2.9%) |
Employment Occupations by Sex in Lake Telemark
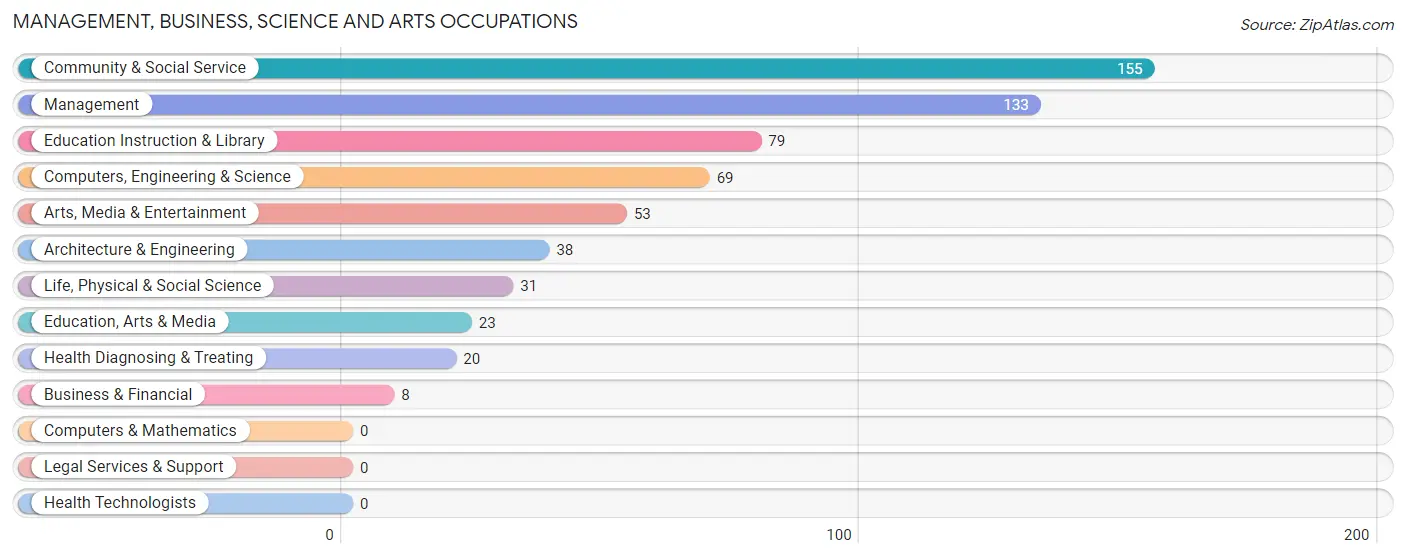
Management, Business, Science and Arts Occupations
The most common Management, Business, Science and Arts occupations in Lake Telemark are Community & Social Service (155 | 19.6%), Management (133 | 16.8%), Education Instruction & Library (79 | 10.0%), Computers, Engineering & Science (69 | 8.7%), and Arts, Media & Entertainment (53 | 6.7%).
Management, Business, Science and Arts Occupations by Sex
Within the Management, Business, Science and Arts occupations in Lake Telemark, the most male-oriented occupations are Business & Financial (100.0%), Management (66.9%), and Education, Arts & Media (65.2%), while the most female-oriented occupations are Computers, Engineering & Science (100.0%), Architecture & Engineering (100.0%), and Life, Physical & Social Science (100.0%).
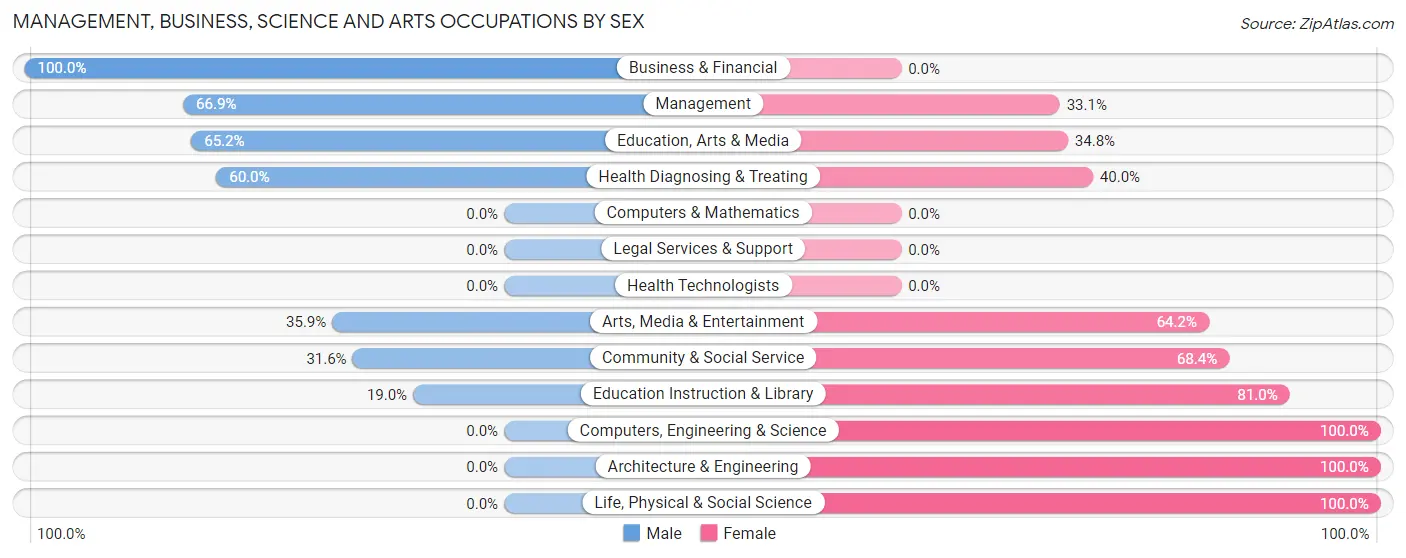
| Occupation | Male | Female |
| Management | 89 (66.9%) | 44 (33.1%) |
| Business & Financial | 8 (100.0%) | 0 (0.0%) |
| Computers, Engineering & Science | 0 (0.0%) | 69 (100.0%) |
| Computers & Mathematics | 0 (0.0%) | 0 (0.0%) |
| Architecture & Engineering | 0 (0.0%) | 38 (100.0%) |
| Life, Physical & Social Science | 0 (0.0%) | 31 (100.0%) |
| Community & Social Service | 49 (31.6%) | 106 (68.4%) |
| Education, Arts & Media | 15 (65.2%) | 8 (34.8%) |
| Legal Services & Support | 0 (0.0%) | 0 (0.0%) |
| Education Instruction & Library | 15 (19.0%) | 64 (81.0%) |
| Arts, Media & Entertainment | 19 (35.8%) | 34 (64.1%) |
| Health Diagnosing & Treating | 12 (60.0%) | 8 (40.0%) |
| Health Technologists | 0 (0.0%) | 0 (0.0%) |
| Total (Category) | 158 (41.0%) | 227 (59.0%) |
| Total (Overall) | 404 (51.0%) | 388 (49.0%) |
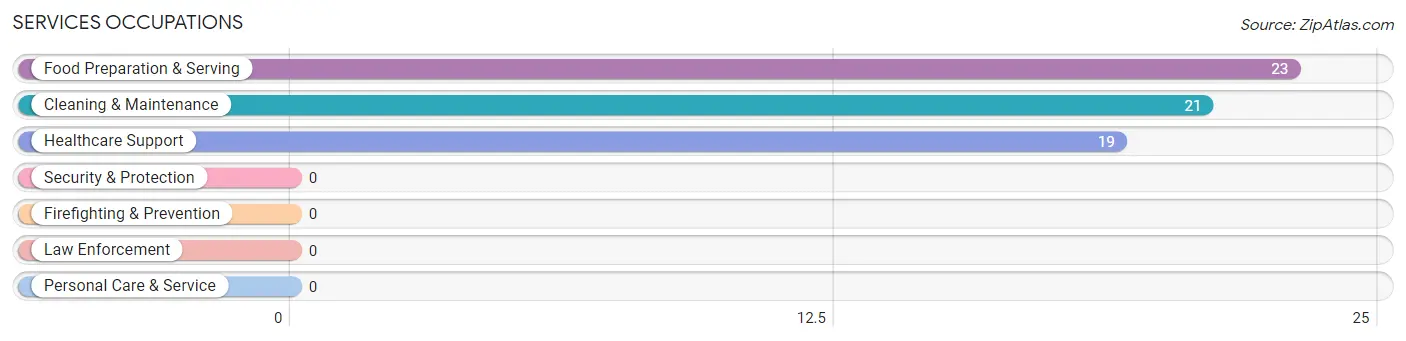
Services Occupations
The most common Services occupations in Lake Telemark are Food Preparation & Serving (23 | 2.9%), Cleaning & Maintenance (21 | 2.6%), and Healthcare Support (19 | 2.4%).
Services Occupations by Sex
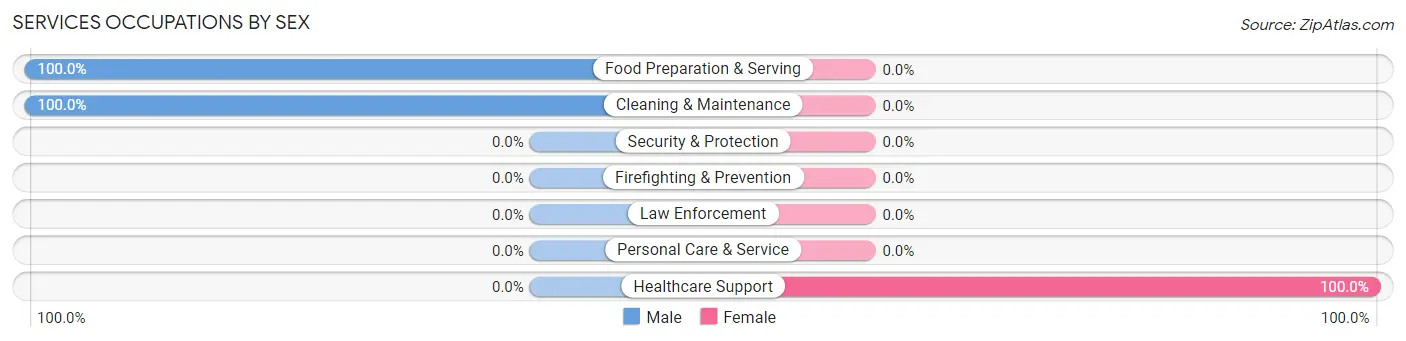
| Occupation | Male | Female |
| Healthcare Support | 0 (0.0%) | 19 (100.0%) |
| Security & Protection | 0 (0.0%) | 0 (0.0%) |
| Firefighting & Prevention | 0 (0.0%) | 0 (0.0%) |
| Law Enforcement | 0 (0.0%) | 0 (0.0%) |
| Food Preparation & Serving | 23 (100.0%) | 0 (0.0%) |
| Cleaning & Maintenance | 21 (100.0%) | 0 (0.0%) |
| Personal Care & Service | 0 (0.0%) | 0 (0.0%) |
| Total (Category) | 44 (69.8%) | 19 (30.2%) |
| Total (Overall) | 404 (51.0%) | 388 (49.0%) |
Sales and Office Occupations
The most common Sales and Office occupations in Lake Telemark are Office & Administration (106 | 13.4%), and Sales & Related (93 | 11.7%).
Sales and Office Occupations by Sex
| Occupation | Male | Female |
| Sales & Related | 52 (55.9%) | 41 (44.1%) |
| Office & Administration | 37 (34.9%) | 69 (65.1%) |
| Total (Category) | 89 (44.7%) | 110 (55.3%) |
| Total (Overall) | 404 (51.0%) | 388 (49.0%) |
Natural Resources, Construction and Maintenance Occupations
The most common Natural Resources, Construction and Maintenance occupations in Lake Telemark are Installation, Maintenance & Repair (69 | 8.7%), and Construction & Extraction (37 | 4.7%).
Natural Resources, Construction and Maintenance Occupations by Sex
| Occupation | Male | Female |
| Farming, Fishing & Forestry | 0 (0.0%) | 0 (0.0%) |
| Construction & Extraction | 37 (100.0%) | 0 (0.0%) |
| Installation, Maintenance & Repair | 69 (100.0%) | 0 (0.0%) |
| Total (Category) | 106 (100.0%) | 0 (0.0%) |
| Total (Overall) | 404 (51.0%) | 388 (49.0%) |
Production, Transportation and Moving Occupations
The most common Production, Transportation and Moving occupations in Lake Telemark are , and Production (39 | 4.9%).
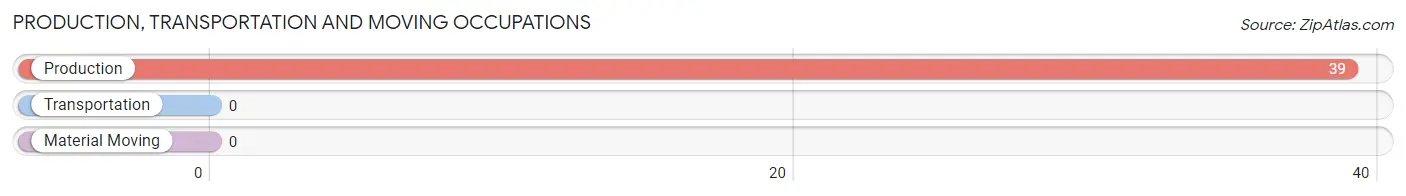
Production, Transportation and Moving Occupations by Sex
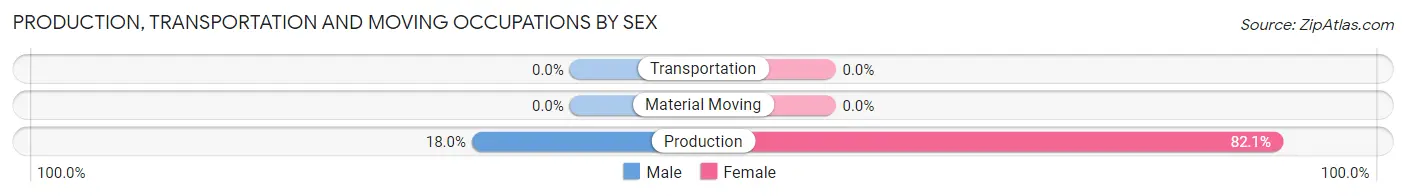
| Occupation | Male | Female |
| Production | 7 (17.9%) | 32 (82.1%) |
| Transportation | 0 (0.0%) | 0 (0.0%) |
| Material Moving | 0 (0.0%) | 0 (0.0%) |
| Total (Category) | 7 (17.9%) | 32 (82.1%) |
| Total (Overall) | 404 (51.0%) | 388 (49.0%) |
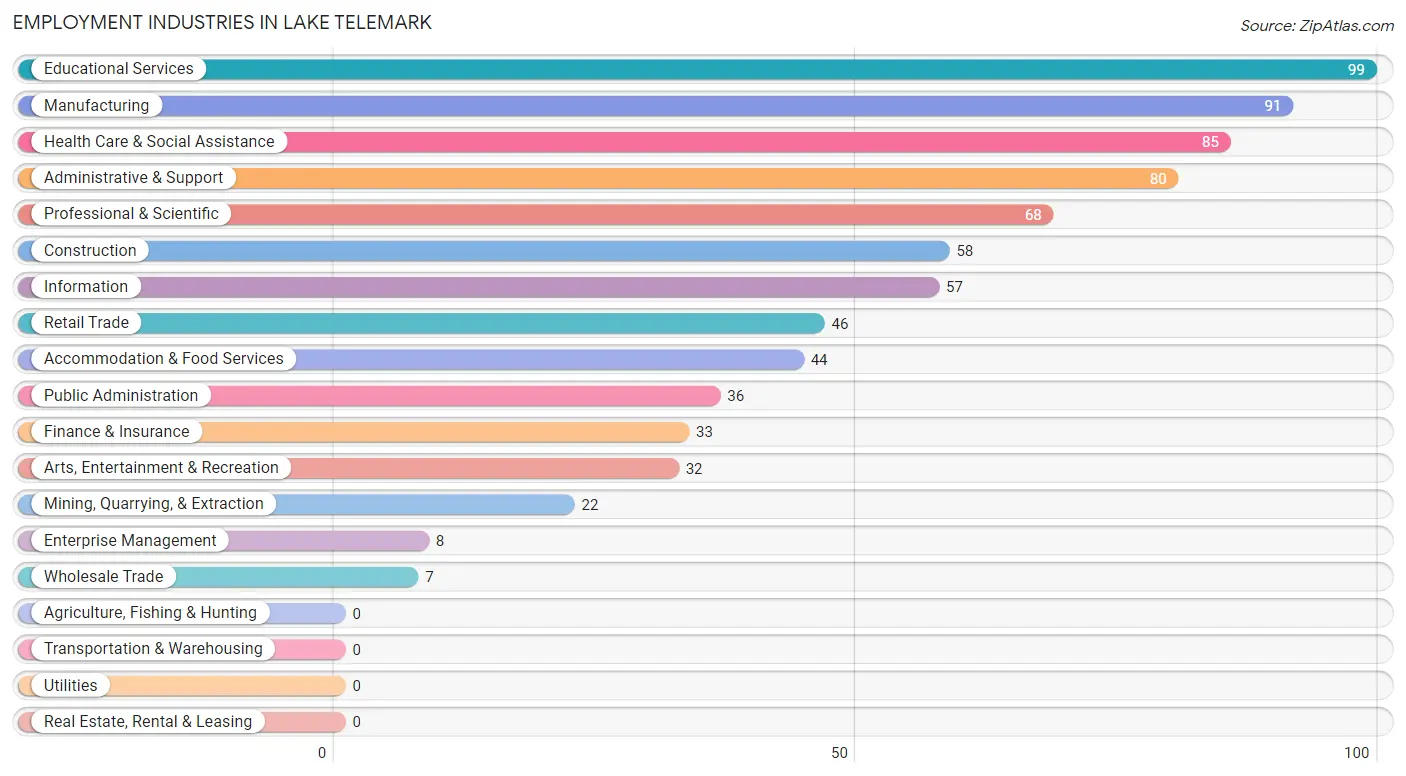
Employment Industries by Sex in Lake Telemark
Employment Industries in Lake Telemark
The major employment industries in Lake Telemark include Educational Services (99 | 12.5%), Manufacturing (91 | 11.5%), Health Care & Social Assistance (85 | 10.7%), Administrative & Support (80 | 10.1%), and Professional & Scientific (68 | 8.6%).
Employment Industries by Sex in Lake Telemark
The Lake Telemark industries that see more men than women are Construction (100.0%), Information (100.0%), and Finance & Insurance (100.0%), whereas the industries that tend to have a higher number of women are Mining, Quarrying, & Extraction (100.0%), Wholesale Trade (100.0%), and Retail Trade (100.0%).
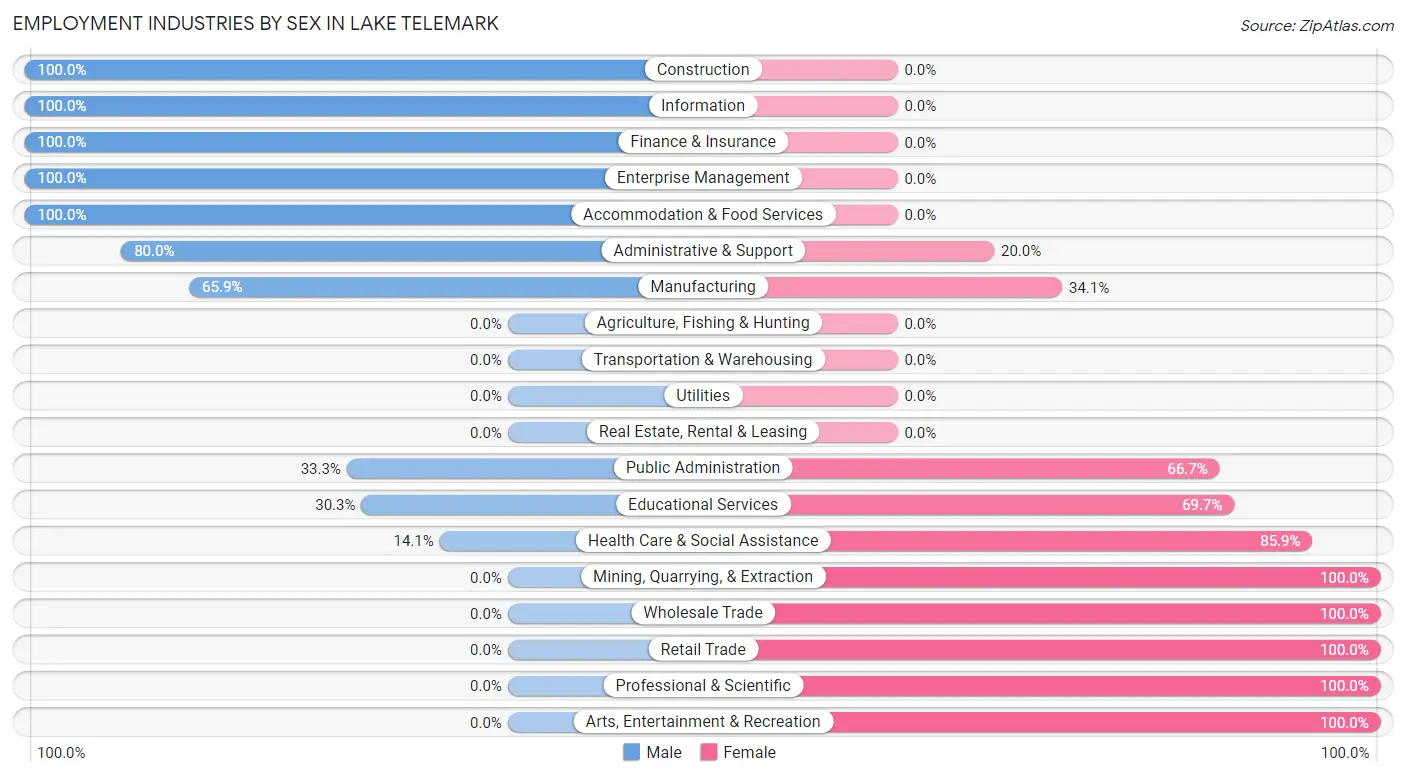
| Industry | Male | Female |
| Agriculture, Fishing & Hunting | 0 (0.0%) | 0 (0.0%) |
| Mining, Quarrying, & Extraction | 0 (0.0%) | 22 (100.0%) |
| Construction | 58 (100.0%) | 0 (0.0%) |
| Manufacturing | 60 (65.9%) | 31 (34.1%) |
| Wholesale Trade | 0 (0.0%) | 7 (100.0%) |
| Retail Trade | 0 (0.0%) | 46 (100.0%) |
| Transportation & Warehousing | 0 (0.0%) | 0 (0.0%) |
| Utilities | 0 (0.0%) | 0 (0.0%) |
| Information | 57 (100.0%) | 0 (0.0%) |
| Finance & Insurance | 33 (100.0%) | 0 (0.0%) |
| Real Estate, Rental & Leasing | 0 (0.0%) | 0 (0.0%) |
| Professional & Scientific | 0 (0.0%) | 68 (100.0%) |
| Enterprise Management | 8 (100.0%) | 0 (0.0%) |
| Administrative & Support | 64 (80.0%) | 16 (20.0%) |
| Educational Services | 30 (30.3%) | 69 (69.7%) |
| Health Care & Social Assistance | 12 (14.1%) | 73 (85.9%) |
| Arts, Entertainment & Recreation | 0 (0.0%) | 32 (100.0%) |
| Accommodation & Food Services | 44 (100.0%) | 0 (0.0%) |
| Public Administration | 12 (33.3%) | 24 (66.7%) |
| Total | 404 (51.0%) | 388 (49.0%) |
Education in Lake Telemark
School Enrollment in Lake Telemark
The most common levels of schooling among the 295 students in Lake Telemark are college / undergraduate (103 | 34.9%), middle school (55 | 18.6%), and elementary school (42 | 14.2%).
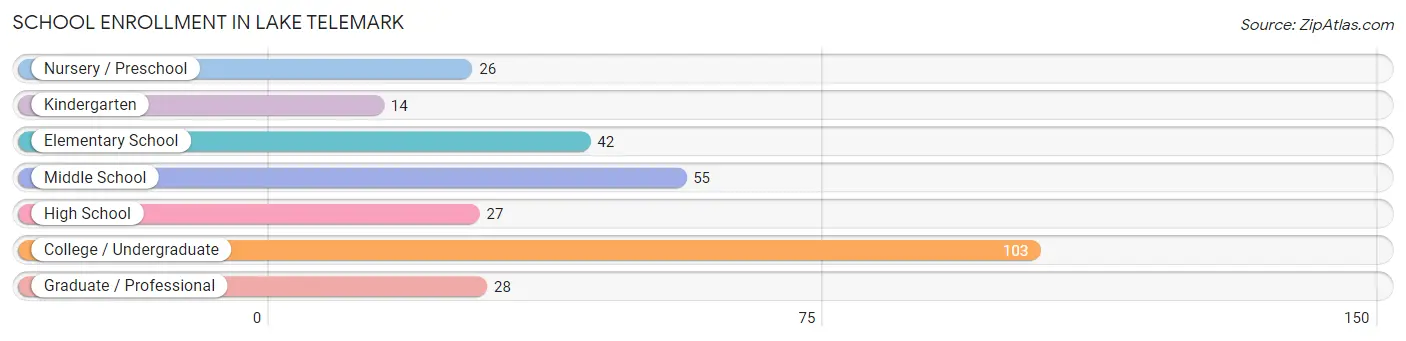
| School Level | # Students | % Students |
| Nursery / Preschool | 26 | 8.8% |
| Kindergarten | 14 | 4.8% |
| Elementary School | 42 | 14.2% |
| Middle School | 55 | 18.6% |
| High School | 27 | 9.1% |
| College / Undergraduate | 103 | 34.9% |
| Graduate / Professional | 28 | 9.5% |
| Total | 295 | 100.0% |
School Enrollment by Age by Funding Source in Lake Telemark
Out of a total of 295 students who are enrolled in schools in Lake Telemark, 62 (21.0%) attend a private institution, while the remaining 233 (79.0%) are enrolled in public schools. The age group of 3 to 4 year olds has the highest likelihood of being enrolled in private schools, with 26 (100.0% in the age bracket) enrolled. Conversely, the age group of 5 to 9 year old has the lowest likelihood of being enrolled in a private school, with 56 (100.0% in the age bracket) attending a public institution.
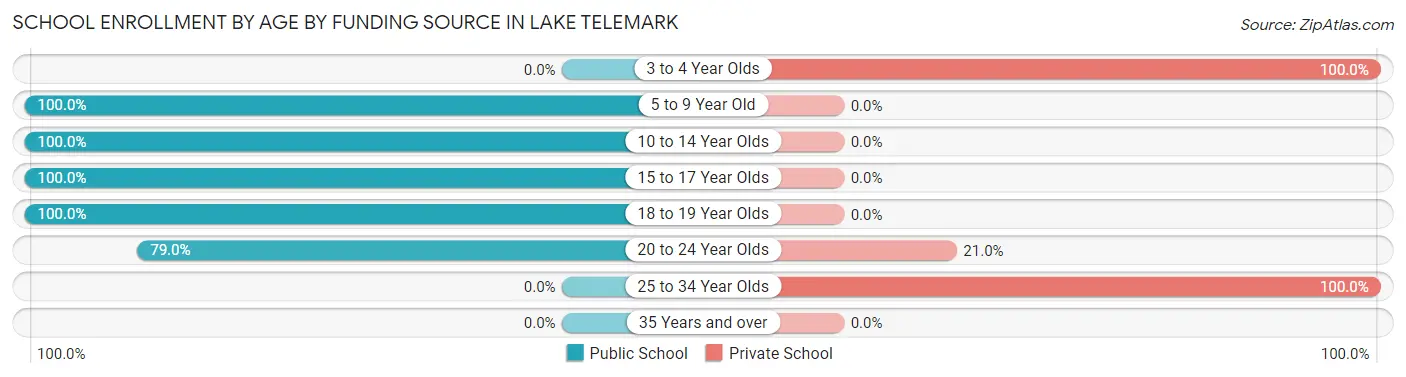
| Age Bracket | Public School | Private School |
| 3 to 4 Year Olds | 0 (0.0%) | 26 (100.0%) |
| 5 to 9 Year Old | 56 (100.0%) | 0 (0.0%) |
| 10 to 14 Year Olds | 53 (100.0%) | 0 (0.0%) |
| 15 to 17 Year Olds | 29 (100.0%) | 0 (0.0%) |
| 18 to 19 Year Olds | 16 (100.0%) | 0 (0.0%) |
| 20 to 24 Year Olds | 79 (79.0%) | 21 (21.0%) |
| 25 to 34 Year Olds | 0 (0.0%) | 15 (100.0%) |
| 35 Years and over | 0 (0.0%) | 0 (0.0%) |
| Total | 233 (79.0%) | 62 (21.0%) |
Educational Attainment by Field of Study in Lake Telemark
Liberal arts & history (98 | 15.1%), business (84 | 13.0%), psychology (80 | 12.4%), social sciences (62 | 9.6%), and computers & mathematics (53 | 8.2%) are the most common fields of study among 647 individuals in Lake Telemark who have obtained a bachelor's degree or higher.
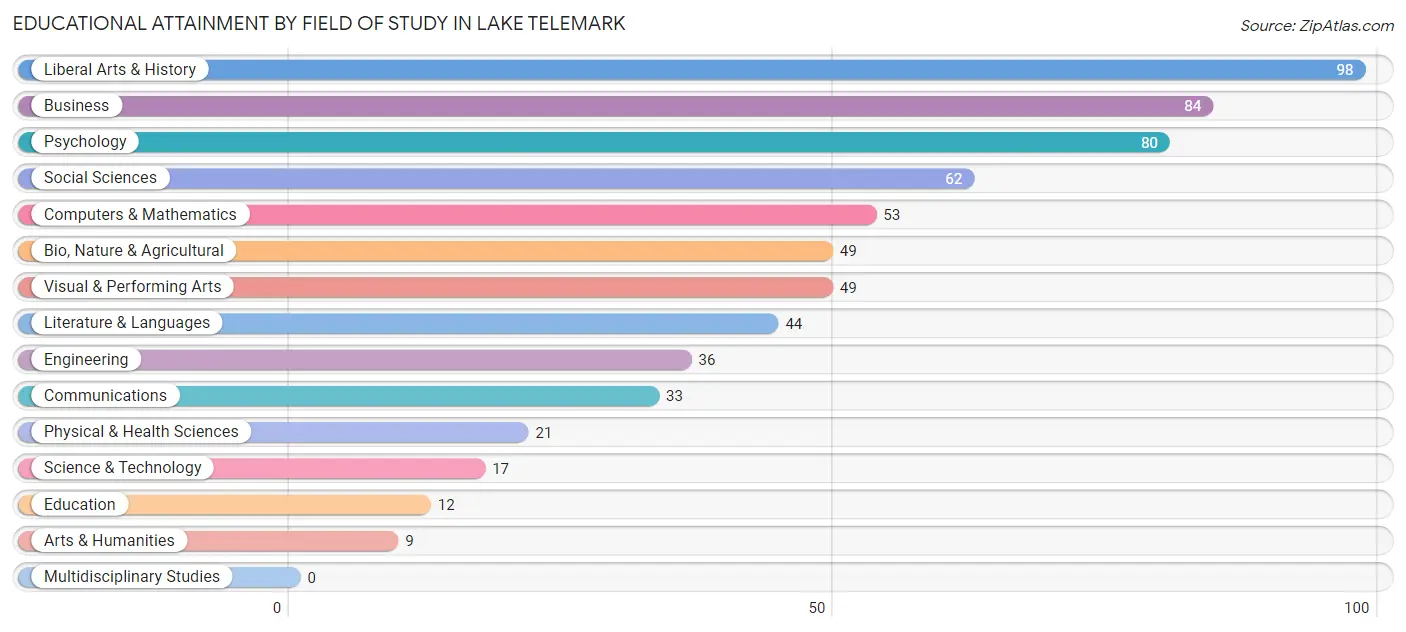
| Field of Study | # Graduates | % Graduates |
| Computers & Mathematics | 53 | 8.2% |
| Bio, Nature & Agricultural | 49 | 7.6% |
| Physical & Health Sciences | 21 | 3.3% |
| Psychology | 80 | 12.4% |
| Social Sciences | 62 | 9.6% |
| Engineering | 36 | 5.6% |
| Multidisciplinary Studies | 0 | 0.0% |
| Science & Technology | 17 | 2.6% |
| Business | 84 | 13.0% |
| Education | 12 | 1.8% |
| Literature & Languages | 44 | 6.8% |
| Liberal Arts & History | 98 | 15.1% |
| Visual & Performing Arts | 49 | 7.6% |
| Communications | 33 | 5.1% |
| Arts & Humanities | 9 | 1.4% |
| Total | 647 | 100.0% |
Transportation & Commute in Lake Telemark
Vehicle Availability by Sex in Lake Telemark
The most prevalent vehicle ownership categories in Lake Telemark are males with 2 vehicles (159, accounting for 39.4%) and females with 2 vehicles (183, making up 43.7%).
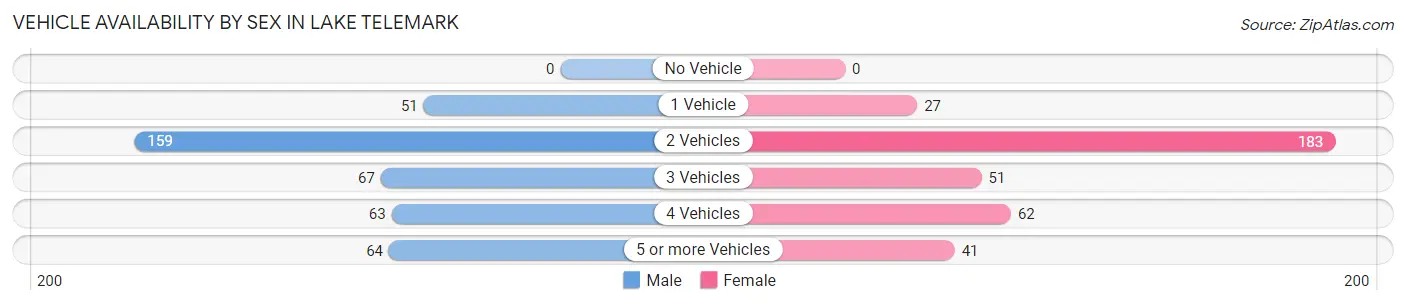
| Vehicles Available | Male | Female |
| No Vehicle | 0 (0.0%) | 0 (0.0%) |
| 1 Vehicle | 51 (12.6%) | 27 (7.4%) |
| 2 Vehicles | 159 (39.4%) | 183 (50.3%) |
| 3 Vehicles | 67 (16.6%) | 51 (14.0%) |
| 4 Vehicles | 63 (15.6%) | 62 (17.0%) |
| 5 or more Vehicles | 64 (15.8%) | 41 (11.3%) |
| Total | 404 (100.0%) | 364 (100.0%) |
Commute Time in Lake Telemark
The most frequently occuring commute durations in Lake Telemark are 30 to 34 minutes (120 commuters, 19.1%), 15 to 19 minutes (111 commuters, 17.6%), and 25 to 29 minutes (86 commuters, 13.7%).
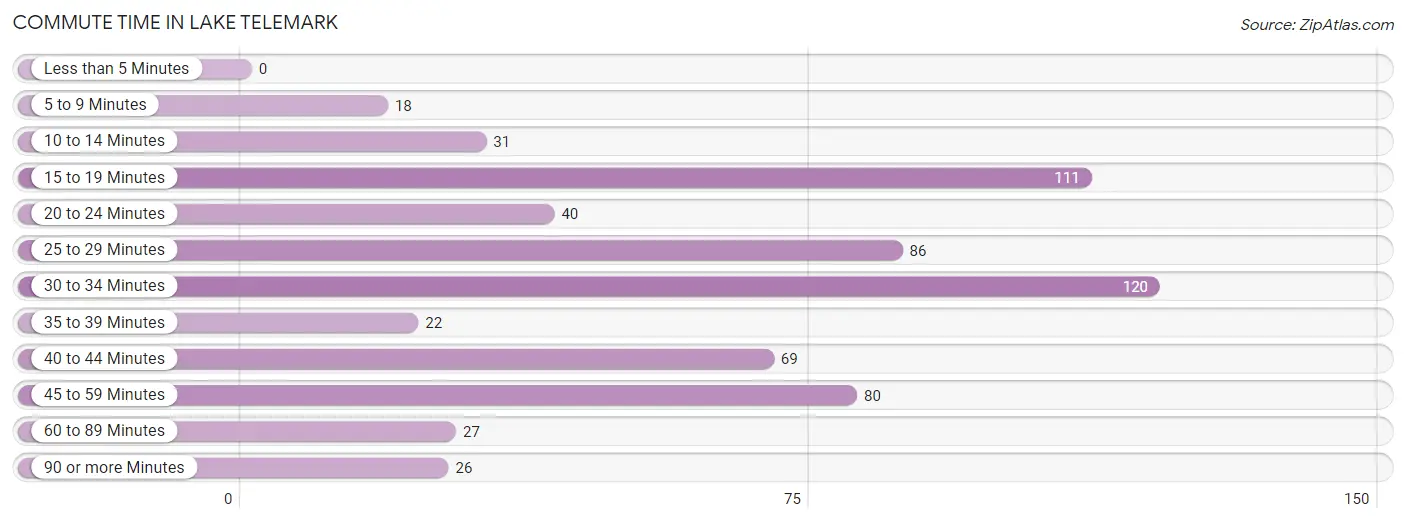
| Commute Time | # Commuters | % Commuters |
| Less than 5 Minutes | 0 | 0.0% |
| 5 to 9 Minutes | 18 | 2.9% |
| 10 to 14 Minutes | 31 | 4.9% |
| 15 to 19 Minutes | 111 | 17.6% |
| 20 to 24 Minutes | 40 | 6.4% |
| 25 to 29 Minutes | 86 | 13.7% |
| 30 to 34 Minutes | 120 | 19.1% |
| 35 to 39 Minutes | 22 | 3.5% |
| 40 to 44 Minutes | 69 | 11.0% |
| 45 to 59 Minutes | 80 | 12.7% |
| 60 to 89 Minutes | 27 | 4.3% |
| 90 or more Minutes | 26 | 4.1% |
Commute Time by Sex in Lake Telemark
The most common commute times in Lake Telemark are 30 to 34 minutes (78 commuters, 21.9%) for males and 25 to 29 minutes (54 commuters, 19.7%) for females.
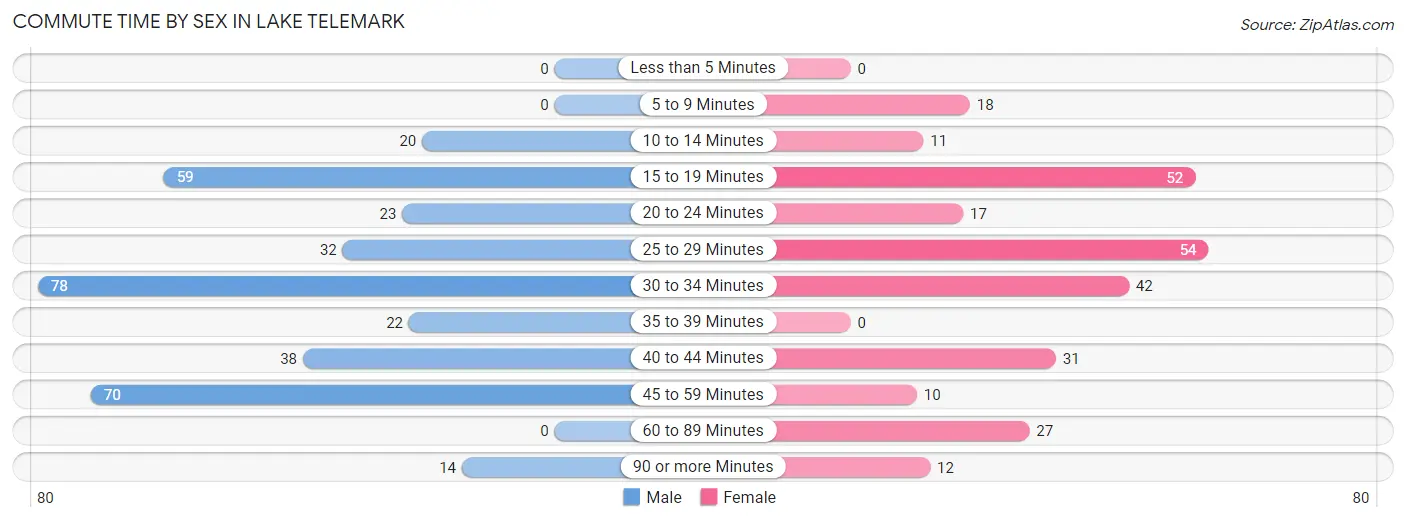
| Commute Time | Male | Female |
| Less than 5 Minutes | 0 (0.0%) | 0 (0.0%) |
| 5 to 9 Minutes | 0 (0.0%) | 18 (6.6%) |
| 10 to 14 Minutes | 20 (5.6%) | 11 (4.0%) |
| 15 to 19 Minutes | 59 (16.6%) | 52 (19.0%) |
| 20 to 24 Minutes | 23 (6.5%) | 17 (6.2%) |
| 25 to 29 Minutes | 32 (9.0%) | 54 (19.7%) |
| 30 to 34 Minutes | 78 (21.9%) | 42 (15.3%) |
| 35 to 39 Minutes | 22 (6.2%) | 0 (0.0%) |
| 40 to 44 Minutes | 38 (10.7%) | 31 (11.3%) |
| 45 to 59 Minutes | 70 (19.7%) | 10 (3.6%) |
| 60 to 89 Minutes | 0 (0.0%) | 27 (9.9%) |
| 90 or more Minutes | 14 (3.9%) | 12 (4.4%) |
Time of Departure to Work by Sex in Lake Telemark
The most frequent times of departure to work in Lake Telemark are 8:00 AM to 8:29 AM (68, 19.1%) for males and 7:30 AM to 7:59 AM (57, 20.8%) for females.
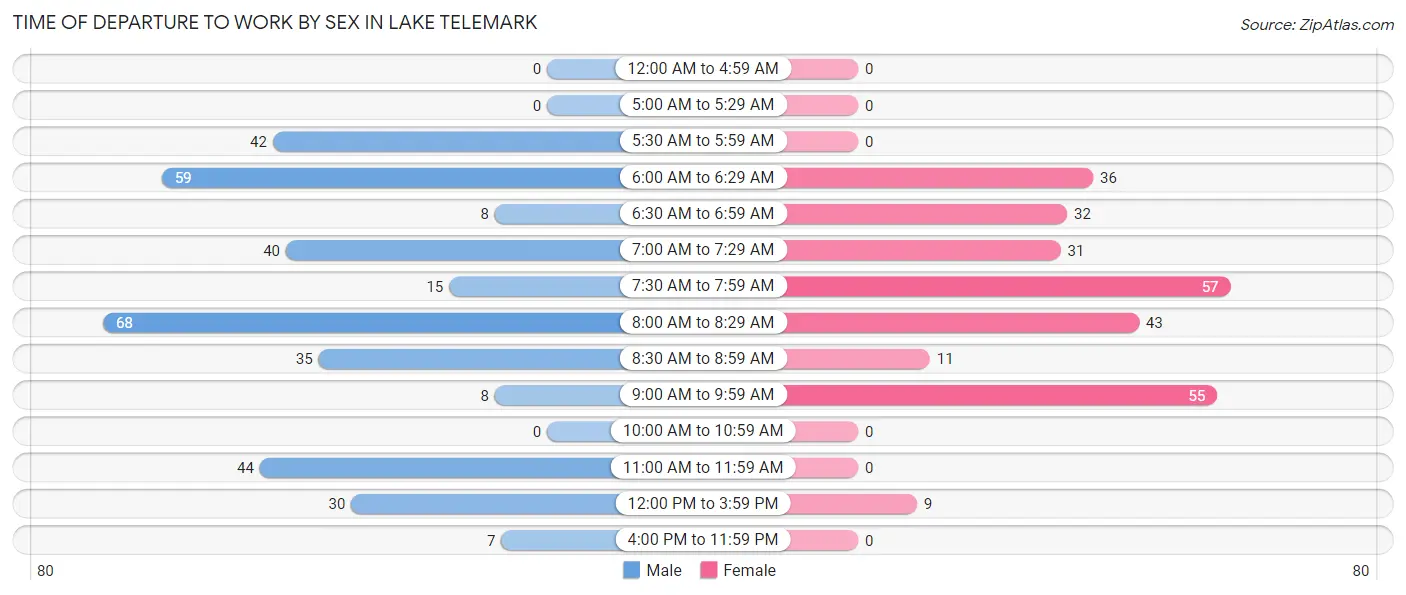
| Time of Departure | Male | Female |
| 12:00 AM to 4:59 AM | 0 (0.0%) | 0 (0.0%) |
| 5:00 AM to 5:29 AM | 0 (0.0%) | 0 (0.0%) |
| 5:30 AM to 5:59 AM | 42 (11.8%) | 0 (0.0%) |
| 6:00 AM to 6:29 AM | 59 (16.6%) | 36 (13.1%) |
| 6:30 AM to 6:59 AM | 8 (2.2%) | 32 (11.7%) |
| 7:00 AM to 7:29 AM | 40 (11.2%) | 31 (11.3%) |
| 7:30 AM to 7:59 AM | 15 (4.2%) | 57 (20.8%) |
| 8:00 AM to 8:29 AM | 68 (19.1%) | 43 (15.7%) |
| 8:30 AM to 8:59 AM | 35 (9.8%) | 11 (4.0%) |
| 9:00 AM to 9:59 AM | 8 (2.2%) | 55 (20.1%) |
| 10:00 AM to 10:59 AM | 0 (0.0%) | 0 (0.0%) |
| 11:00 AM to 11:59 AM | 44 (12.4%) | 0 (0.0%) |
| 12:00 PM to 3:59 PM | 30 (8.4%) | 9 (3.3%) |
| 4:00 PM to 11:59 PM | 7 (2.0%) | 0 (0.0%) |
| Total | 356 (100.0%) | 274 (100.0%) |
Housing Occupancy in Lake Telemark
Occupancy by Ownership in Lake Telemark
Of the total 458 dwellings in Lake Telemark, owner-occupied units account for 409 (89.3%), while renter-occupied units make up 49 (10.7%).
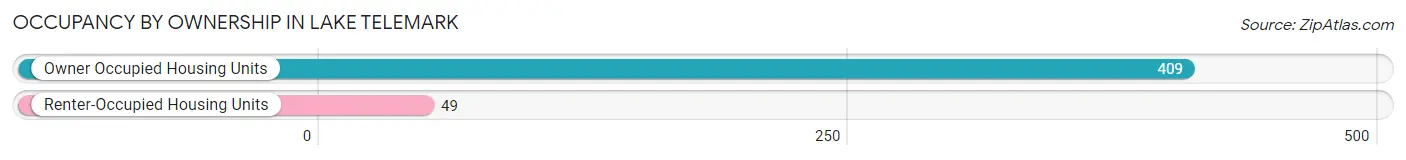
| Occupancy | # Housing Units | % Housing Units |
| Owner Occupied Housing Units | 409 | 89.3% |
| Renter-Occupied Housing Units | 49 | 10.7% |
| Total Occupied Housing Units | 458 | 100.0% |
Occupancy by Household Size in Lake Telemark
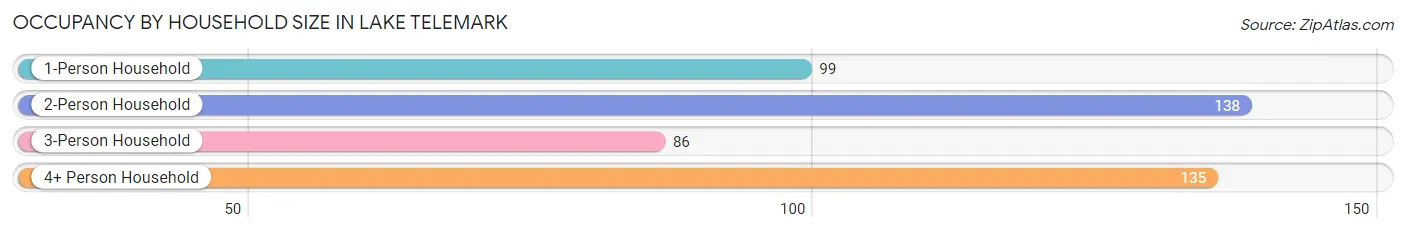
| Household Size | # Housing Units | % Housing Units |
| 1-Person Household | 99 | 21.6% |
| 2-Person Household | 138 | 30.1% |
| 3-Person Household | 86 | 18.8% |
| 4+ Person Household | 135 | 29.5% |
| Total Housing Units | 458 | 100.0% |
Occupancy by Ownership by Household Size in Lake Telemark
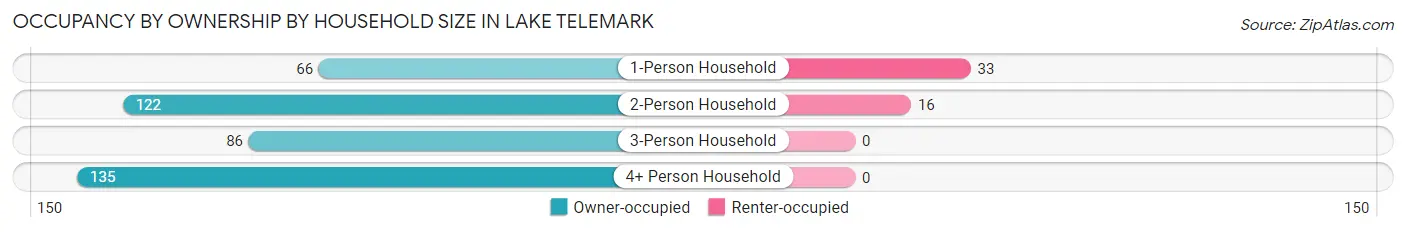
| Household Size | Owner-occupied | Renter-occupied |
| 1-Person Household | 66 (66.7%) | 33 (33.3%) |
| 2-Person Household | 122 (88.4%) | 16 (11.6%) |
| 3-Person Household | 86 (100.0%) | 0 (0.0%) |
| 4+ Person Household | 135 (100.0%) | 0 (0.0%) |
| Total Housing Units | 409 (89.3%) | 49 (10.7%) |
Occupancy by Educational Attainment in Lake Telemark
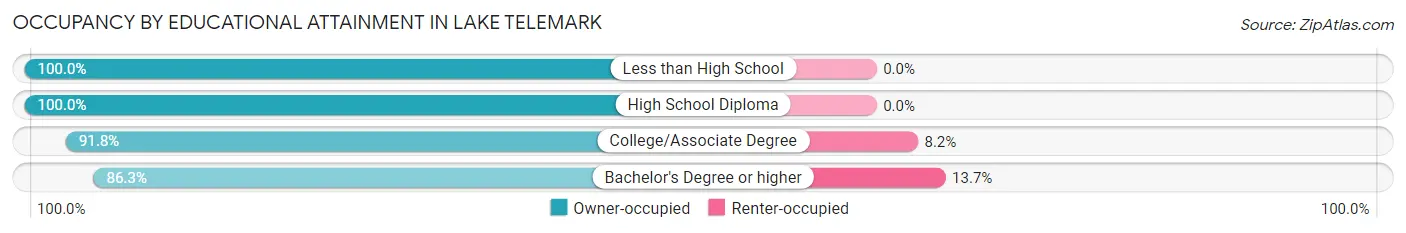
| Household Size | Owner-occupied | Renter-occupied |
| Less than High School | 9 (100.0%) | 0 (0.0%) |
| High School Diploma | 42 (100.0%) | 0 (0.0%) |
| College/Associate Degree | 112 (91.8%) | 10 (8.2%) |
| Bachelor's Degree or higher | 246 (86.3%) | 39 (13.7%) |
Occupancy by Age of Householder in Lake Telemark
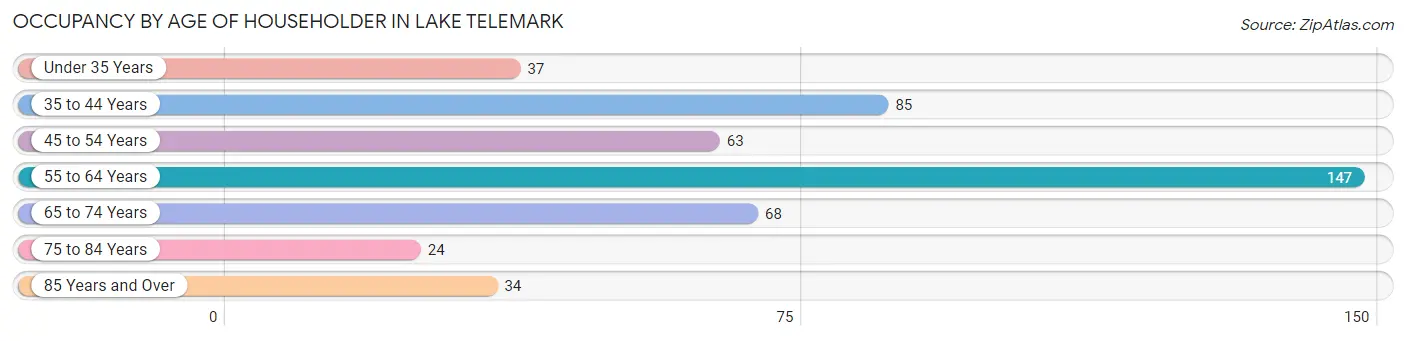
| Age Bracket | # Households | % Households |
| Under 35 Years | 37 | 8.1% |
| 35 to 44 Years | 85 | 18.6% |
| 45 to 54 Years | 63 | 13.8% |
| 55 to 64 Years | 147 | 32.1% |
| 65 to 74 Years | 68 | 14.8% |
| 75 to 84 Years | 24 | 5.2% |
| 85 Years and Over | 34 | 7.4% |
| Total | 458 | 100.0% |
Housing Finances in Lake Telemark
Median Income by Occupancy in Lake Telemark
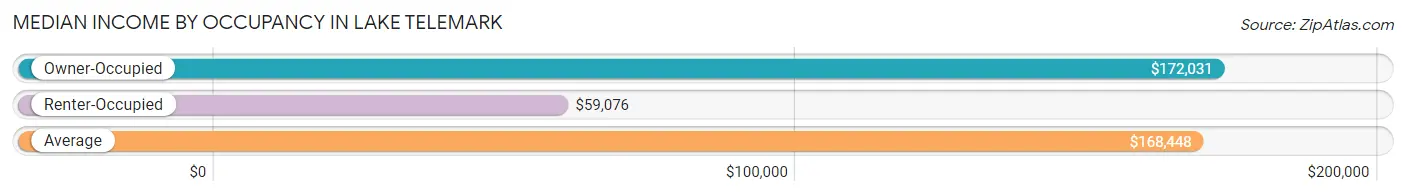
| Occupancy Type | # Households | Median Income |
| Owner-Occupied | 409 (89.3%) | $172,031 |
| Renter-Occupied | 49 (10.7%) | $59,076 |
| Average | 458 (100.0%) | $168,448 |
Occupancy by Householder Income Bracket in Lake Telemark
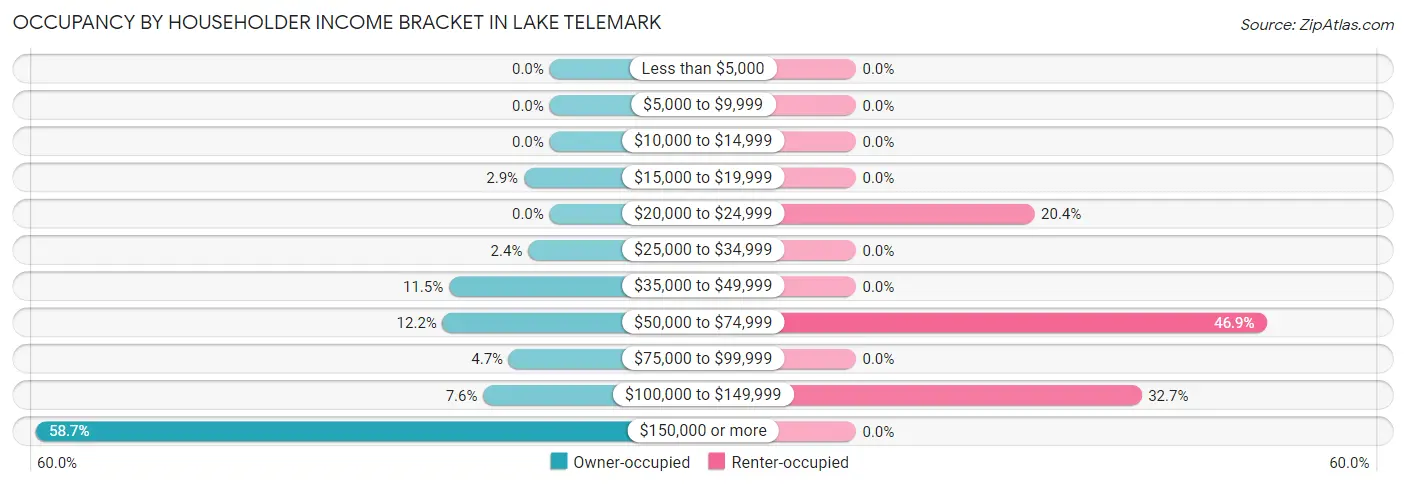
| Income Bracket | Owner-occupied | Renter-occupied |
| Less than $5,000 | 0 (0.0%) | 0 (0.0%) |
| $5,000 to $9,999 | 0 (0.0%) | 0 (0.0%) |
| $10,000 to $14,999 | 0 (0.0%) | 0 (0.0%) |
| $15,000 to $19,999 | 12 (2.9%) | 0 (0.0%) |
| $20,000 to $24,999 | 0 (0.0%) | 10 (20.4%) |
| $25,000 to $34,999 | 10 (2.4%) | 0 (0.0%) |
| $35,000 to $49,999 | 47 (11.5%) | 0 (0.0%) |
| $50,000 to $74,999 | 50 (12.2%) | 23 (46.9%) |
| $75,000 to $99,999 | 19 (4.6%) | 0 (0.0%) |
| $100,000 to $149,999 | 31 (7.6%) | 16 (32.7%) |
| $150,000 or more | 240 (58.7%) | 0 (0.0%) |
| Total | 409 (100.0%) | 49 (100.0%) |
Monthly Housing Cost Tiers in Lake Telemark
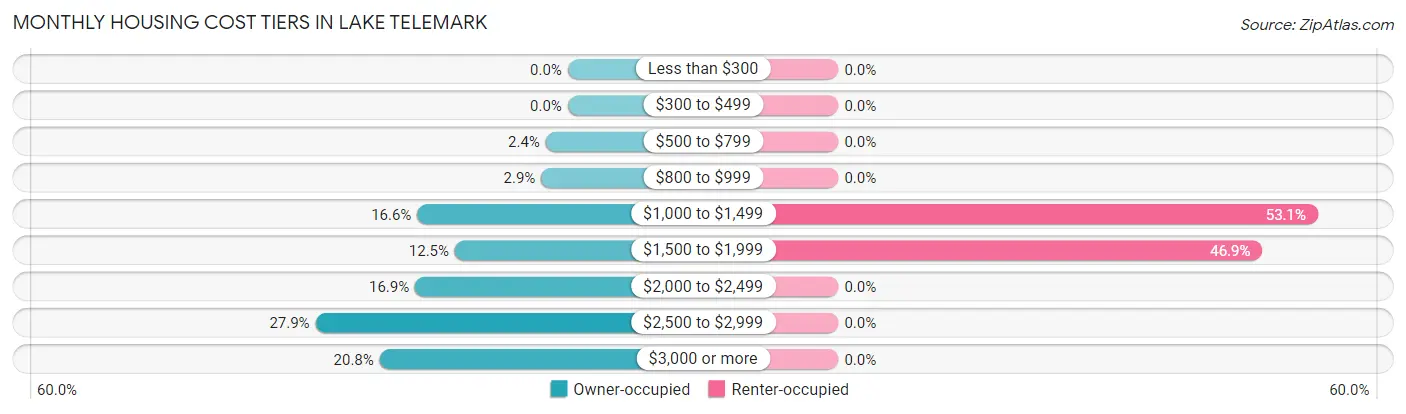
| Monthly Cost | Owner-occupied | Renter-occupied |
| Less than $300 | 0 (0.0%) | 0 (0.0%) |
| $300 to $499 | 0 (0.0%) | 0 (0.0%) |
| $500 to $799 | 10 (2.4%) | 0 (0.0%) |
| $800 to $999 | 12 (2.9%) | 0 (0.0%) |
| $1,000 to $1,499 | 68 (16.6%) | 26 (53.1%) |
| $1,500 to $1,999 | 51 (12.5%) | 23 (46.9%) |
| $2,000 to $2,499 | 69 (16.9%) | 0 (0.0%) |
| $2,500 to $2,999 | 114 (27.9%) | 0 (0.0%) |
| $3,000 or more | 85 (20.8%) | 0 (0.0%) |
| Total | 409 (100.0%) | 49 (100.0%) |
Physical Housing Characteristics in Lake Telemark
Housing Structures in Lake Telemark
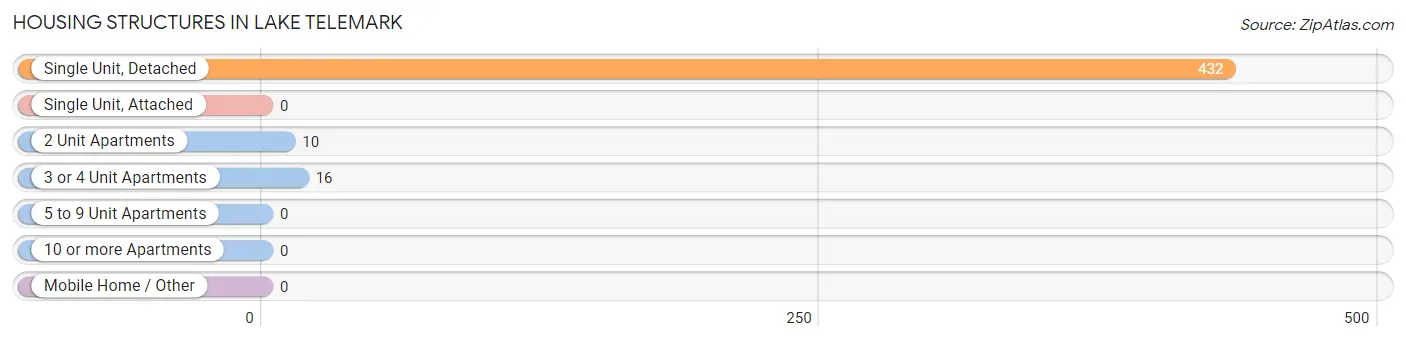
| Structure Type | # Housing Units | % Housing Units |
| Single Unit, Detached | 432 | 94.3% |
| Single Unit, Attached | 0 | 0.0% |
| 2 Unit Apartments | 10 | 2.2% |
| 3 or 4 Unit Apartments | 16 | 3.5% |
| 5 to 9 Unit Apartments | 0 | 0.0% |
| 10 or more Apartments | 0 | 0.0% |
| Mobile Home / Other | 0 | 0.0% |
| Total | 458 | 100.0% |
Housing Structures by Occupancy in Lake Telemark
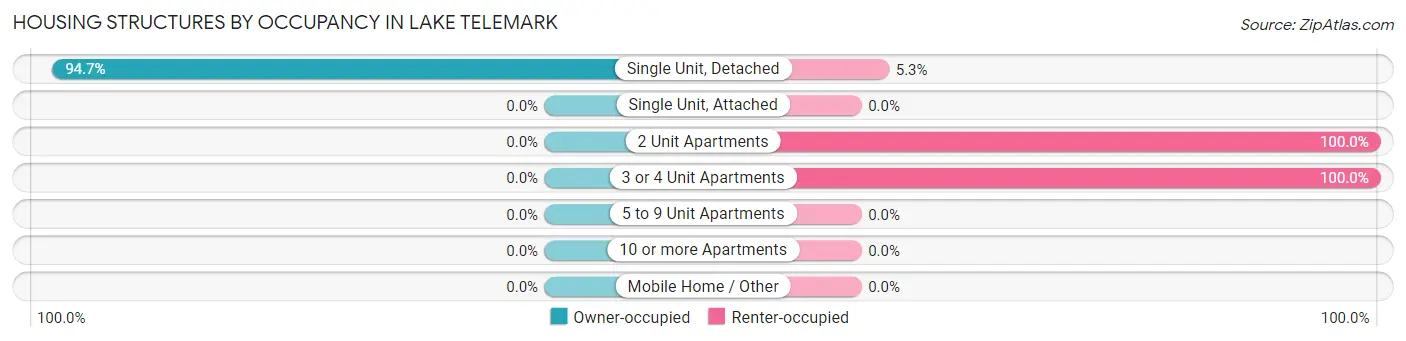
| Structure Type | Owner-occupied | Renter-occupied |
| Single Unit, Detached | 409 (94.7%) | 23 (5.3%) |
| Single Unit, Attached | 0 (0.0%) | 0 (0.0%) |
| 2 Unit Apartments | 0 (0.0%) | 10 (100.0%) |
| 3 or 4 Unit Apartments | 0 (0.0%) | 16 (100.0%) |
| 5 to 9 Unit Apartments | 0 (0.0%) | 0 (0.0%) |
| 10 or more Apartments | 0 (0.0%) | 0 (0.0%) |
| Mobile Home / Other | 0 (0.0%) | 0 (0.0%) |
| Total | 409 (89.3%) | 49 (10.7%) |
Housing Structures by Number of Rooms in Lake Telemark
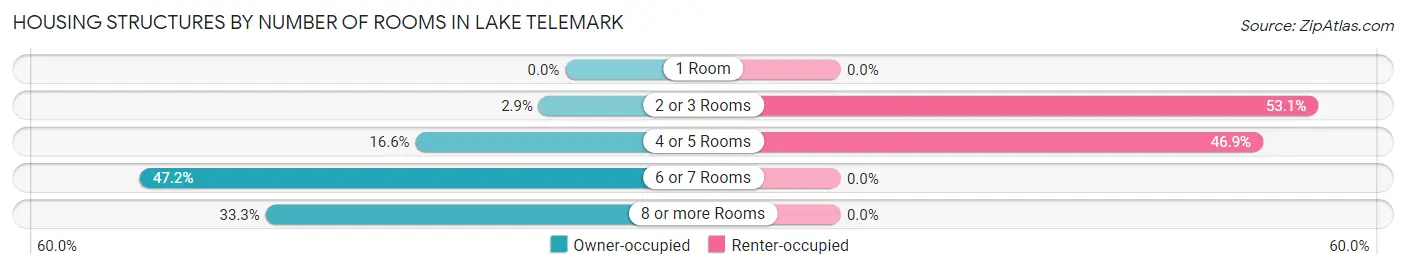
| Number of Rooms | Owner-occupied | Renter-occupied |
| 1 Room | 0 (0.0%) | 0 (0.0%) |
| 2 or 3 Rooms | 12 (2.9%) | 26 (53.1%) |
| 4 or 5 Rooms | 68 (16.6%) | 23 (46.9%) |
| 6 or 7 Rooms | 193 (47.2%) | 0 (0.0%) |
| 8 or more Rooms | 136 (33.3%) | 0 (0.0%) |
| Total | 409 (100.0%) | 49 (100.0%) |
Housing Structure by Heating Type in Lake Telemark
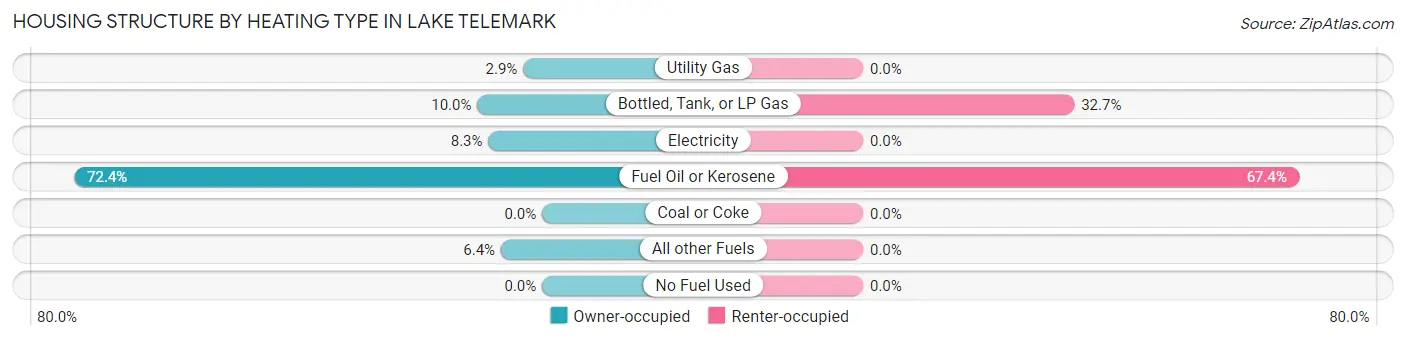
| Heating Type | Owner-occupied | Renter-occupied |
| Utility Gas | 12 (2.9%) | 0 (0.0%) |
| Bottled, Tank, or LP Gas | 41 (10.0%) | 16 (32.7%) |
| Electricity | 34 (8.3%) | 0 (0.0%) |
| Fuel Oil or Kerosene | 296 (72.4%) | 33 (67.3%) |
| Coal or Coke | 0 (0.0%) | 0 (0.0%) |
| All other Fuels | 26 (6.4%) | 0 (0.0%) |
| No Fuel Used | 0 (0.0%) | 0 (0.0%) |
| Total | 409 (100.0%) | 49 (100.0%) |
Household Vehicle Usage in Lake Telemark
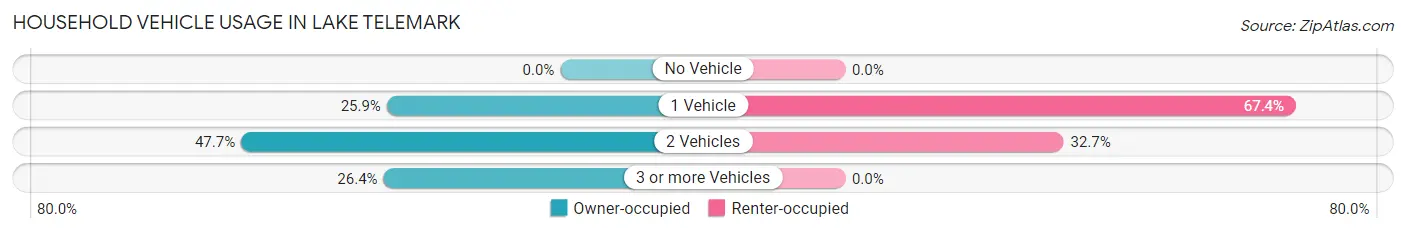
| Vehicles per Household | Owner-occupied | Renter-occupied |
| No Vehicle | 0 (0.0%) | 0 (0.0%) |
| 1 Vehicle | 106 (25.9%) | 33 (67.3%) |
| 2 Vehicles | 195 (47.7%) | 16 (32.7%) |
| 3 or more Vehicles | 108 (26.4%) | 0 (0.0%) |
| Total | 409 (100.0%) | 49 (100.0%) |
Real Estate & Mortgages in Lake Telemark
Real Estate and Mortgage Overview in Lake Telemark
| Characteristic | Without Mortgage | With Mortgage |
| Housing Units | 81 | 328 |
| Median Property Value | $367,000 | $370,900 |
| Median Household Income | $56,979 | $221 |
| Monthly Housing Costs | $1,197 | $85 |
| Real Estate Taxes | $10,001 | $0 |
Property Value by Mortgage Status in Lake Telemark
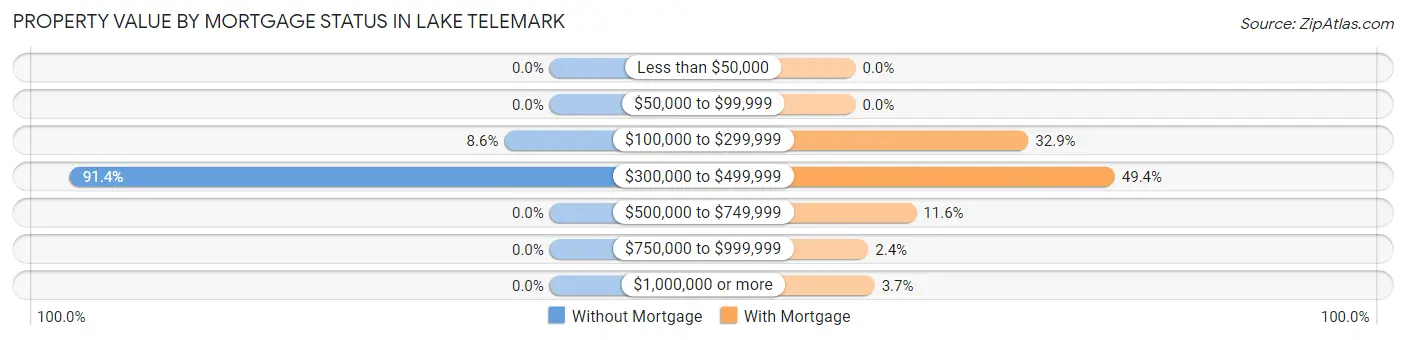
| Property Value | Without Mortgage | With Mortgage |
| Less than $50,000 | 0 (0.0%) | 0 (0.0%) |
| $50,000 to $99,999 | 0 (0.0%) | 0 (0.0%) |
| $100,000 to $299,999 | 7 (8.6%) | 108 (32.9%) |
| $300,000 to $499,999 | 74 (91.4%) | 162 (49.4%) |
| $500,000 to $749,999 | 0 (0.0%) | 38 (11.6%) |
| $750,000 to $999,999 | 0 (0.0%) | 8 (2.4%) |
| $1,000,000 or more | 0 (0.0%) | 12 (3.7%) |
| Total | 81 (100.0%) | 328 (100.0%) |
Household Income by Mortgage Status in Lake Telemark
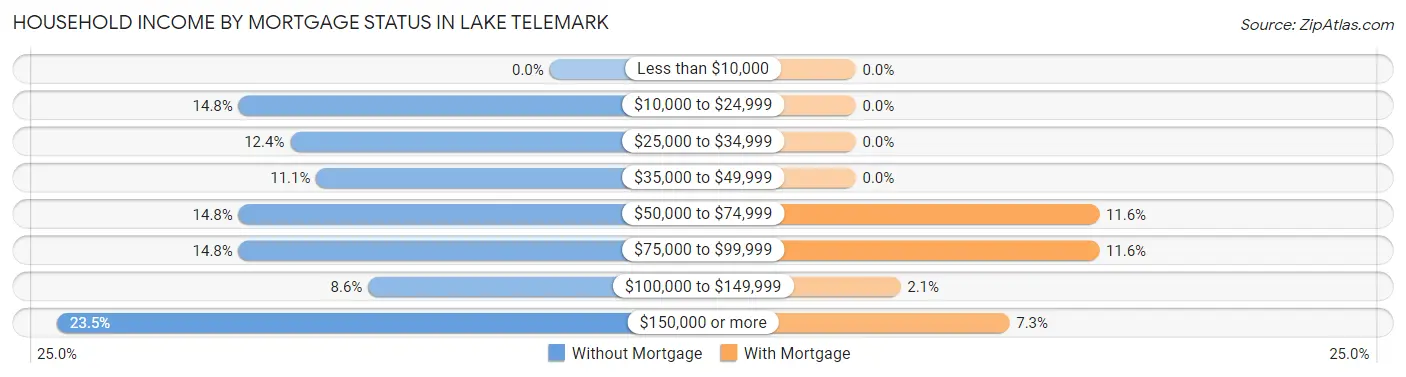
| Household Income | Without Mortgage | With Mortgage |
| Less than $10,000 | 0 (0.0%) | 0 (0.0%) |
| $10,000 to $24,999 | 12 (14.8%) | 0 (0.0%) |
| $25,000 to $34,999 | 10 (12.3%) | 0 (0.0%) |
| $35,000 to $49,999 | 9 (11.1%) | 0 (0.0%) |
| $50,000 to $74,999 | 12 (14.8%) | 38 (11.6%) |
| $75,000 to $99,999 | 12 (14.8%) | 38 (11.6%) |
| $100,000 to $149,999 | 7 (8.6%) | 7 (2.1%) |
| $150,000 or more | 19 (23.5%) | 24 (7.3%) |
| Total | 81 (100.0%) | 328 (100.0%) |
Property Value to Household Income Ratio in Lake Telemark
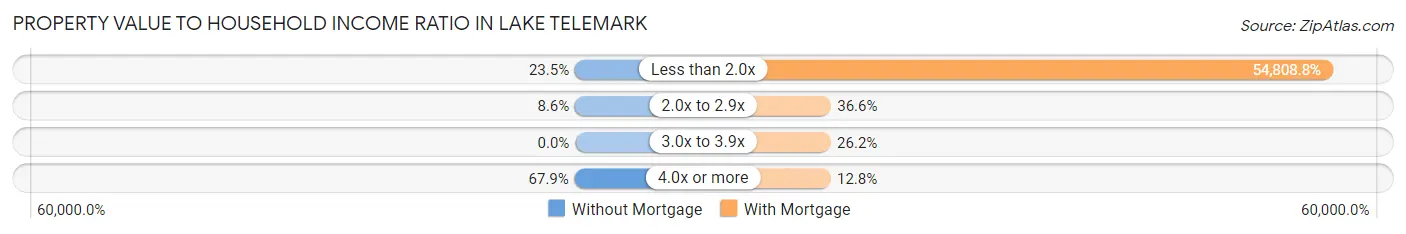
| Value-to-Income Ratio | Without Mortgage | With Mortgage |
| Less than 2.0x | 19 (23.5%) | 179,773 (54,808.8%) |
| 2.0x to 2.9x | 7 (8.6%) | 120 (36.6%) |
| 3.0x to 3.9x | 0 (0.0%) | 86 (26.2%) |
| 4.0x or more | 55 (67.9%) | 42 (12.8%) |
| Total | 81 (100.0%) | 328 (100.0%) |
Real Estate Taxes by Mortgage Status in Lake Telemark
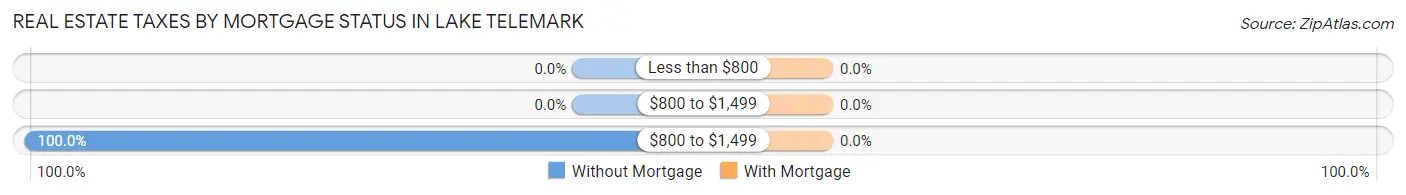
| Property Taxes | Without Mortgage | With Mortgage |
| Less than $800 | 0 (0.0%) | 0 (0.0%) |
| $800 to $1,499 | 0 (0.0%) | 0 (0.0%) |
| $800 to $1,499 | 81 (100.0%) | 0 (0.0%) |
| Total | 81 (100.0%) | 328 (100.0%) |
Health & Disability in Lake Telemark
Health Insurance Coverage by Age in Lake Telemark
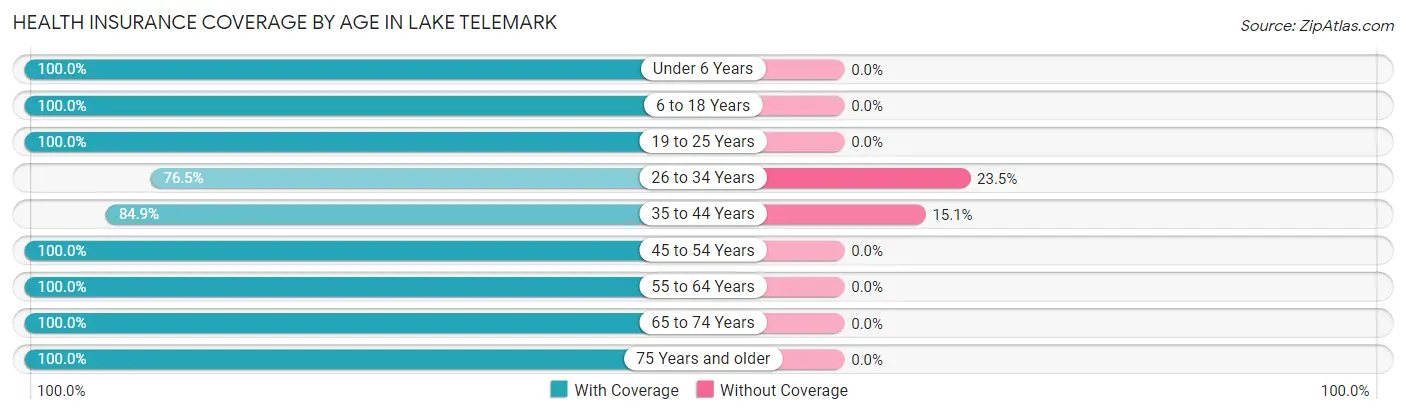
| Age Bracket | With Coverage | Without Coverage |
| Under 6 Years | 64 (100.0%) | 0 (0.0%) |
| 6 to 18 Years | 147 (100.0%) | 0 (0.0%) |
| 19 to 25 Years | 185 (100.0%) | 0 (0.0%) |
| 26 to 34 Years | 137 (76.5%) | 42 (23.5%) |
| 35 to 44 Years | 129 (84.9%) | 23 (15.1%) |
| 45 to 54 Years | 99 (100.0%) | 0 (0.0%) |
| 55 to 64 Years | 288 (100.0%) | 0 (0.0%) |
| 65 to 74 Years | 92 (100.0%) | 0 (0.0%) |
| 75 Years and older | 95 (100.0%) | 0 (0.0%) |
| Total | 1,236 (95.0%) | 65 (5.0%) |
Health Insurance Coverage by Citizenship Status in Lake Telemark
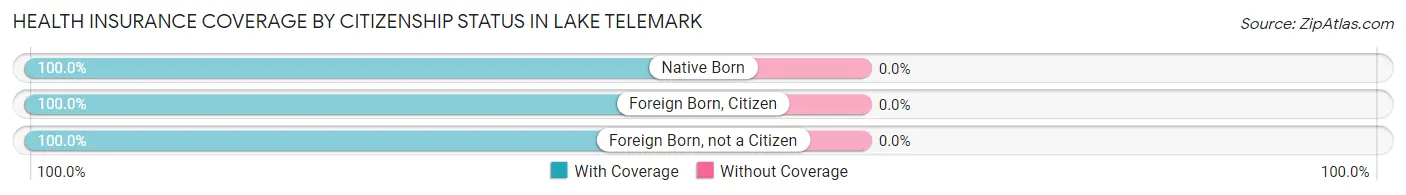
| Citizenship Status | With Coverage | Without Coverage |
| Native Born | 64 (100.0%) | 0 (0.0%) |
| Foreign Born, Citizen | 147 (100.0%) | 0 (0.0%) |
| Foreign Born, not a Citizen | 185 (100.0%) | 0 (0.0%) |
Health Insurance Coverage by Household Income in Lake Telemark
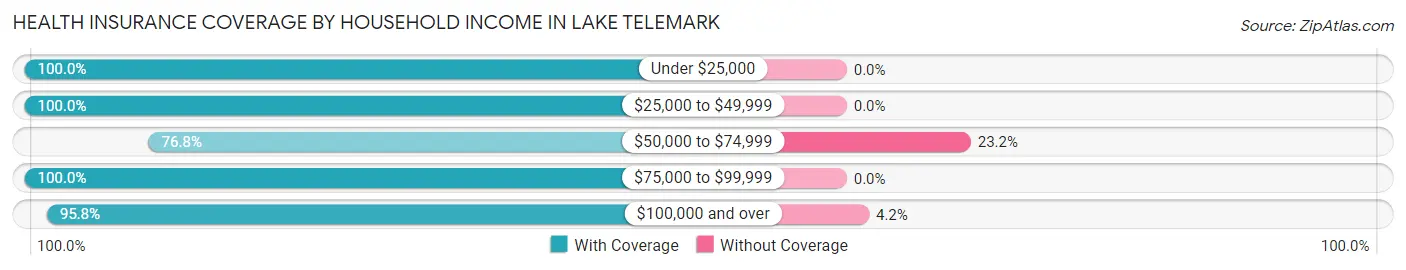
| Household Income | With Coverage | Without Coverage |
| Under $25,000 | 22 (100.0%) | 0 (0.0%) |
| $25,000 to $49,999 | 126 (100.0%) | 0 (0.0%) |
| $50,000 to $74,999 | 76 (76.8%) | 23 (23.2%) |
| $75,000 to $99,999 | 47 (100.0%) | 0 (0.0%) |
| $100,000 and over | 965 (95.8%) | 42 (4.2%) |
Public vs Private Health Insurance Coverage by Age in Lake Telemark
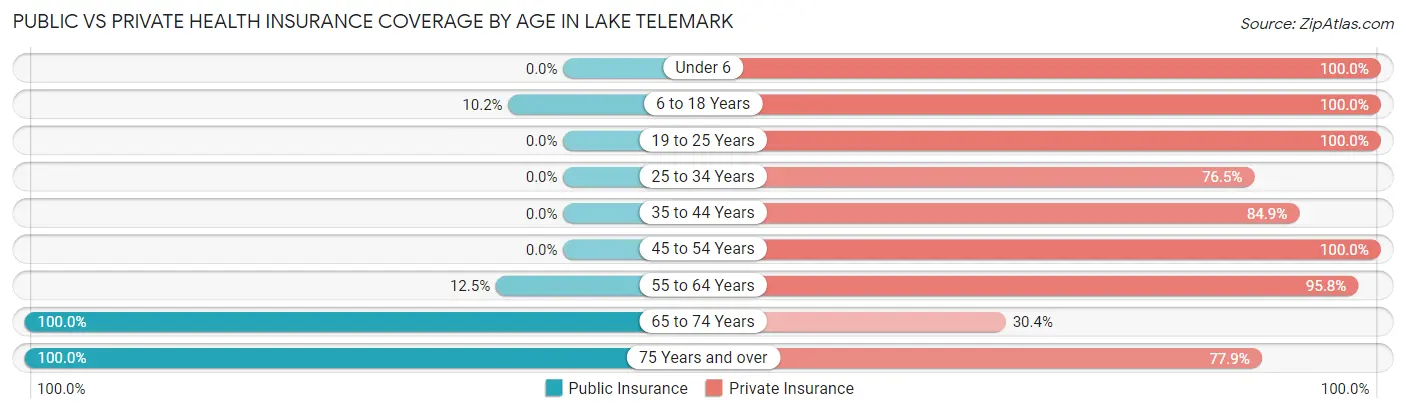
| Age Bracket | Public Insurance | Private Insurance |
| Under 6 | 0 (0.0%) | 64 (100.0%) |
| 6 to 18 Years | 15 (10.2%) | 147 (100.0%) |
| 19 to 25 Years | 0 (0.0%) | 185 (100.0%) |
| 25 to 34 Years | 0 (0.0%) | 137 (76.5%) |
| 35 to 44 Years | 0 (0.0%) | 129 (84.9%) |
| 45 to 54 Years | 0 (0.0%) | 99 (100.0%) |
| 55 to 64 Years | 36 (12.5%) | 276 (95.8%) |
| 65 to 74 Years | 92 (100.0%) | 28 (30.4%) |
| 75 Years and over | 95 (100.0%) | 74 (77.9%) |
| Total | 238 (18.3%) | 1,139 (87.5%) |
Disability Status by Sex by Age in Lake Telemark
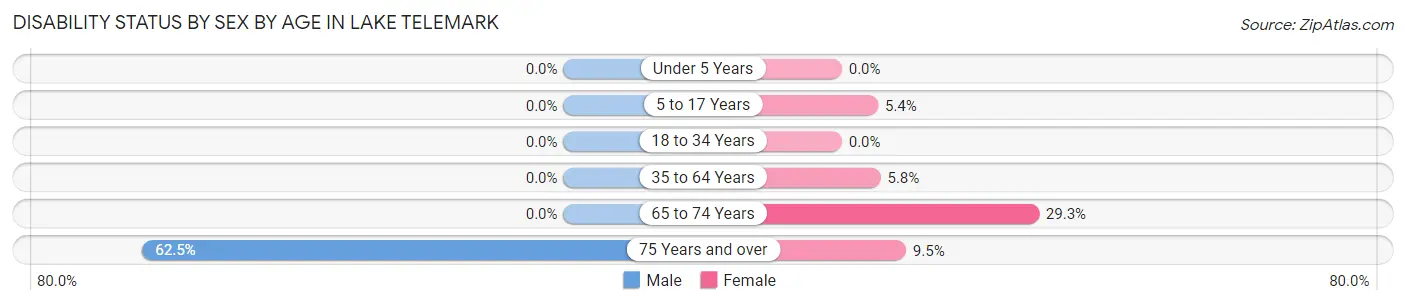
| Age Bracket | Male | Female |
| Under 5 Years | 0 (0.0%) | 0 (0.0%) |
| 5 to 17 Years | 0 (0.0%) | 5 (5.4%) |
| 18 to 34 Years | 0 (0.0%) | 0 (0.0%) |
| 35 to 64 Years | 0 (0.0%) | 15 (5.8%) |
| 65 to 74 Years | 0 (0.0%) | 12 (29.3%) |
| 75 Years and over | 20 (62.5%) | 6 (9.5%) |
Disability Class by Sex by Age in Lake Telemark
Disability Class: Hearing Difficulty
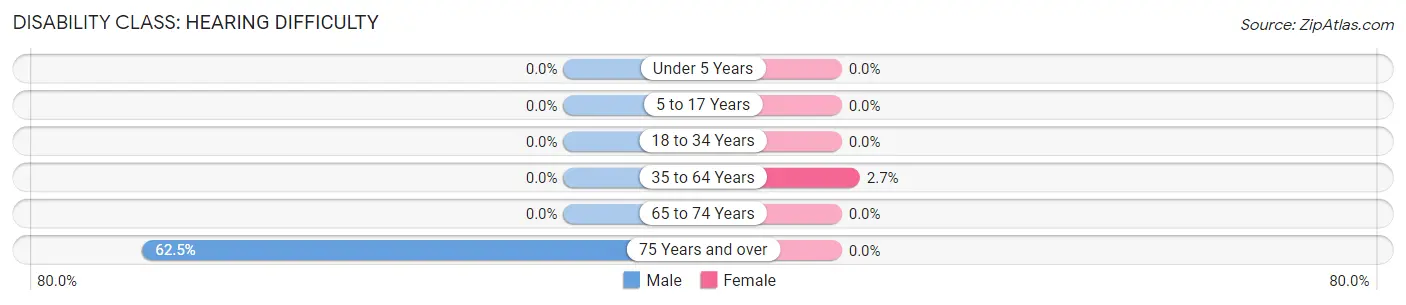
| Age Bracket | Male | Female |
| Under 5 Years | 0 (0.0%) | 0 (0.0%) |
| 5 to 17 Years | 0 (0.0%) | 0 (0.0%) |
| 18 to 34 Years | 0 (0.0%) | 0 (0.0%) |
| 35 to 64 Years | 0 (0.0%) | 7 (2.7%) |
| 65 to 74 Years | 0 (0.0%) | 0 (0.0%) |
| 75 Years and over | 20 (62.5%) | 0 (0.0%) |
Disability Class: Vision Difficulty
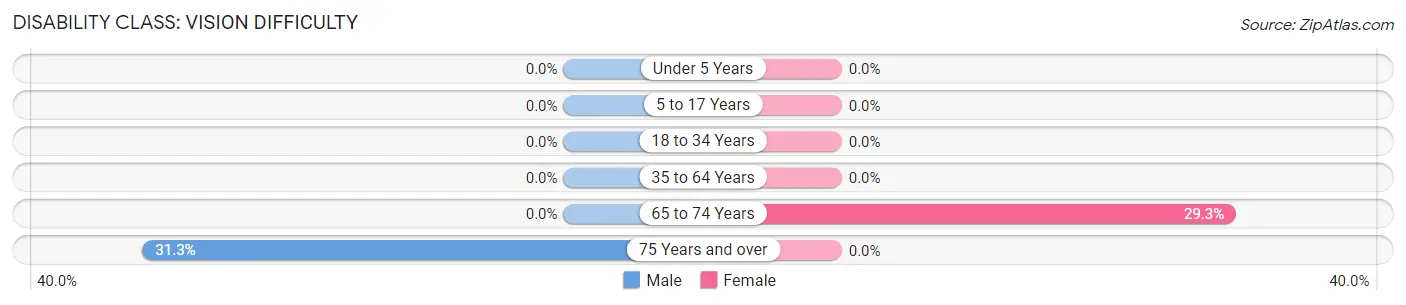
| Age Bracket | Male | Female |
| Under 5 Years | 0 (0.0%) | 0 (0.0%) |
| 5 to 17 Years | 0 (0.0%) | 0 (0.0%) |
| 18 to 34 Years | 0 (0.0%) | 0 (0.0%) |
| 35 to 64 Years | 0 (0.0%) | 0 (0.0%) |
| 65 to 74 Years | 0 (0.0%) | 12 (29.3%) |
| 75 Years and over | 10 (31.2%) | 0 (0.0%) |
Disability Class: Cognitive Difficulty
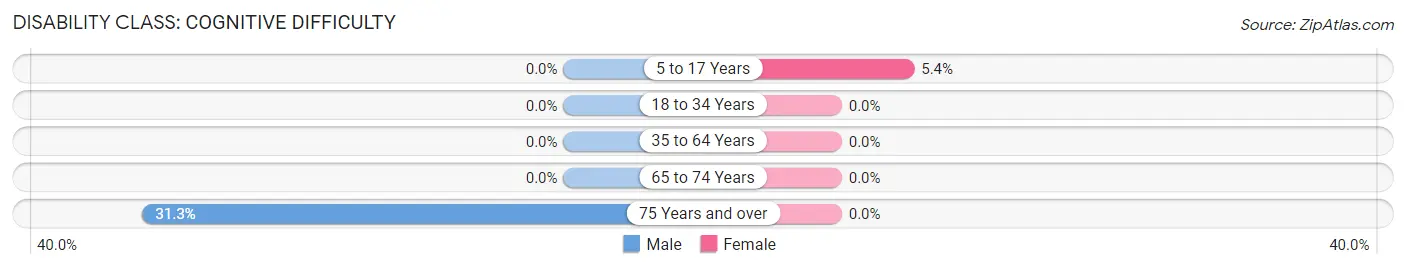
| Age Bracket | Male | Female |
| 5 to 17 Years | 0 (0.0%) | 5 (5.4%) |
| 18 to 34 Years | 0 (0.0%) | 0 (0.0%) |
| 35 to 64 Years | 0 (0.0%) | 0 (0.0%) |
| 65 to 74 Years | 0 (0.0%) | 0 (0.0%) |
| 75 Years and over | 10 (31.2%) | 0 (0.0%) |
Disability Class: Ambulatory Difficulty
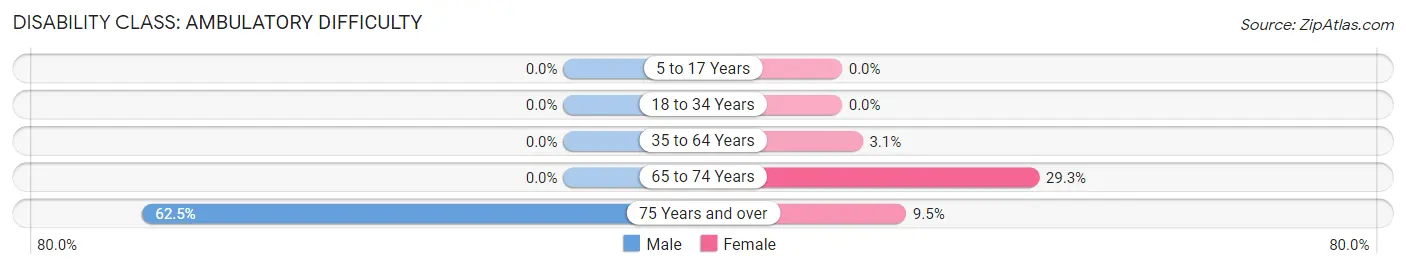
| Age Bracket | Male | Female |
| 5 to 17 Years | 0 (0.0%) | 0 (0.0%) |
| 18 to 34 Years | 0 (0.0%) | 0 (0.0%) |
| 35 to 64 Years | 0 (0.0%) | 8 (3.1%) |
| 65 to 74 Years | 0 (0.0%) | 12 (29.3%) |
| 75 Years and over | 20 (62.5%) | 6 (9.5%) |
Disability Class: Self-Care Difficulty
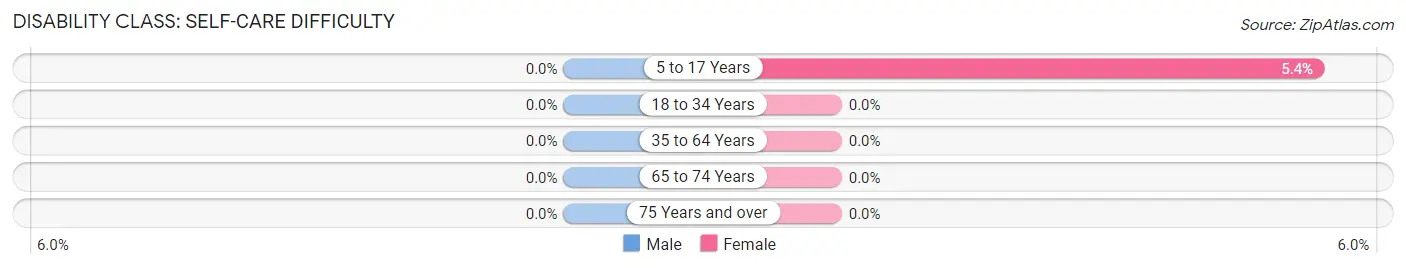
| Age Bracket | Male | Female |
| 5 to 17 Years | 0 (0.0%) | 5 (5.4%) |
| 18 to 34 Years | 0 (0.0%) | 0 (0.0%) |
| 35 to 64 Years | 0 (0.0%) | 0 (0.0%) |
| 65 to 74 Years | 0 (0.0%) | 0 (0.0%) |
| 75 Years and over | 0 (0.0%) | 0 (0.0%) |
Technology Access in Lake Telemark
Computing Device Access in Lake Telemark
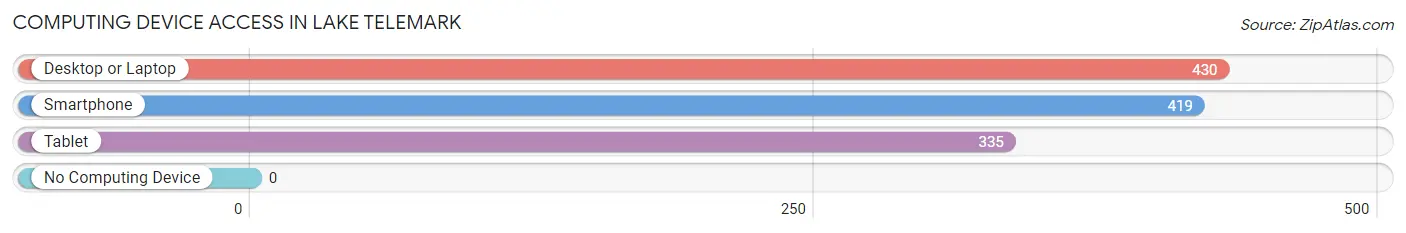
| Device Type | # Households | % Households |
| Desktop or Laptop | 430 | 93.9% |
| Smartphone | 419 | 91.5% |
| Tablet | 335 | 73.1% |
| No Computing Device | 0 | 0.0% |
| Total | 458 | 100.0% |
Internet Access in Lake Telemark
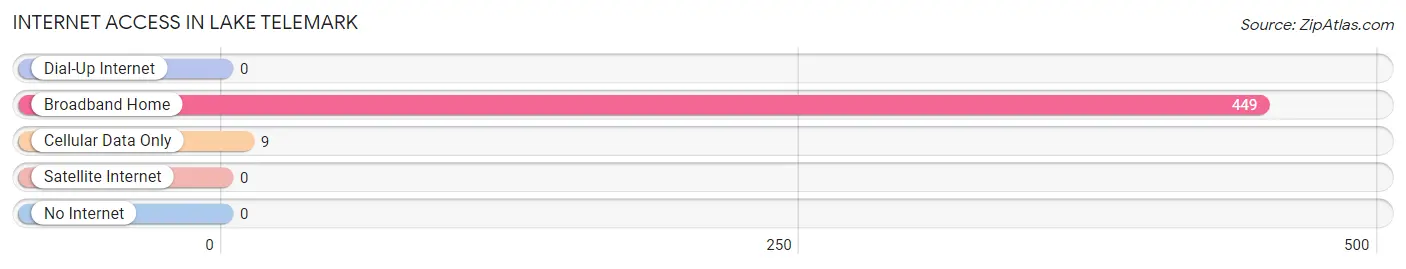
| Internet Type | # Households | % Households |
| Dial-Up Internet | 0 | 0.0% |
| Broadband Home | 449 | 98.0% |
| Cellular Data Only | 9 | 2.0% |
| Satellite Internet | 0 | 0.0% |
| No Internet | 0 | 0.0% |
| Total | 458 | 100.0% |
Lake Telemark Summary
Telemark Lake is a small lake located in Sussex County, New Jersey. It is located in the Kittatinny Valley, which is part of the Great Appalachian Valley. The lake is approximately 1.5 miles long and 0.5 miles wide. It is surrounded by the towns of Andover, Byram, and Stanhope.
History
The area around Telemark Lake has been inhabited since the late 17th century. The first settlers were Dutch and German immigrants who established farms in the area. The lake was originally known as “Teal’s Pond” after the Teal family who owned the land. In the late 19th century, the lake was renamed “Telemark Lake” after the Telemark region of Norway.
In the early 20th century, the lake became a popular destination for fishing and swimming. The lake was also used for ice skating in the winter months. In the 1950s, the lake was developed as a residential community. The lake is now home to several hundred homes and is a popular destination for vacationers.
Geography
Telemark Lake is located in the Kittatinny Valley, which is part of the Great Appalachian Valley. The lake is approximately 1.5 miles long and 0.5 miles wide. It is surrounded by the towns of Andover, Byram, and Stanhope. The lake is fed by several small streams and is drained by the Musconetcong River. The lake is located at an elevation of 860 feet above sea level.
The lake is surrounded by wooded hills and is a popular destination for fishing, swimming, and boating. The lake is also home to several species of fish, including largemouth bass, smallmouth bass, walleye, and northern pike.
Economy
Telemark Lake is a popular destination for vacationers and is home to several hundred homes. The lake is also home to several businesses, including a marina, a restaurant, and a campground. The lake is also a popular destination for fishing and boating.
Demographics
As of the 2010 census, the population of Telemark Lake was 1,845. The median age was 44.7 years and the median household income was $76,944. The racial makeup of the area was 94.3% White, 2.2% African American, 0.3% Native American, 0.9% Asian, and 2.3% from other races.
Conclusion
Telemark Lake is a small lake located in Sussex County, New Jersey. It is located in the Kittatinny Valley, which is part of the Great Appalachian Valley. The lake is approximately 1.5 miles long and 0.5 miles wide. It is surrounded by the towns of Andover, Byram, and Stanhope. The lake has been inhabited since the late 17th century and is now home to several hundred homes and businesses. The lake is a popular destination for vacationers and is home to several species of fish. The population of Telemark Lake was 1,845 as of the 2010 census and the median household income was $76,944.
Common Questions
What is Per Capita Income in Lake Telemark?
Per Capita income in Lake Telemark is $55,468.
What is the Median Family Income in Lake Telemark?
Median Family Income in Lake Telemark is $184,091.
What is the Median Household income in Lake Telemark?
Median Household Income in Lake Telemark is $168,448.
What is Income or Wage Gap in Lake Telemark?
Income or Wage Gap in Lake Telemark is 29.1%.
Women in Lake Telemark earn 70.9 cents for every dollar earned by a man.
What is Inequality or Gini Index in Lake Telemark?
Inequality or Gini Index in Lake Telemark is 0.39.
What is the Total Population of Lake Telemark?
Total Population of Lake Telemark is 1,301.
What is the Total Male Population of Lake Telemark?
Total Male Population of Lake Telemark is 638.
What is the Total Female Population of Lake Telemark?
Total Female Population of Lake Telemark is 663.
What is the Ratio of Males per 100 Females in Lake Telemark?
There are 96.23 Males per 100 Females in Lake Telemark.
What is the Ratio of Females per 100 Males in Lake Telemark?
There are 103.92 Females per 100 Males in Lake Telemark.
What is the Median Population Age in Lake Telemark?
Median Population Age in Lake Telemark is 38.8 Years.
What is the Average Family Size in Lake Telemark
Average Family Size in Lake Telemark is 3.5 People.
What is the Average Household Size in Lake Telemark
Average Household Size in Lake Telemark is 2.8 People.
How Large is the Labor Force in Lake Telemark?
There are 812 People in the Labor Forcein in Lake Telemark.
What is the Percentage of People in the Labor Force in Lake Telemark?
72.2% of People are in the Labor Force in Lake Telemark.
What is the Unemployment Rate in Lake Telemark?
Unemployment Rate in Lake Telemark is 2.5%.