Cliffwood Beach, NJ Map & Demographics
Cliffwood Beach Map
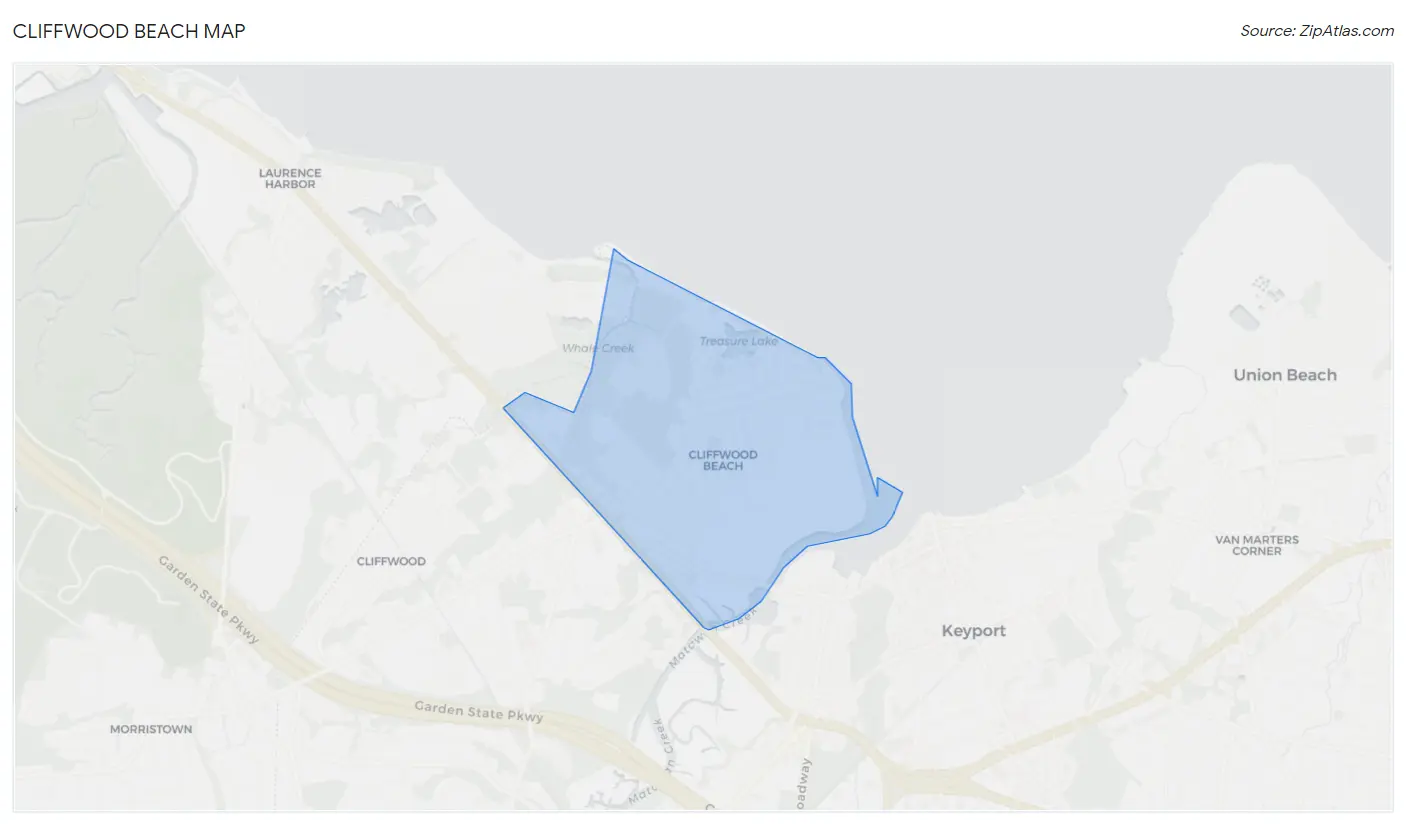
Cliffwood Beach Overview
$46,299
PER CAPITA INCOME
$120,350
AVG FAMILY INCOME
$111,786
AVG HOUSEHOLD INCOME
40.5%
WAGE / INCOME GAP [ % ]
59.5¢/ $1
WAGE / INCOME GAP [ $ ]
0.32
INEQUALITY / GINI INDEX
3,008
TOTAL POPULATION
1,598
MALE POPULATION
1,410
FEMALE POPULATION
113.33
MALES / 100 FEMALES
88.24
FEMALES / 100 MALES
44.8
MEDIAN AGE
2.8
AVG FAMILY SIZE
2.4
AVG HOUSEHOLD SIZE
1,738
LABOR FORCE [ PEOPLE ]
66.7%
PERCENT IN LABOR FORCE
5.1%
UNEMPLOYMENT RATE
Income in Cliffwood Beach
Income Overview in Cliffwood Beach
Per Capita Income in Cliffwood Beach is $46,299, while median incomes of families and households are $120,350 and $111,786 respectively.
| Characteristic | Number | Measure |
| Per Capita Income | 3,008 | $46,299 |
| Median Family Income | 939 | $120,350 |
| Mean Family Income | 939 | $129,416 |
| Median Household Income | 1,254 | $111,786 |
| Mean Household Income | 1,254 | $117,098 |
| Income Deficit | 939 | $0 |
| Wage / Income Gap (%) | 3,008 | 40.49% |
| Wage / Income Gap ($) | 3,008 | 59.51¢ per $1 |
| Gini / Inequality Index | 3,008 | 0.32 |
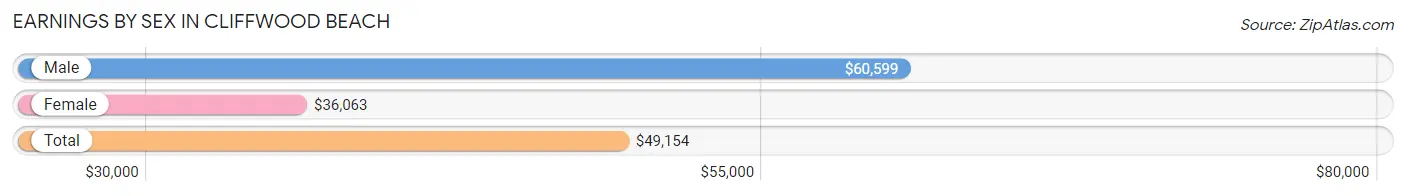
Earnings by Sex in Cliffwood Beach
Average Earnings in Cliffwood Beach are $49,154, $60,599 for men and $36,063 for women, a difference of 40.5%.
| Sex | Number | Average Earnings |
| Male | 1,060 (58.3%) | $60,599 |
| Female | 758 (41.7%) | $36,063 |
| Total | 1,818 (100.0%) | $49,154 |
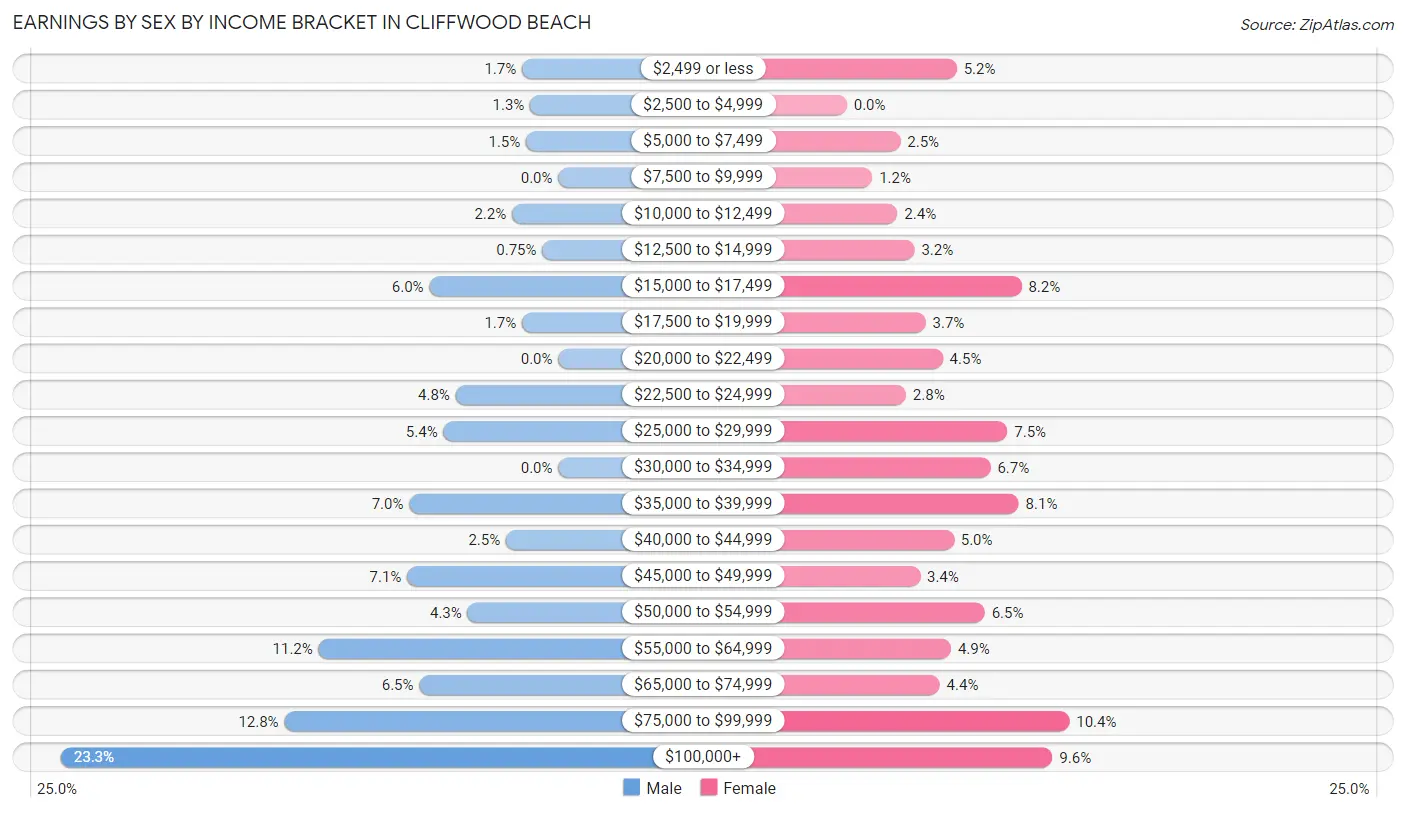
Earnings by Sex by Income Bracket in Cliffwood Beach
The most common earnings brackets in Cliffwood Beach are $100,000+ for men (247 | 23.3%) and $75,000 to $99,999 for women (79 | 10.4%).
| Income | Male | Female |
| $2,499 or less | 18 (1.7%) | 39 (5.1%) |
| $2,500 to $4,999 | 14 (1.3%) | 0 (0.0%) |
| $5,000 to $7,499 | 16 (1.5%) | 19 (2.5%) |
| $7,500 to $9,999 | 0 (0.0%) | 9 (1.2%) |
| $10,000 to $12,499 | 23 (2.2%) | 18 (2.4%) |
| $12,500 to $14,999 | 8 (0.7%) | 24 (3.2%) |
| $15,000 to $17,499 | 64 (6.0%) | 62 (8.2%) |
| $17,500 to $19,999 | 18 (1.7%) | 28 (3.7%) |
| $20,000 to $22,499 | 0 (0.0%) | 34 (4.5%) |
| $22,500 to $24,999 | 51 (4.8%) | 21 (2.8%) |
| $25,000 to $29,999 | 57 (5.4%) | 57 (7.5%) |
| $30,000 to $34,999 | 0 (0.0%) | 51 (6.7%) |
| $35,000 to $39,999 | 74 (7.0%) | 61 (8.1%) |
| $40,000 to $44,999 | 26 (2.5%) | 38 (5.0%) |
| $45,000 to $49,999 | 75 (7.1%) | 26 (3.4%) |
| $50,000 to $54,999 | 45 (4.3%) | 49 (6.5%) |
| $55,000 to $64,999 | 119 (11.2%) | 37 (4.9%) |
| $65,000 to $74,999 | 69 (6.5%) | 33 (4.3%) |
| $75,000 to $99,999 | 136 (12.8%) | 79 (10.4%) |
| $100,000+ | 247 (23.3%) | 73 (9.6%) |
| Total | 1,060 (100.0%) | 758 (100.0%) |
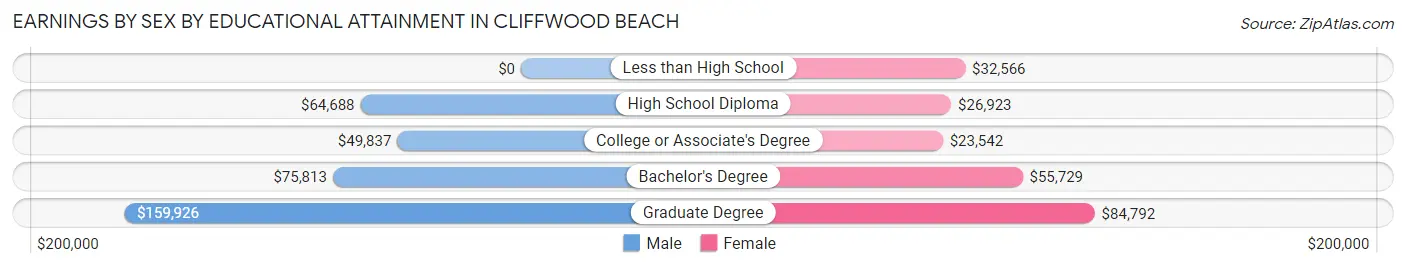
Earnings by Sex by Educational Attainment in Cliffwood Beach
Average earnings in Cliffwood Beach are $61,937 for men and $36,219 for women, a difference of 41.5%. Men with an educational attainment of graduate degree enjoy the highest average annual earnings of $159,926, while those with college or associate's degree education earn the least with $49,837. Women with an educational attainment of graduate degree earn the most with the average annual earnings of $84,792, while those with college or associate's degree education have the smallest earnings of $23,542.
| Educational Attainment | Male Income | Female Income |
| Less than High School | - | - |
| High School Diploma | $64,688 | $26,923 |
| College or Associate's Degree | $49,837 | $23,542 |
| Bachelor's Degree | $75,813 | $55,729 |
| Graduate Degree | $159,926 | $84,792 |
| Total | $61,937 | $36,219 |
Family Income in Cliffwood Beach
Family Income Brackets in Cliffwood Beach
According to the Cliffwood Beach family income data, there are 218 families falling into the $75,000 to $99,999 income range, which is the most common income bracket and makes up 23.2% of all families.
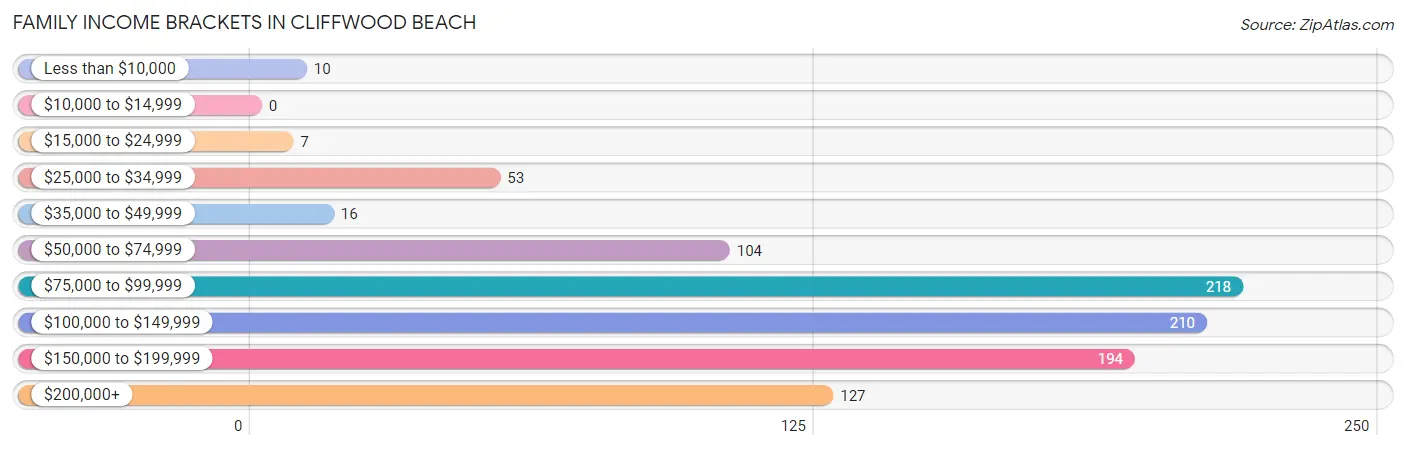
| Income Bracket | # Families | % Families |
| Less than $10,000 | 10 | 1.1% |
| $10,000 to $14,999 | 0 | 0.0% |
| $15,000 to $24,999 | 7 | 0.7% |
| $25,000 to $34,999 | 53 | 5.6% |
| $35,000 to $49,999 | 16 | 1.7% |
| $50,000 to $74,999 | 104 | 11.1% |
| $75,000 to $99,999 | 218 | 23.2% |
| $100,000 to $149,999 | 210 | 22.4% |
| $150,000 to $199,999 | 194 | 20.7% |
| $200,000+ | 127 | 13.5% |
Family Income by Famaliy Size in Cliffwood Beach
3-person families (197 | 21.0%) account for the highest median family income in Cliffwood Beach with $160,929 per family, while 2-person families (554 | 59.0%) have the highest median income of $55,536 per family member.
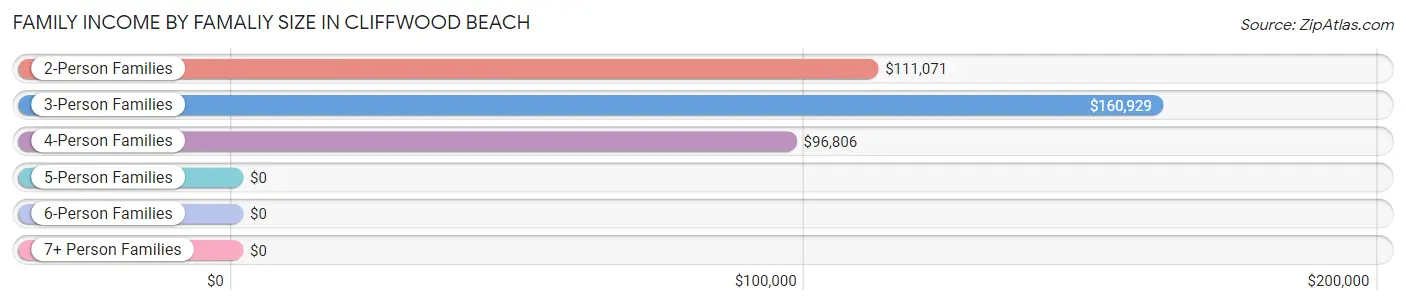
| Income Bracket | # Families | Median Income |
| 2-Person Families | 554 (59.0%) | $111,071 |
| 3-Person Families | 197 (21.0%) | $160,929 |
| 4-Person Families | 96 (10.2%) | $96,806 |
| 5-Person Families | 81 (8.6%) | $0 |
| 6-Person Families | 11 (1.2%) | $0 |
| 7+ Person Families | 0 (0.0%) | $0 |
| Total | 939 (100.0%) | $120,350 |
Family Income by Number of Earners in Cliffwood Beach
The median family income in Cliffwood Beach is $120,350, with families comprising 3+ earners (115) having the highest median family income of $165,341, while families with no earners (127) have the lowest median family income of $90,197, accounting for 12.2% and 13.5% of families, respectively.
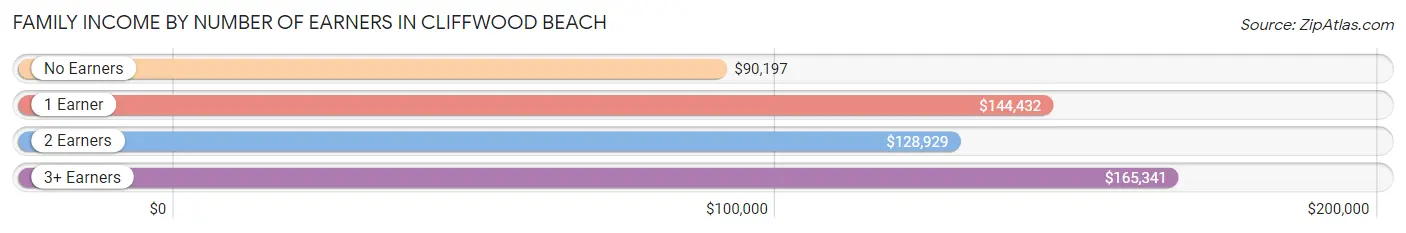
| Number of Earners | # Families | Median Income |
| No Earners | 127 (13.5%) | $90,197 |
| 1 Earner | 215 (22.9%) | $144,432 |
| 2 Earners | 482 (51.3%) | $128,929 |
| 3+ Earners | 115 (12.2%) | $165,341 |
| Total | 939 (100.0%) | $120,350 |
Household Income in Cliffwood Beach
Household Income Brackets in Cliffwood Beach
With 344 households falling in the category, the $100,000 to $149,999 income range is the most frequent in Cliffwood Beach, accounting for 27.4% of all households.
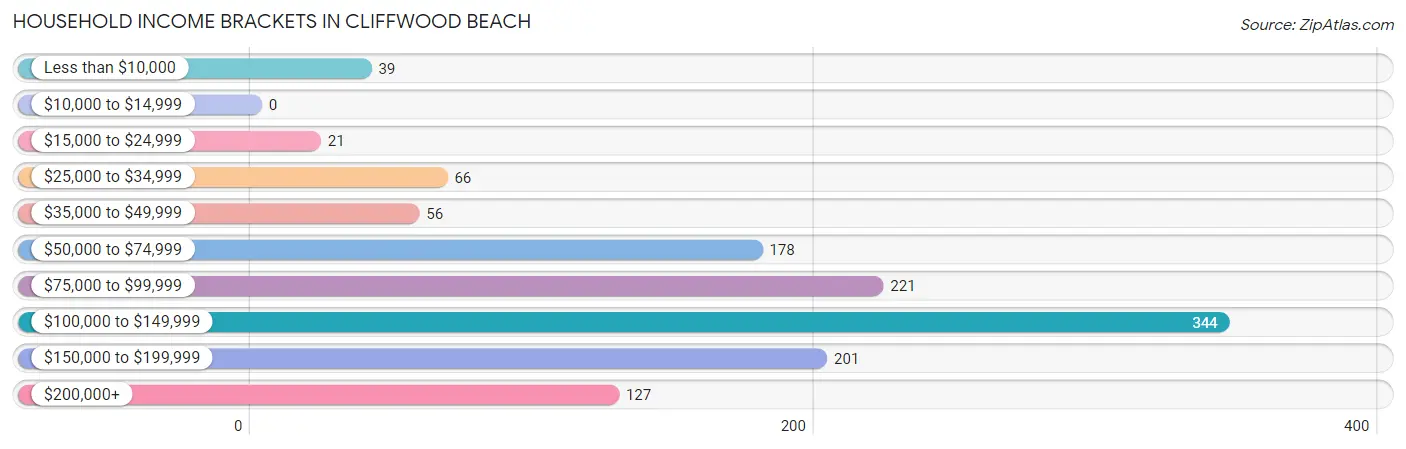
| Income Bracket | # Households | % Households |
| Less than $10,000 | 39 | 3.1% |
| $10,000 to $14,999 | 0 | 0.0% |
| $15,000 to $24,999 | 21 | 1.7% |
| $25,000 to $34,999 | 66 | 5.3% |
| $35,000 to $49,999 | 56 | 4.5% |
| $50,000 to $74,999 | 178 | 14.2% |
| $75,000 to $99,999 | 221 | 17.6% |
| $100,000 to $149,999 | 344 | 27.4% |
| $150,000 to $199,999 | 201 | 16.0% |
| $200,000+ | 127 | 10.1% |
Household Income by Householder Age in Cliffwood Beach
The median household income in Cliffwood Beach is $111,786, with the highest median household income of $130,013 found in the 45 to 64 years age bracket for the primary householder. A total of 539 households (43.0%) fall into this category. Meanwhile, the 15 to 24 years age bracket for the primary householder has the lowest median household income of $0, with 39 households (3.1%) in this group.
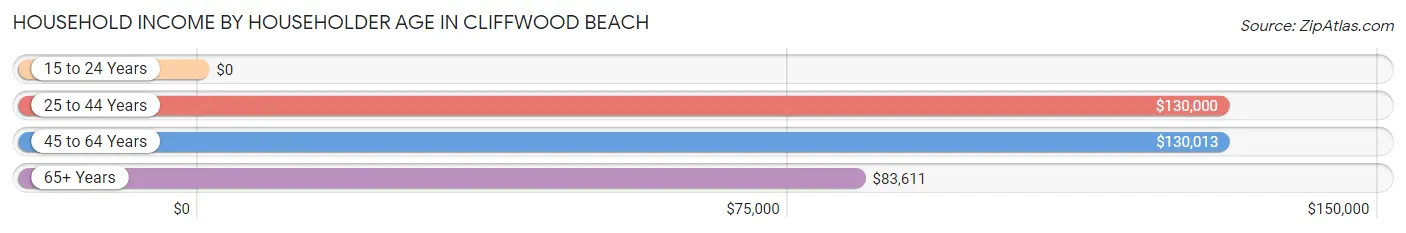
| Income Bracket | # Households | Median Income |
| 15 to 24 Years | 39 (3.1%) | $0 |
| 25 to 44 Years | 376 (30.0%) | $130,000 |
| 45 to 64 Years | 539 (43.0%) | $130,013 |
| 65+ Years | 300 (23.9%) | $83,611 |
| Total | 1,254 (100.0%) | $111,786 |
Poverty in Cliffwood Beach
Income Below Poverty by Sex and Age in Cliffwood Beach
With 2.6% poverty level for males and 0.7% for females among the residents of Cliffwood Beach, 75 year old and over males and 55 to 64 year old females are the most vulnerable to poverty, with 9 males (8.6%) and 10 females (3.9%) in their respective age groups living below the poverty level.
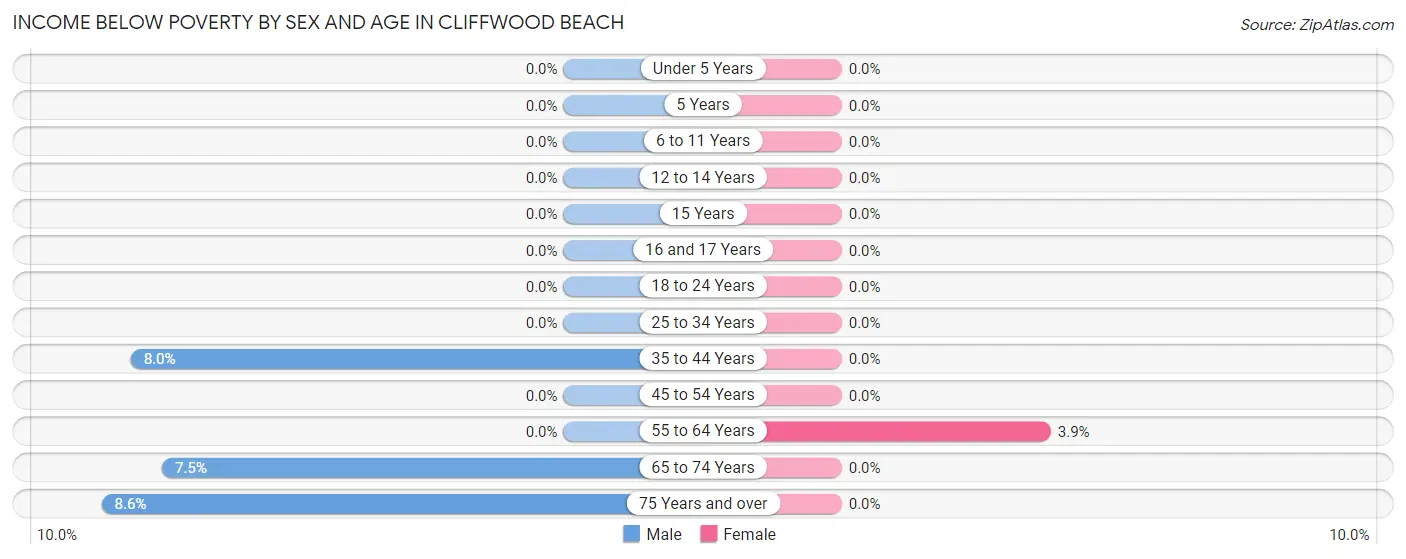
| Age Bracket | Male | Female |
| Under 5 Years | 0 (0.0%) | 0 (0.0%) |
| 5 Years | 0 (0.0%) | 0 (0.0%) |
| 6 to 11 Years | 0 (0.0%) | 0 (0.0%) |
| 12 to 14 Years | 0 (0.0%) | 0 (0.0%) |
| 15 Years | 0 (0.0%) | 0 (0.0%) |
| 16 and 17 Years | 0 (0.0%) | 0 (0.0%) |
| 18 to 24 Years | 0 (0.0%) | 0 (0.0%) |
| 25 to 34 Years | 0 (0.0%) | 0 (0.0%) |
| 35 to 44 Years | 20 (8.0%) | 0 (0.0%) |
| 45 to 54 Years | 0 (0.0%) | 0 (0.0%) |
| 55 to 64 Years | 0 (0.0%) | 10 (3.9%) |
| 65 to 74 Years | 12 (7.4%) | 0 (0.0%) |
| 75 Years and over | 9 (8.6%) | 0 (0.0%) |
| Total | 41 (2.6%) | 10 (0.7%) |
Income Above Poverty by Sex and Age in Cliffwood Beach
According to the poverty statistics in Cliffwood Beach, males aged under 5 years and females aged under 5 years are the age groups that are most secure financially, with 100.0% of males and 100.0% of females in these age groups living above the poverty line.
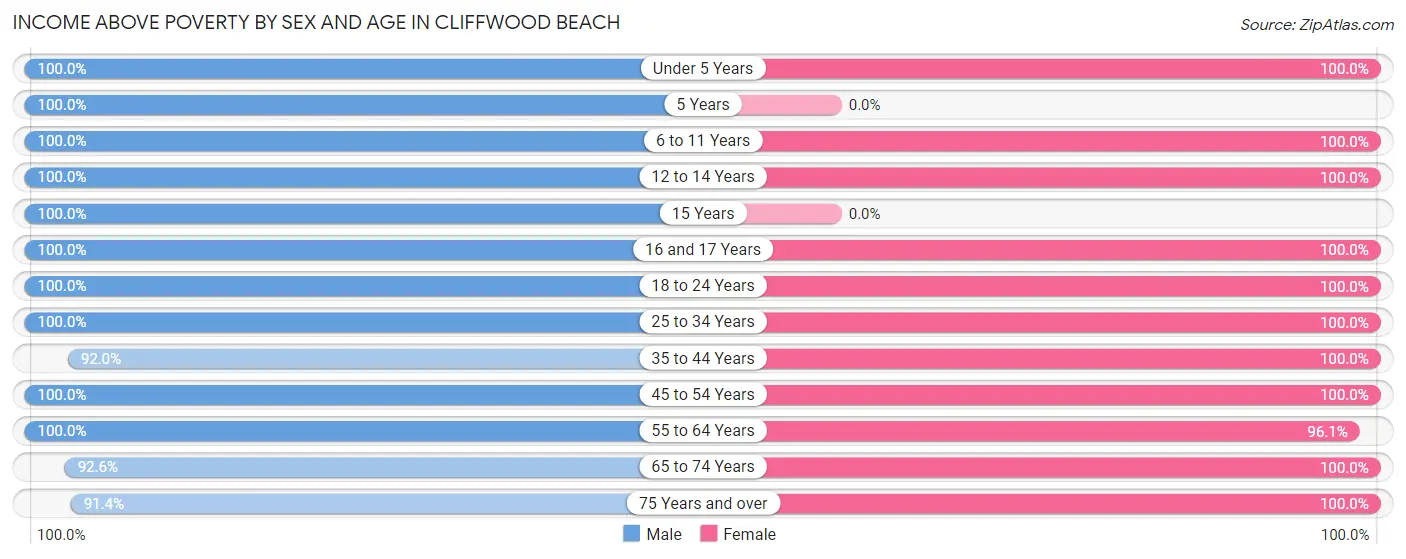
| Age Bracket | Male | Female |
| Under 5 Years | 65 (100.0%) | 39 (100.0%) |
| 5 Years | 20 (100.0%) | 0 (0.0%) |
| 6 to 11 Years | 91 (100.0%) | 63 (100.0%) |
| 12 to 14 Years | 20 (100.0%) | 65 (100.0%) |
| 15 Years | 39 (100.0%) | 0 (0.0%) |
| 16 and 17 Years | 10 (100.0%) | 27 (100.0%) |
| 18 to 24 Years | 76 (100.0%) | 34 (100.0%) |
| 25 to 34 Years | 247 (100.0%) | 161 (100.0%) |
| 35 to 44 Years | 229 (92.0%) | 322 (100.0%) |
| 45 to 54 Years | 195 (100.0%) | 189 (100.0%) |
| 55 to 64 Years | 320 (100.0%) | 248 (96.1%) |
| 65 to 74 Years | 149 (92.5%) | 164 (100.0%) |
| 75 Years and over | 96 (91.4%) | 88 (100.0%) |
| Total | 1,557 (97.4%) | 1,400 (99.3%) |
Income Below Poverty Among Married-Couple Families in Cliffwood Beach
The poverty statistics for married-couple families in Cliffwood Beach show that 1.4% or 10 of the total 738 families live below the poverty line. Families with no children have the highest poverty rate of 1.8%, comprising of 10 families. On the other hand, families with 1 or 2 children have the lowest poverty rate of 0.0%, which includes 0 families.
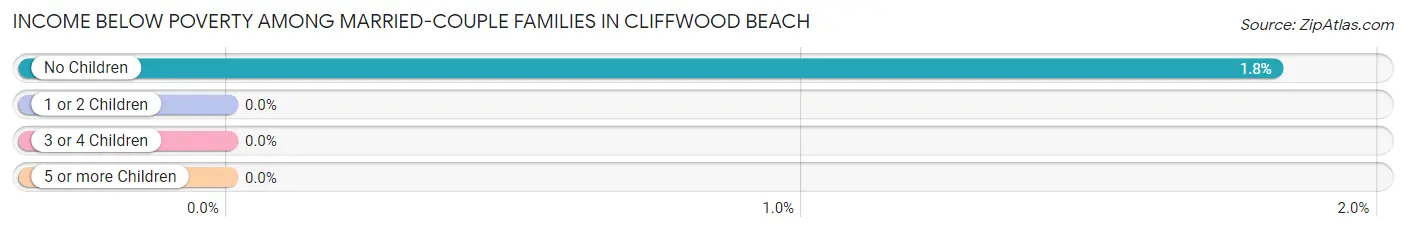
| Children | Above Poverty | Below Poverty |
| No Children | 540 (98.2%) | 10 (1.8%) |
| 1 or 2 Children | 166 (100.0%) | 0 (0.0%) |
| 3 or 4 Children | 22 (100.0%) | 0 (0.0%) |
| 5 or more Children | 0 (0.0%) | 0 (0.0%) |
| Total | 728 (98.6%) | 10 (1.4%) |
Income Below Poverty Among Single-Parent Households in Cliffwood Beach
| Children | Single Father | Single Mother |
| No Children | 0 (0.0%) | 0 (0.0%) |
| 1 or 2 Children | 0 (0.0%) | 0 (0.0%) |
| 3 or 4 Children | 0 (0.0%) | 0 (0.0%) |
| 5 or more Children | 0 (0.0%) | 0 (0.0%) |
| Total | 0 (0.0%) | 0 (0.0%) |
Income Below Poverty Among Married-Couple vs Single-Parent Households in Cliffwood Beach
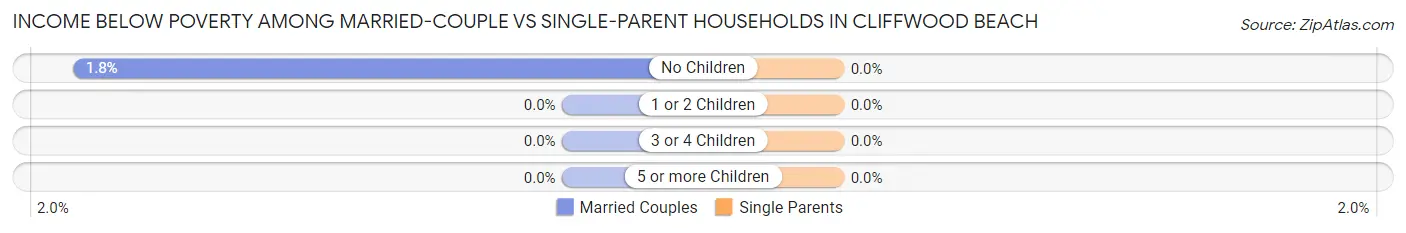
| Children | Married-Couple Families | Single-Parent Households |
| No Children | 10 (1.8%) | 0 (0.0%) |
| 1 or 2 Children | 0 (0.0%) | 0 (0.0%) |
| 3 or 4 Children | 0 (0.0%) | 0 (0.0%) |
| 5 or more Children | 0 (0.0%) | 0 (0.0%) |
| Total | 10 (1.4%) | 0 (0.0%) |
Race in Cliffwood Beach
The most populous races in Cliffwood Beach are White / Caucasian (1,928 | 64.1%), Hispanic or Latino (619 | 20.6%), and Black / African American (538 | 17.9%).
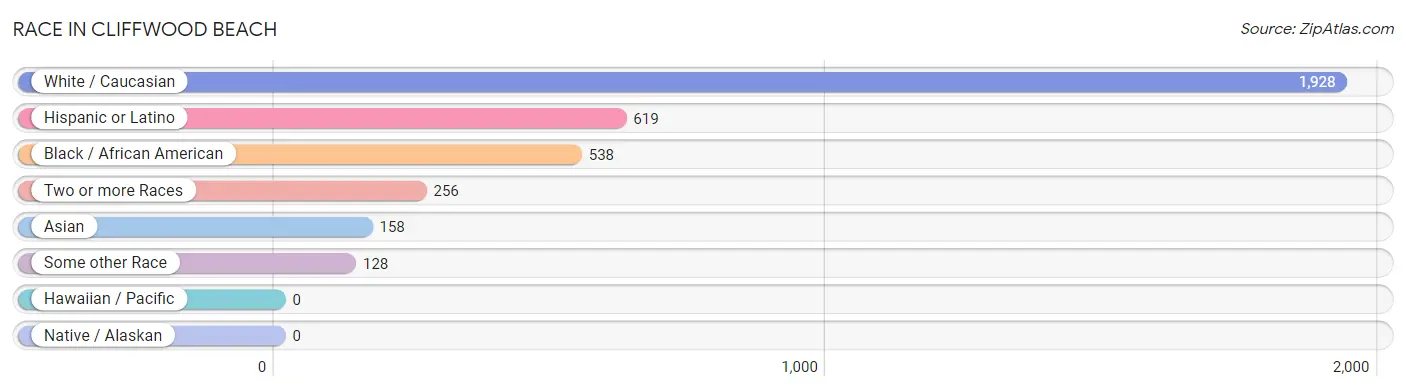
| Race | # Population | % Population |
| Asian | 158 | 5.2% |
| Black / African American | 538 | 17.9% |
| Hawaiian / Pacific | 0 | 0.0% |
| Hispanic or Latino | 619 | 20.6% |
| Native / Alaskan | 0 | 0.0% |
| White / Caucasian | 1,928 | 64.1% |
| Two or more Races | 256 | 8.5% |
| Some other Race | 128 | 4.3% |
| Total | 3,008 | 100.0% |
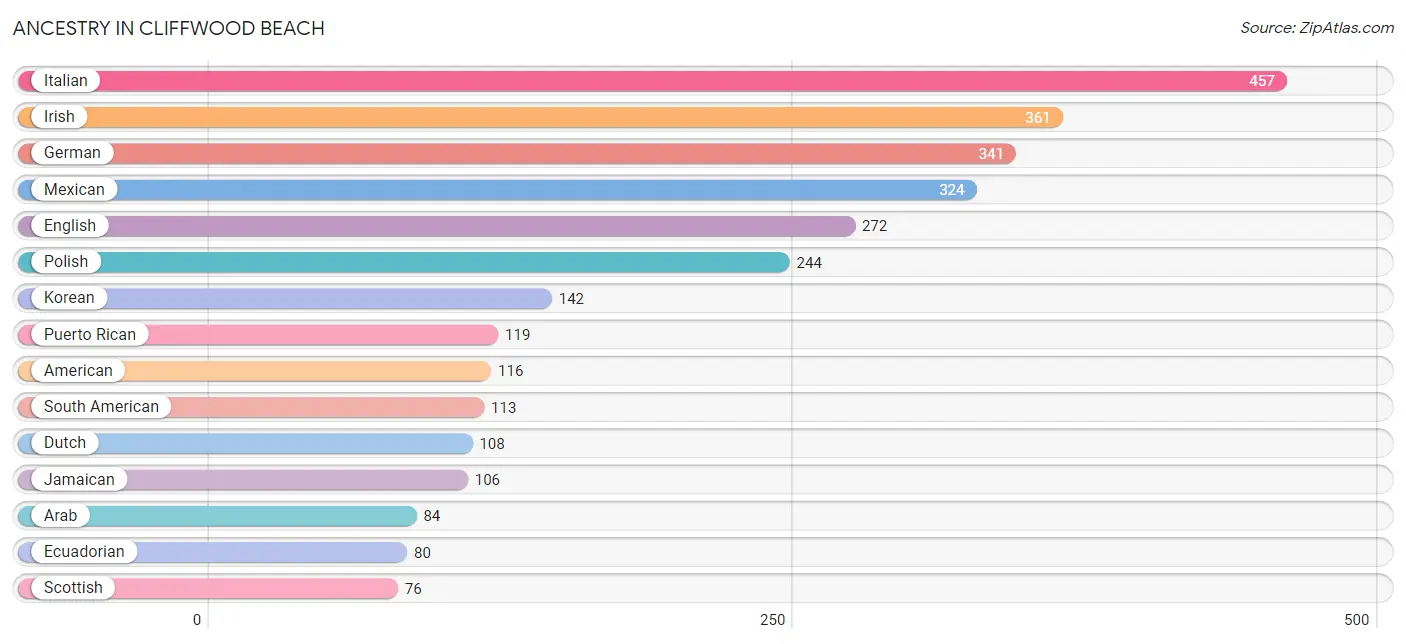
Ancestry in Cliffwood Beach
The most populous ancestries reported in Cliffwood Beach are Italian (457 | 15.2%), Irish (361 | 12.0%), German (341 | 11.3%), Mexican (324 | 10.8%), and English (272 | 9.0%), together accounting for 58.3% of all Cliffwood Beach residents.
| Ancestry | # Population | % Population |
| American | 116 | 3.9% |
| Arab | 84 | 2.8% |
| Belgian | 23 | 0.8% |
| British | 21 | 0.7% |
| Burmese | 6 | 0.2% |
| Central American | 38 | 1.3% |
| Cherokee | 5 | 0.2% |
| Colombian | 33 | 1.1% |
| Cuban | 6 | 0.2% |
| Danish | 18 | 0.6% |
| Delaware | 5 | 0.2% |
| Dutch | 108 | 3.6% |
| Eastern European | 7 | 0.2% |
| Ecuadorian | 80 | 2.7% |
| Egyptian | 28 | 0.9% |
| English | 272 | 9.0% |
| French Canadian | 13 | 0.4% |
| German | 341 | 11.3% |
| Greek | 22 | 0.7% |
| Guyanese | 17 | 0.6% |
| Hungarian | 26 | 0.9% |
| Indian (Asian) | 18 | 0.6% |
| Irish | 361 | 12.0% |
| Italian | 457 | 15.2% |
| Jamaican | 106 | 3.5% |
| Korean | 142 | 4.7% |
| Lebanese | 46 | 1.5% |
| Maltese | 5 | 0.2% |
| Mexican | 324 | 10.8% |
| Panamanian | 38 | 1.3% |
| Polish | 244 | 8.1% |
| Portuguese | 30 | 1.0% |
| Puerto Rican | 119 | 4.0% |
| Russian | 19 | 0.6% |
| Scotch-Irish | 38 | 1.3% |
| Scottish | 76 | 2.5% |
| Sierra Leonean | 8 | 0.3% |
| Slovak | 59 | 2.0% |
| South American | 113 | 3.8% |
| Spaniard | 19 | 0.6% |
| Subsaharan African | 8 | 0.3% |
| Swedish | 13 | 0.4% |
| Syrian | 10 | 0.3% |
| Thai | 25 | 0.8% |
| Ukrainian | 51 | 1.7% |
| Welsh | 16 | 0.5% | View All 46 Rows |
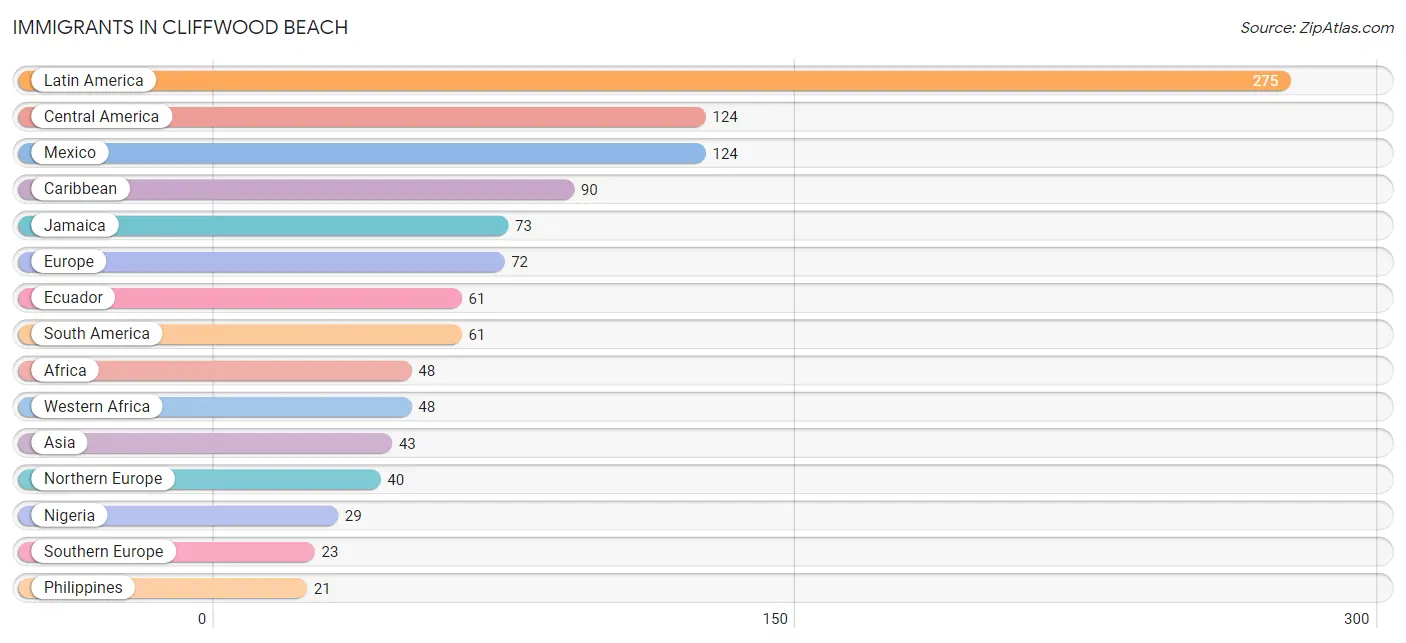
Immigrants in Cliffwood Beach
The most numerous immigrant groups reported in Cliffwood Beach came from Latin America (275 | 9.1%), Central America (124 | 4.1%), Mexico (124 | 4.1%), Caribbean (90 | 3.0%), and Jamaica (73 | 2.4%), together accounting for 22.8% of all Cliffwood Beach residents.
| Immigration Origin | # Population | % Population |
| Africa | 48 | 1.6% |
| Asia | 43 | 1.4% |
| Caribbean | 90 | 3.0% |
| Central America | 124 | 4.1% |
| Cuba | 6 | 0.2% |
| Dominican Republic | 11 | 0.4% |
| Eastern Asia | 6 | 0.2% |
| Eastern Europe | 9 | 0.3% |
| Ecuador | 61 | 2.0% |
| Europe | 72 | 2.4% |
| Greece | 16 | 0.5% |
| Jamaica | 73 | 2.4% |
| Korea | 6 | 0.2% |
| Latin America | 275 | 9.1% |
| Mexico | 124 | 4.1% |
| Nigeria | 29 | 1.0% |
| Northern Europe | 40 | 1.3% |
| Pakistan | 16 | 0.5% |
| Philippines | 21 | 0.7% |
| Poland | 9 | 0.3% |
| Portugal | 7 | 0.2% |
| Sierra Leone | 19 | 0.6% |
| South America | 61 | 2.0% |
| South Central Asia | 16 | 0.5% |
| South Eastern Asia | 21 | 0.7% |
| Southern Europe | 23 | 0.8% |
| Western Africa | 48 | 1.6% | View All 27 Rows |
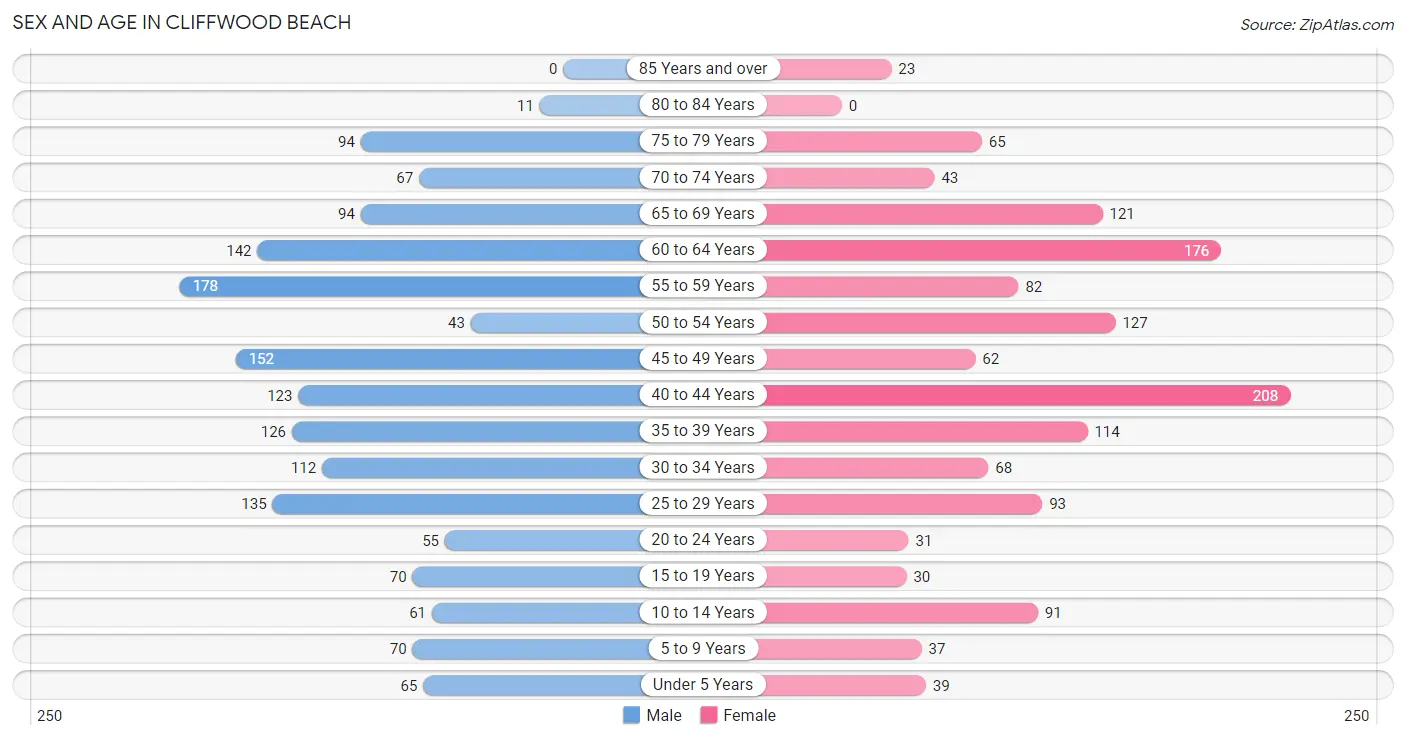
Sex and Age in Cliffwood Beach
Sex and Age in Cliffwood Beach
The most populous age groups in Cliffwood Beach are 55 to 59 Years (178 | 11.1%) for men and 40 to 44 Years (208 | 14.7%) for women.
| Age Bracket | Male | Female |
| Under 5 Years | 65 (4.1%) | 39 (2.8%) |
| 5 to 9 Years | 70 (4.4%) | 37 (2.6%) |
| 10 to 14 Years | 61 (3.8%) | 91 (6.5%) |
| 15 to 19 Years | 70 (4.4%) | 30 (2.1%) |
| 20 to 24 Years | 55 (3.4%) | 31 (2.2%) |
| 25 to 29 Years | 135 (8.5%) | 93 (6.6%) |
| 30 to 34 Years | 112 (7.0%) | 68 (4.8%) |
| 35 to 39 Years | 126 (7.9%) | 114 (8.1%) |
| 40 to 44 Years | 123 (7.7%) | 208 (14.7%) |
| 45 to 49 Years | 152 (9.5%) | 62 (4.4%) |
| 50 to 54 Years | 43 (2.7%) | 127 (9.0%) |
| 55 to 59 Years | 178 (11.1%) | 82 (5.8%) |
| 60 to 64 Years | 142 (8.9%) | 176 (12.5%) |
| 65 to 69 Years | 94 (5.9%) | 121 (8.6%) |
| 70 to 74 Years | 67 (4.2%) | 43 (3.0%) |
| 75 to 79 Years | 94 (5.9%) | 65 (4.6%) |
| 80 to 84 Years | 11 (0.7%) | 0 (0.0%) |
| 85 Years and over | 0 (0.0%) | 23 (1.6%) |
| Total | 1,598 (100.0%) | 1,410 (100.0%) |
Families and Households in Cliffwood Beach
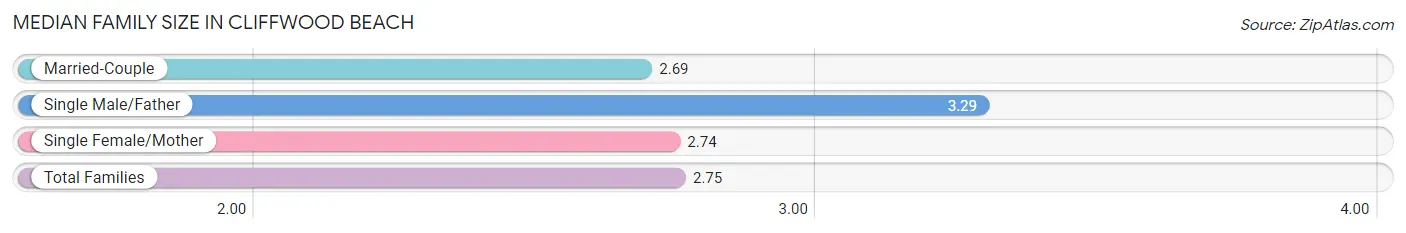
Median Family Size in Cliffwood Beach
The median family size in Cliffwood Beach is 2.75 persons per family, with single male/father families (79 | 8.4%) accounting for the largest median family size of 3.29 persons per family. On the other hand, married-couple families (738 | 78.6%) represent the smallest median family size with 2.69 persons per family.
| Family Type | # Families | Family Size |
| Married-Couple | 738 (78.6%) | 2.69 |
| Single Male/Father | 79 (8.4%) | 3.29 |
| Single Female/Mother | 122 (13.0%) | 2.74 |
| Total Families | 939 (100.0%) | 2.75 |
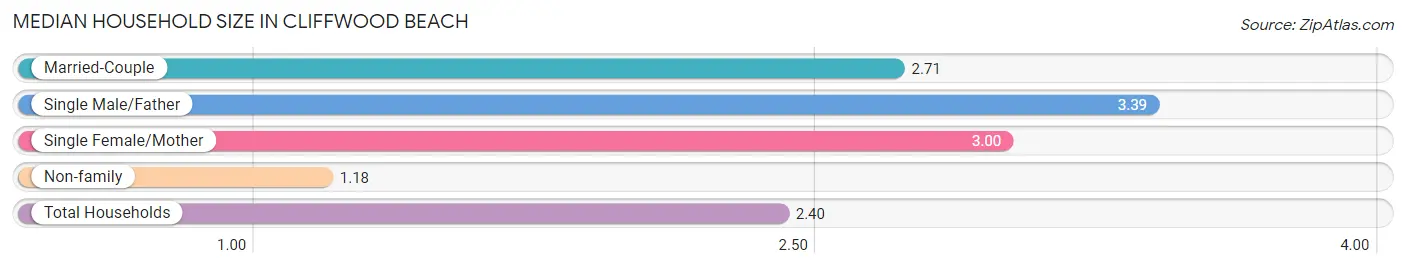
Median Household Size in Cliffwood Beach
The median household size in Cliffwood Beach is 2.40 persons per household, with single male/father households (79 | 6.3%) accounting for the largest median household size of 3.39 persons per household. non-family households (315 | 25.1%) represent the smallest median household size with 1.18 persons per household.
| Household Type | # Households | Household Size |
| Married-Couple | 738 (58.9%) | 2.71 |
| Single Male/Father | 79 (6.3%) | 3.39 |
| Single Female/Mother | 122 (9.7%) | 3.00 |
| Non-family | 315 (25.1%) | 1.18 |
| Total Households | 1,254 (100.0%) | 2.40 |
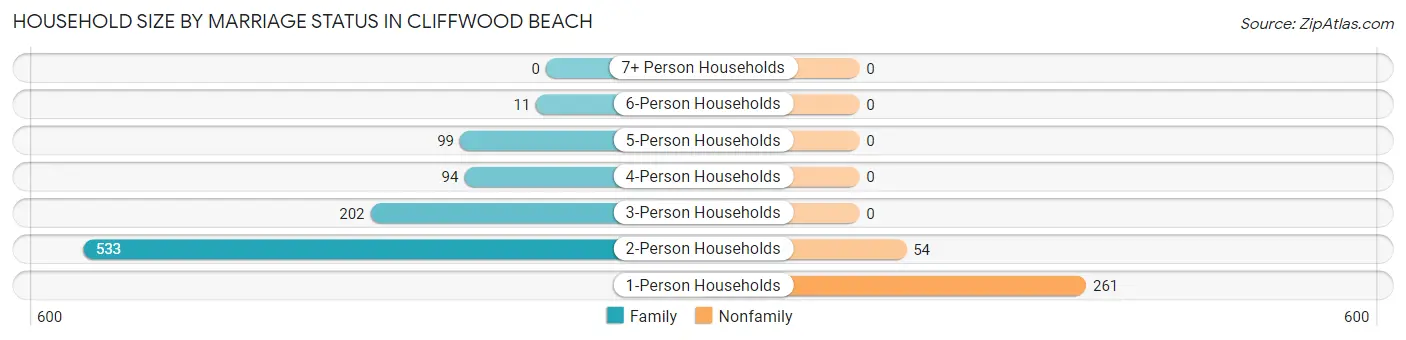
Household Size by Marriage Status in Cliffwood Beach
Out of a total of 1,254 households in Cliffwood Beach, 939 (74.9%) are family households, while 315 (25.1%) are nonfamily households. The most numerous type of family households are 2-person households, comprising 533, and the most common type of nonfamily households are 1-person households, comprising 261.
| Household Size | Family Households | Nonfamily Households |
| 1-Person Households | - | 261 (20.8%) |
| 2-Person Households | 533 (42.5%) | 54 (4.3%) |
| 3-Person Households | 202 (16.1%) | 0 (0.0%) |
| 4-Person Households | 94 (7.5%) | 0 (0.0%) |
| 5-Person Households | 99 (7.9%) | 0 (0.0%) |
| 6-Person Households | 11 (0.9%) | 0 (0.0%) |
| 7+ Person Households | 0 (0.0%) | 0 (0.0%) |
| Total | 939 (74.9%) | 315 (25.1%) |
Female Fertility in Cliffwood Beach
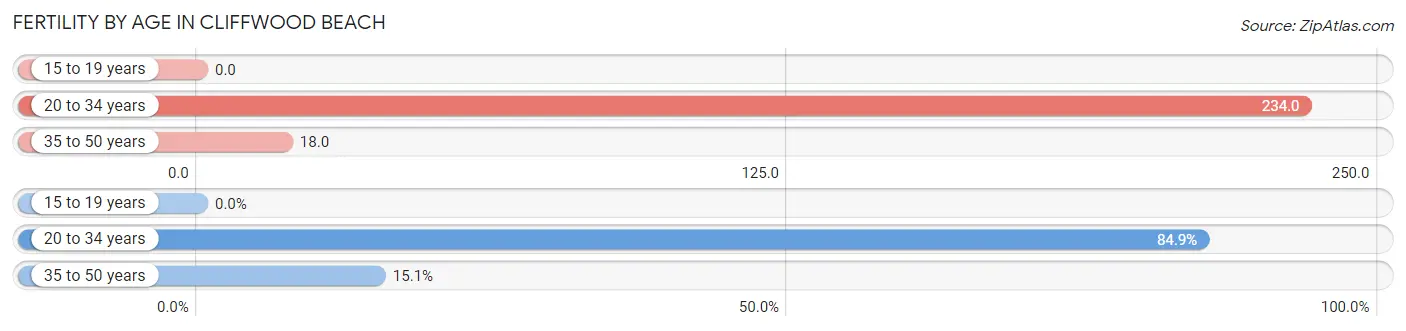
Fertility by Age in Cliffwood Beach
Average fertility rate in Cliffwood Beach is 80.0 births per 1,000 women. Women in the age bracket of 20 to 34 years have the highest fertility rate with 234.0 births per 1,000 women. Women in the age bracket of 20 to 34 years acount for 84.9% of all women with births.
| Age Bracket | Women with Births | Births / 1,000 Women |
| 15 to 19 years | 0 (0.0%) | 0.0 |
| 20 to 34 years | 45 (84.9%) | 234.0 |
| 35 to 50 years | 8 (15.1%) | 18.0 |
| Total | 53 (100.0%) | 80.0 |
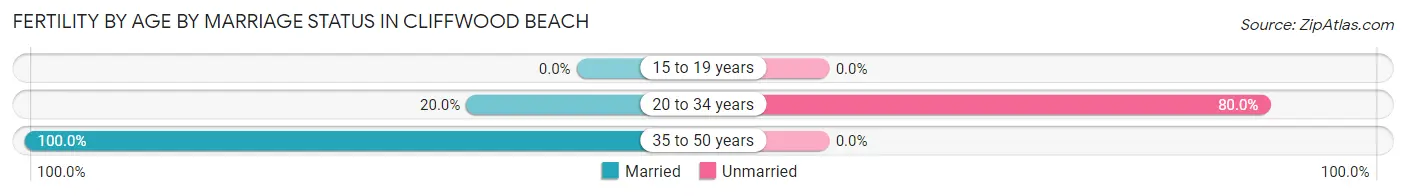
Fertility by Age by Marriage Status in Cliffwood Beach
32.1% of women with births (53) in Cliffwood Beach are married. The highest percentage of unmarried women with births falls into 20 to 34 years age bracket with 80.0% of them unmarried at the time of birth, while the lowest percentage of unmarried women with births belong to 35 to 50 years age bracket with 0.0% of them unmarried.
| Age Bracket | Married | Unmarried |
| 15 to 19 years | 0 (0.0%) | 0 (0.0%) |
| 20 to 34 years | 9 (20.0%) | 36 (80.0%) |
| 35 to 50 years | 8 (100.0%) | 0 (0.0%) |
| Total | 17 (32.1%) | 36 (67.9%) |
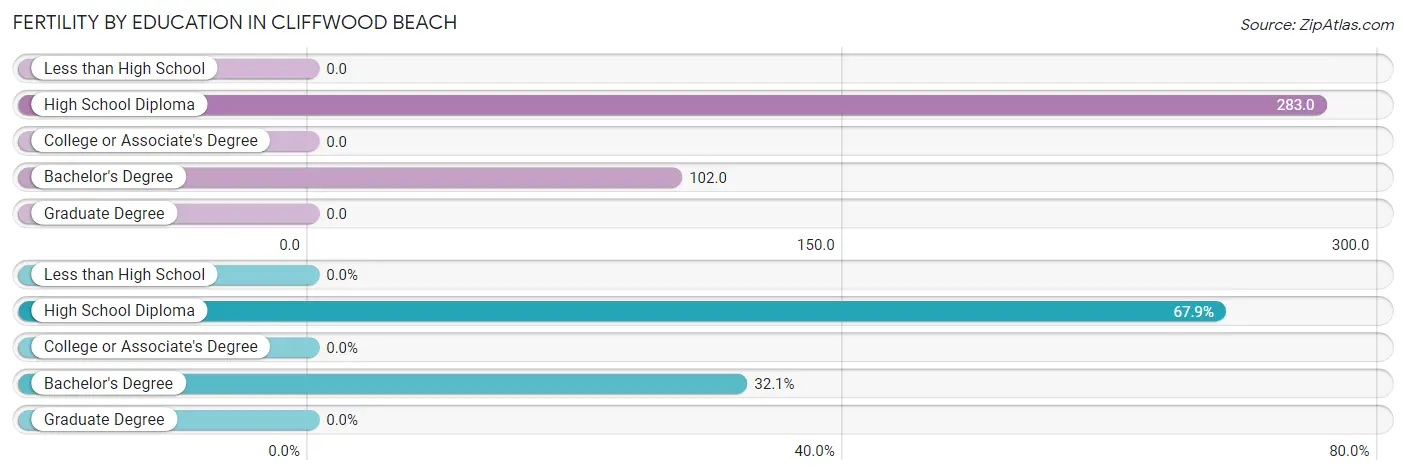
Fertility by Education in Cliffwood Beach
| Educational Attainment | Women with Births | Births / 1,000 Women |
| Less than High School | 0 (0.0%) | 0.0 |
| High School Diploma | 36 (67.9%) | 283.0 |
| College or Associate's Degree | 0 (0.0%) | 0.0 |
| Bachelor's Degree | 17 (32.1%) | 102.0 |
| Graduate Degree | 0 (0.0%) | 0.0 |
| Total | 53 (100.0%) | 80.0 |
Fertility by Education by Marriage Status in Cliffwood Beach
67.9% of women with births in Cliffwood Beach are unmarried. Women with the educational attainment of bachelor's degree are most likely to be married with 100.0% of them married at childbirth, while women with the educational attainment of high school diploma are least likely to be married with 100.0% of them unmarried at childbirth.
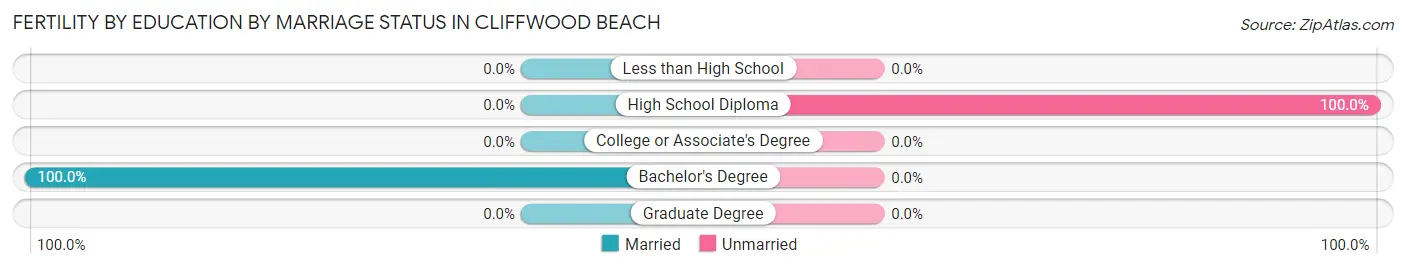
| Educational Attainment | Married | Unmarried |
| Less than High School | 0 (0.0%) | 0 (0.0%) |
| High School Diploma | 0 (0.0%) | 36 (100.0%) |
| College or Associate's Degree | 0 (0.0%) | 0 (0.0%) |
| Bachelor's Degree | 17 (100.0%) | 0 (0.0%) |
| Graduate Degree | 0 (0.0%) | 0 (0.0%) |
| Total | 17 (32.1%) | 36 (67.9%) |
Employment Characteristics in Cliffwood Beach
Employment by Class of Employer in Cliffwood Beach
Among the 1,639 employed individuals in Cliffwood Beach, private company employees (1,281 | 78.2%), local government employees (112 | 6.8%), and self-employed (incorporated) (81 | 4.9%) make up the most common classes of employment.
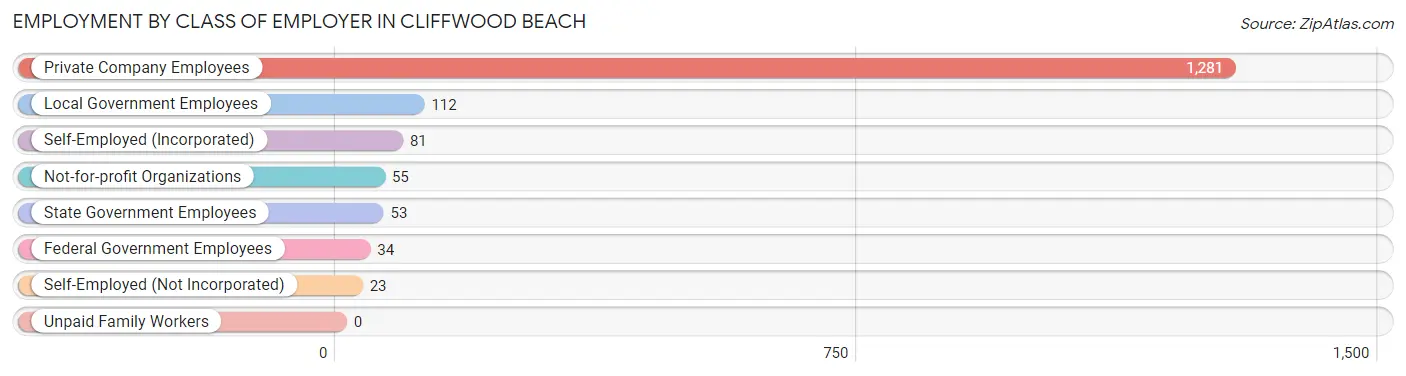
| Employer Class | # Employees | % Employees |
| Private Company Employees | 1,281 | 78.2% |
| Self-Employed (Incorporated) | 81 | 4.9% |
| Self-Employed (Not Incorporated) | 23 | 1.4% |
| Not-for-profit Organizations | 55 | 3.4% |
| Local Government Employees | 112 | 6.8% |
| State Government Employees | 53 | 3.2% |
| Federal Government Employees | 34 | 2.1% |
| Unpaid Family Workers | 0 | 0.0% |
| Total | 1,639 | 100.0% |
Employment Status by Age in Cliffwood Beach
According to the labor force statistics for Cliffwood Beach, out of the total population over 16 years of age (2,606), 66.7% or 1,738 individuals are in the labor force, with 5.1% or 89 of them unemployed. The age group with the highest labor force participation rate is 20 to 24 years, with 100.0% or 86 individuals in the labor force. Within the labor force, the 20 to 24 years age range has the highest percentage of unemployed individuals, with 45.3% or 39 of them being unemployed.
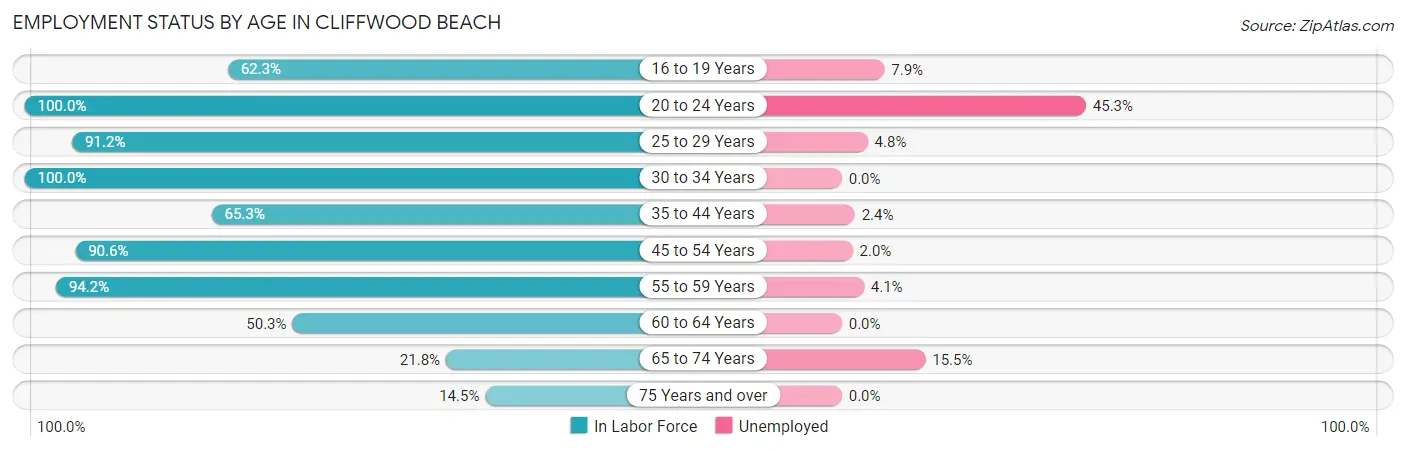
| Age Bracket | In Labor Force | Unemployed |
| 16 to 19 Years | 38 (62.3%) | 3 (7.9%) |
| 20 to 24 Years | 86 (100.0%) | 39 (45.3%) |
| 25 to 29 Years | 208 (91.2%) | 10 (4.8%) |
| 30 to 34 Years | 180 (100.0%) | 0 (0.0%) |
| 35 to 44 Years | 373 (65.3%) | 9 (2.4%) |
| 45 to 54 Years | 348 (90.6%) | 7 (2.0%) |
| 55 to 59 Years | 245 (94.2%) | 10 (4.1%) |
| 60 to 64 Years | 160 (50.3%) | 0 (0.0%) |
| 65 to 74 Years | 71 (21.8%) | 11 (15.5%) |
| 75 Years and over | 28 (14.5%) | 0 (0.0%) |
| Total | 1,738 (66.7%) | 89 (5.1%) |
Employment Status by Educational Attainment in Cliffwood Beach
According to labor force statistics for Cliffwood Beach, 78.0% of individuals (1,514) out of the total population between 25 and 64 years of age (1,941) are in the labor force, with 2.4% or 36 of them being unemployed. The group with the highest labor force participation rate are those with the educational attainment of bachelor's degree or higher, with 86.9% or 365 individuals in the labor force. Within the labor force, individuals with less than high school education have the highest percentage of unemployment, with 11.1% or 7 of them being unemployed.
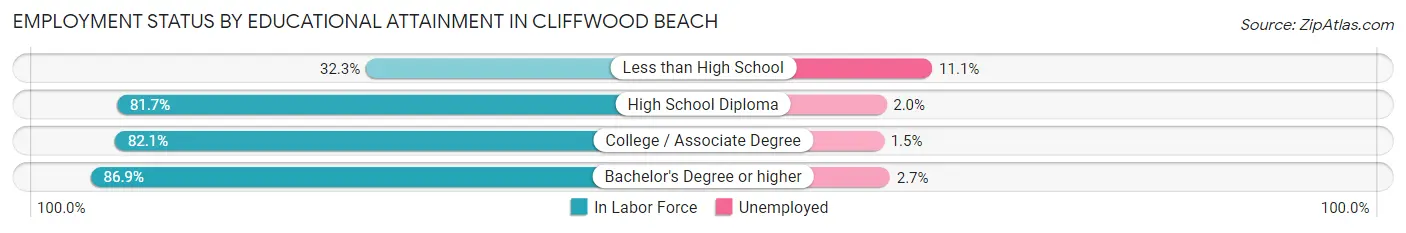
| Educational Attainment | In Labor Force | Unemployed |
| Less than High School | 63 (32.3%) | 22 (11.1%) |
| High School Diploma | 495 (81.7%) | 12 (2.0%) |
| College / Associate Degree | 591 (82.1%) | 11 (1.5%) |
| Bachelor's Degree or higher | 365 (86.9%) | 11 (2.7%) |
| Total | 1,514 (78.0%) | 47 (2.4%) |
Employment Occupations by Sex in Cliffwood Beach
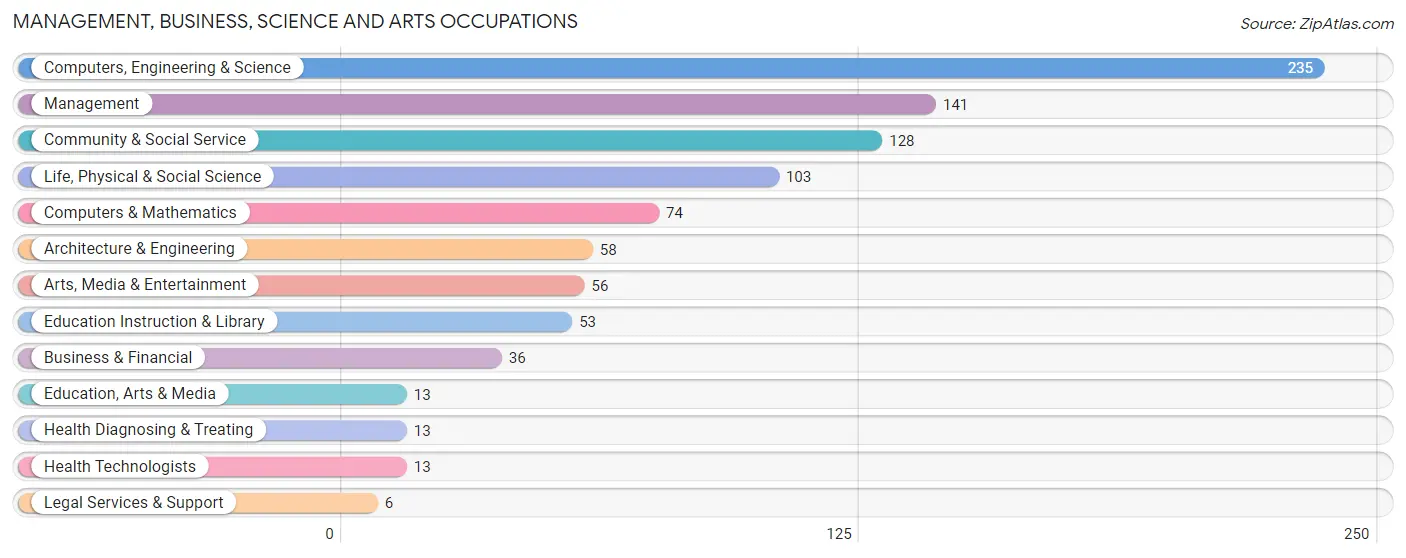
Management, Business, Science and Arts Occupations
The most common Management, Business, Science and Arts occupations in Cliffwood Beach are Computers, Engineering & Science (235 | 14.3%), Management (141 | 8.6%), Community & Social Service (128 | 7.8%), Life, Physical & Social Science (103 | 6.2%), and Computers & Mathematics (74 | 4.5%).
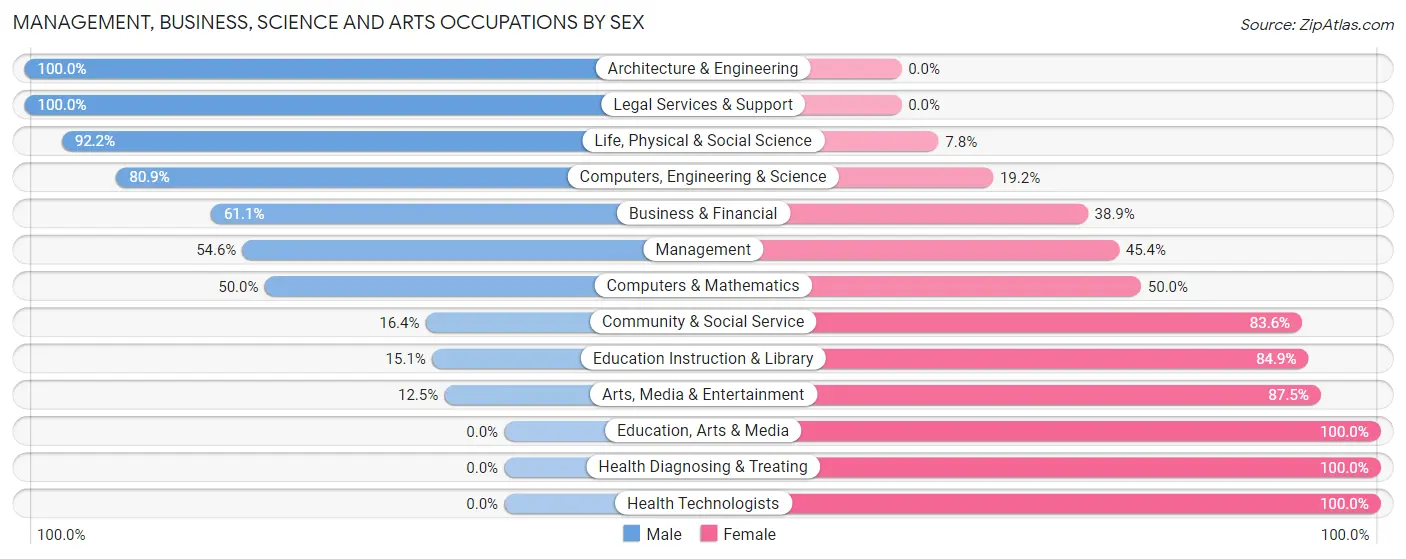
Management, Business, Science and Arts Occupations by Sex
Within the Management, Business, Science and Arts occupations in Cliffwood Beach, the most male-oriented occupations are Architecture & Engineering (100.0%), Legal Services & Support (100.0%), and Life, Physical & Social Science (92.2%), while the most female-oriented occupations are Education, Arts & Media (100.0%), Health Diagnosing & Treating (100.0%), and Health Technologists (100.0%).
| Occupation | Male | Female |
| Management | 77 (54.6%) | 64 (45.4%) |
| Business & Financial | 22 (61.1%) | 14 (38.9%) |
| Computers, Engineering & Science | 190 (80.8%) | 45 (19.2%) |
| Computers & Mathematics | 37 (50.0%) | 37 (50.0%) |
| Architecture & Engineering | 58 (100.0%) | 0 (0.0%) |
| Life, Physical & Social Science | 95 (92.2%) | 8 (7.8%) |
| Community & Social Service | 21 (16.4%) | 107 (83.6%) |
| Education, Arts & Media | 0 (0.0%) | 13 (100.0%) |
| Legal Services & Support | 6 (100.0%) | 0 (0.0%) |
| Education Instruction & Library | 8 (15.1%) | 45 (84.9%) |
| Arts, Media & Entertainment | 7 (12.5%) | 49 (87.5%) |
| Health Diagnosing & Treating | 0 (0.0%) | 13 (100.0%) |
| Health Technologists | 0 (0.0%) | 13 (100.0%) |
| Total (Category) | 310 (56.1%) | 243 (43.9%) |
| Total (Overall) | 978 (59.3%) | 670 (40.7%) |
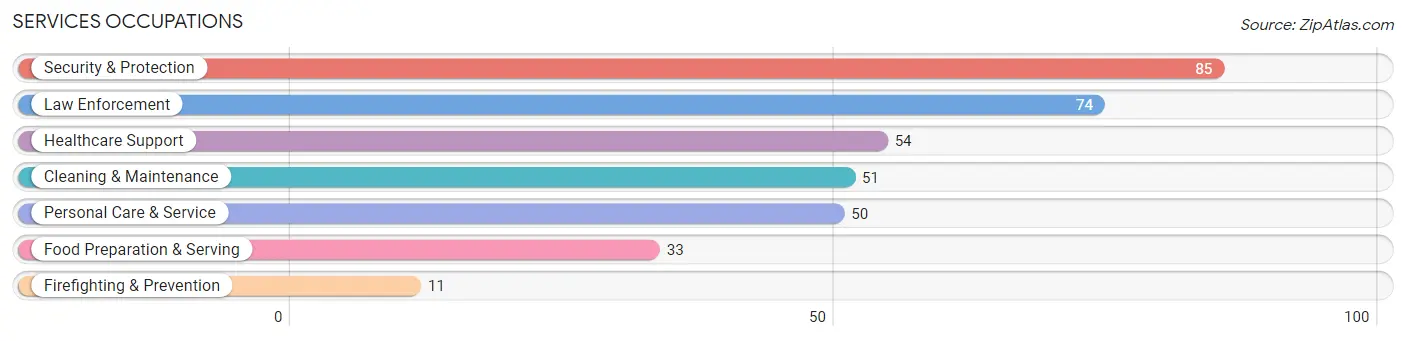
Services Occupations
The most common Services occupations in Cliffwood Beach are Security & Protection (85 | 5.2%), Law Enforcement (74 | 4.5%), Healthcare Support (54 | 3.3%), Cleaning & Maintenance (51 | 3.1%), and Personal Care & Service (50 | 3.0%).
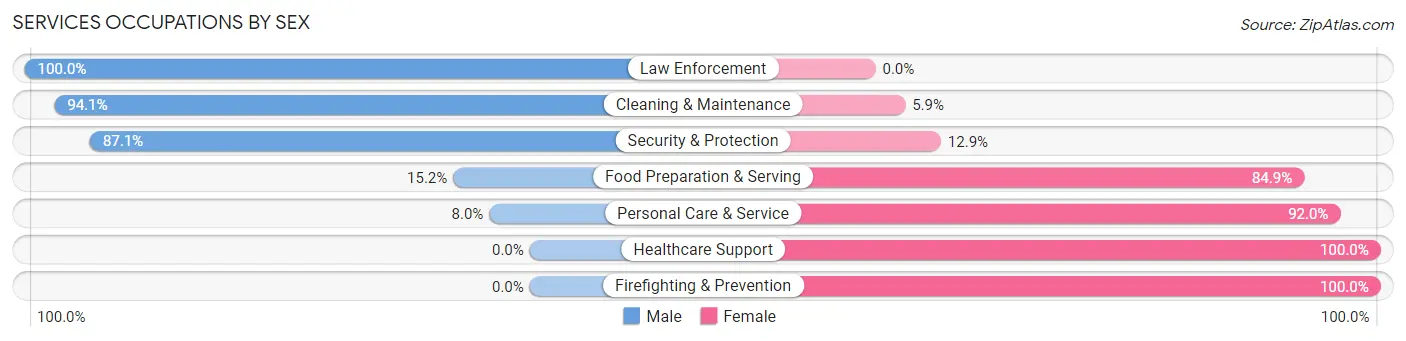
Services Occupations by Sex
Within the Services occupations in Cliffwood Beach, the most male-oriented occupations are Law Enforcement (100.0%), Cleaning & Maintenance (94.1%), and Security & Protection (87.1%), while the most female-oriented occupations are Healthcare Support (100.0%), Firefighting & Prevention (100.0%), and Personal Care & Service (92.0%).
| Occupation | Male | Female |
| Healthcare Support | 0 (0.0%) | 54 (100.0%) |
| Security & Protection | 74 (87.1%) | 11 (12.9%) |
| Firefighting & Prevention | 0 (0.0%) | 11 (100.0%) |
| Law Enforcement | 74 (100.0%) | 0 (0.0%) |
| Food Preparation & Serving | 5 (15.1%) | 28 (84.9%) |
| Cleaning & Maintenance | 48 (94.1%) | 3 (5.9%) |
| Personal Care & Service | 4 (8.0%) | 46 (92.0%) |
| Total (Category) | 131 (48.0%) | 142 (52.0%) |
| Total (Overall) | 978 (59.3%) | 670 (40.7%) |
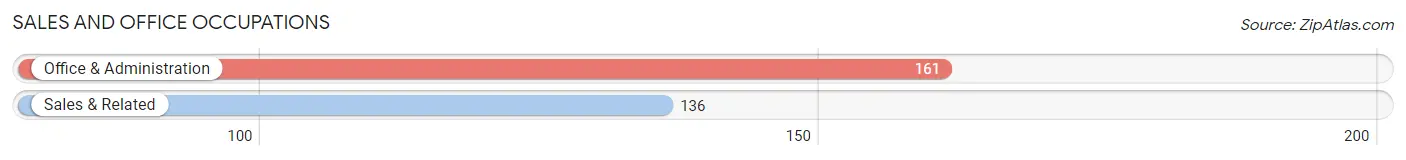
Sales and Office Occupations
The most common Sales and Office occupations in Cliffwood Beach are Office & Administration (161 | 9.8%), and Sales & Related (136 | 8.3%).
Sales and Office Occupations by Sex
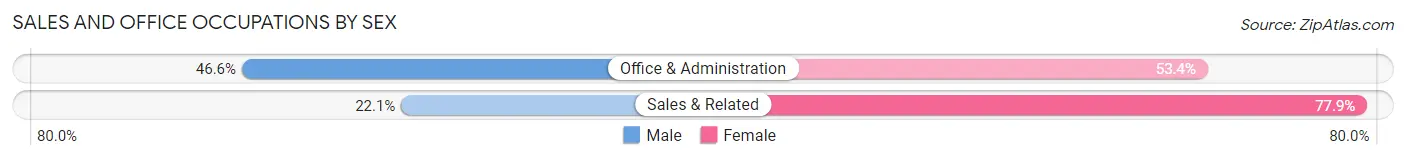
| Occupation | Male | Female |
| Sales & Related | 30 (22.1%) | 106 (77.9%) |
| Office & Administration | 75 (46.6%) | 86 (53.4%) |
| Total (Category) | 105 (35.3%) | 192 (64.6%) |
| Total (Overall) | 978 (59.3%) | 670 (40.7%) |
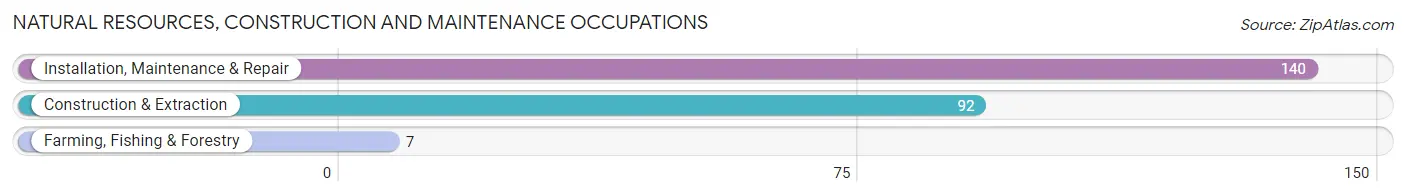
Natural Resources, Construction and Maintenance Occupations
The most common Natural Resources, Construction and Maintenance occupations in Cliffwood Beach are Installation, Maintenance & Repair (140 | 8.5%), Construction & Extraction (92 | 5.6%), and Farming, Fishing & Forestry (7 | 0.4%).
Natural Resources, Construction and Maintenance Occupations by Sex
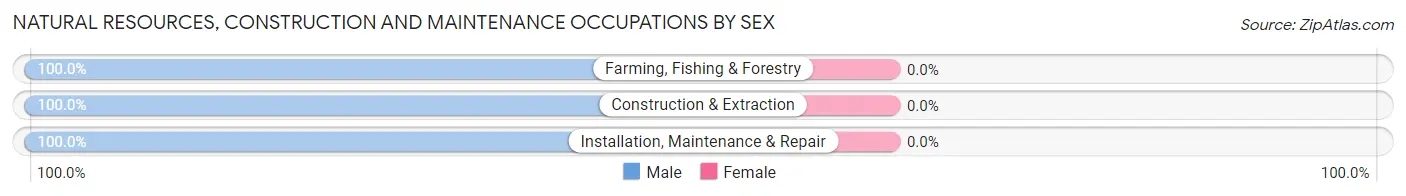
| Occupation | Male | Female |
| Farming, Fishing & Forestry | 7 (100.0%) | 0 (0.0%) |
| Construction & Extraction | 92 (100.0%) | 0 (0.0%) |
| Installation, Maintenance & Repair | 140 (100.0%) | 0 (0.0%) |
| Total (Category) | 239 (100.0%) | 0 (0.0%) |
| Total (Overall) | 978 (59.3%) | 670 (40.7%) |
Production, Transportation and Moving Occupations
The most common Production, Transportation and Moving occupations in Cliffwood Beach are Transportation (111 | 6.7%), Production (95 | 5.8%), and Material Moving (80 | 4.9%).
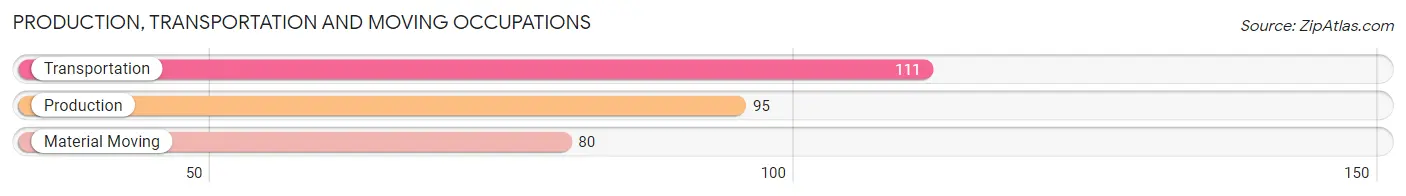
Production, Transportation and Moving Occupations by Sex
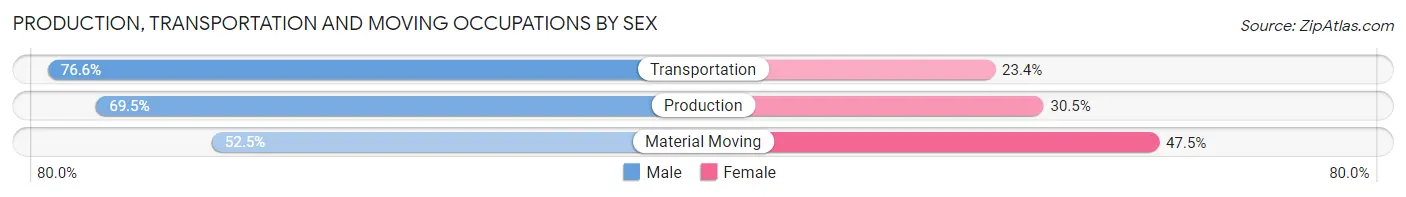
| Occupation | Male | Female |
| Production | 66 (69.5%) | 29 (30.5%) |
| Transportation | 85 (76.6%) | 26 (23.4%) |
| Material Moving | 42 (52.5%) | 38 (47.5%) |
| Total (Category) | 193 (67.5%) | 93 (32.5%) |
| Total (Overall) | 978 (59.3%) | 670 (40.7%) |
Employment Industries by Sex in Cliffwood Beach
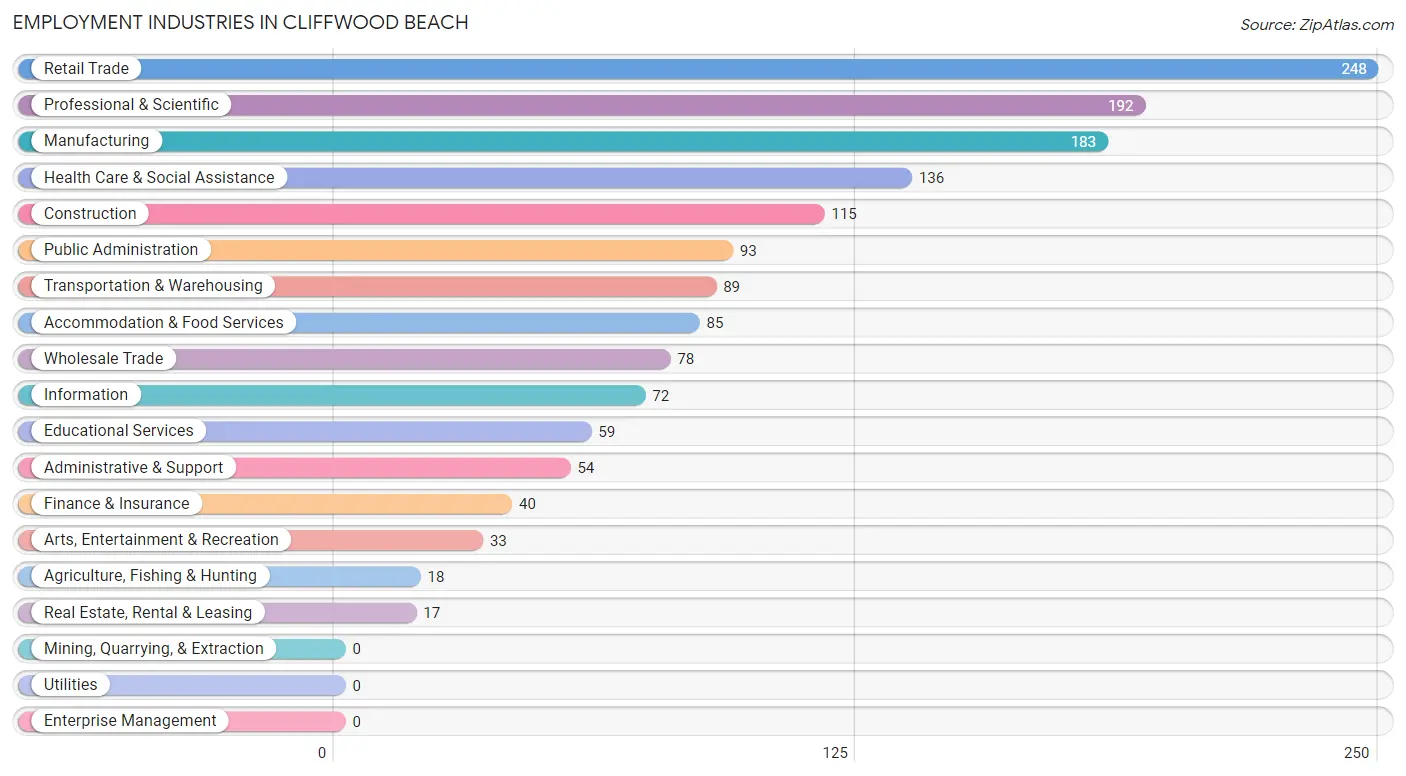
Employment Industries in Cliffwood Beach
The major employment industries in Cliffwood Beach include Retail Trade (248 | 15.0%), Professional & Scientific (192 | 11.7%), Manufacturing (183 | 11.1%), Health Care & Social Assistance (136 | 8.3%), and Construction (115 | 7.0%).
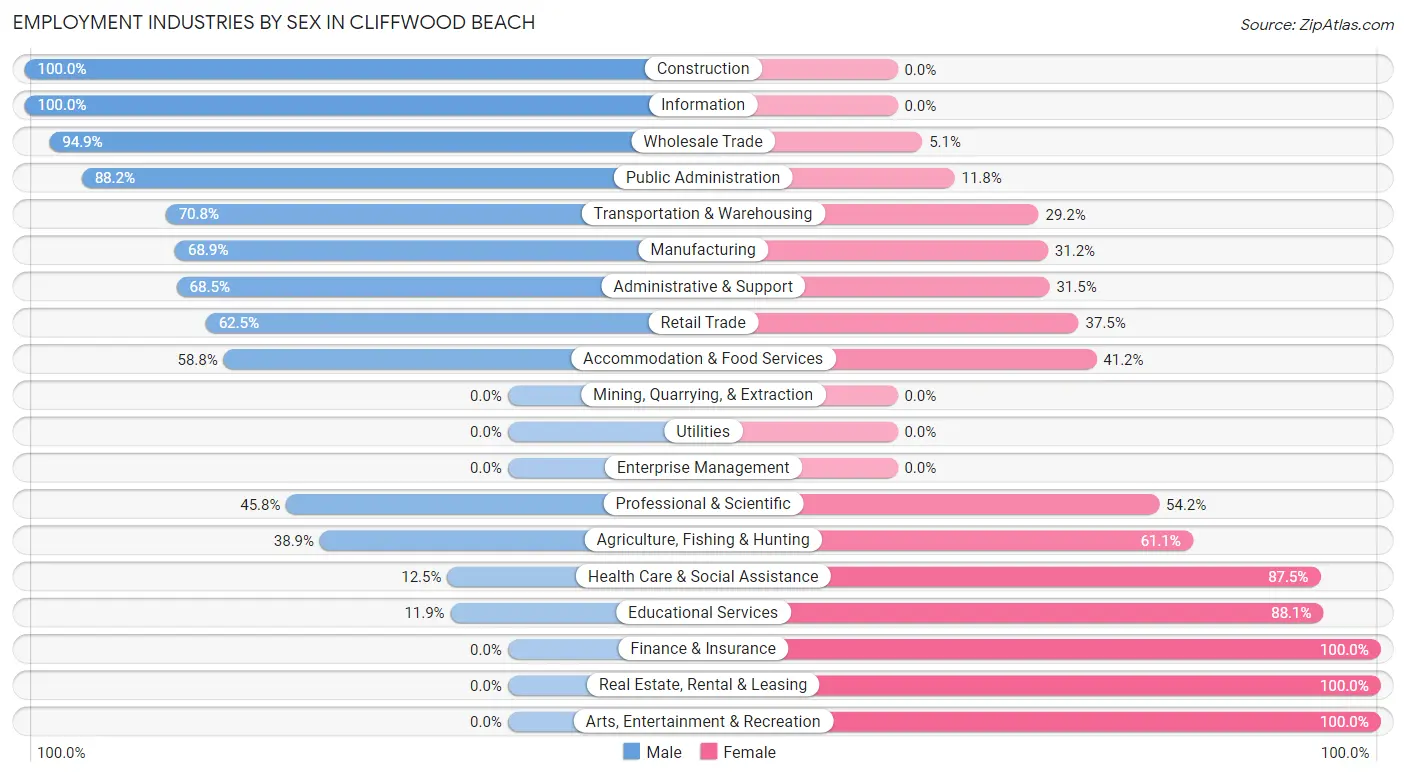
Employment Industries by Sex in Cliffwood Beach
The Cliffwood Beach industries that see more men than women are Construction (100.0%), Information (100.0%), and Wholesale Trade (94.9%), whereas the industries that tend to have a higher number of women are Finance & Insurance (100.0%), Real Estate, Rental & Leasing (100.0%), and Arts, Entertainment & Recreation (100.0%).
| Industry | Male | Female |
| Agriculture, Fishing & Hunting | 7 (38.9%) | 11 (61.1%) |
| Mining, Quarrying, & Extraction | 0 (0.0%) | 0 (0.0%) |
| Construction | 115 (100.0%) | 0 (0.0%) |
| Manufacturing | 126 (68.9%) | 57 (31.1%) |
| Wholesale Trade | 74 (94.9%) | 4 (5.1%) |
| Retail Trade | 155 (62.5%) | 93 (37.5%) |
| Transportation & Warehousing | 63 (70.8%) | 26 (29.2%) |
| Utilities | 0 (0.0%) | 0 (0.0%) |
| Information | 72 (100.0%) | 0 (0.0%) |
| Finance & Insurance | 0 (0.0%) | 40 (100.0%) |
| Real Estate, Rental & Leasing | 0 (0.0%) | 17 (100.0%) |
| Professional & Scientific | 88 (45.8%) | 104 (54.2%) |
| Enterprise Management | 0 (0.0%) | 0 (0.0%) |
| Administrative & Support | 37 (68.5%) | 17 (31.5%) |
| Educational Services | 7 (11.9%) | 52 (88.1%) |
| Health Care & Social Assistance | 17 (12.5%) | 119 (87.5%) |
| Arts, Entertainment & Recreation | 0 (0.0%) | 33 (100.0%) |
| Accommodation & Food Services | 50 (58.8%) | 35 (41.2%) |
| Public Administration | 82 (88.2%) | 11 (11.8%) |
| Total | 978 (59.3%) | 670 (40.7%) |
Education in Cliffwood Beach
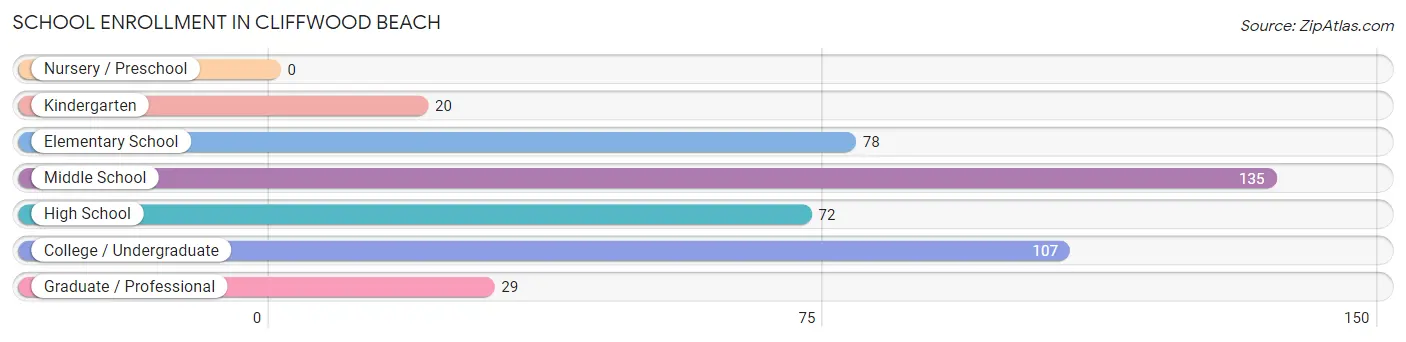
School Enrollment in Cliffwood Beach
The most common levels of schooling among the 441 students in Cliffwood Beach are middle school (135 | 30.6%), college / undergraduate (107 | 24.3%), and elementary school (78 | 17.7%).
| School Level | # Students | % Students |
| Nursery / Preschool | 0 | 0.0% |
| Kindergarten | 20 | 4.5% |
| Elementary School | 78 | 17.7% |
| Middle School | 135 | 30.6% |
| High School | 72 | 16.3% |
| College / Undergraduate | 107 | 24.3% |
| Graduate / Professional | 29 | 6.6% |
| Total | 441 | 100.0% |
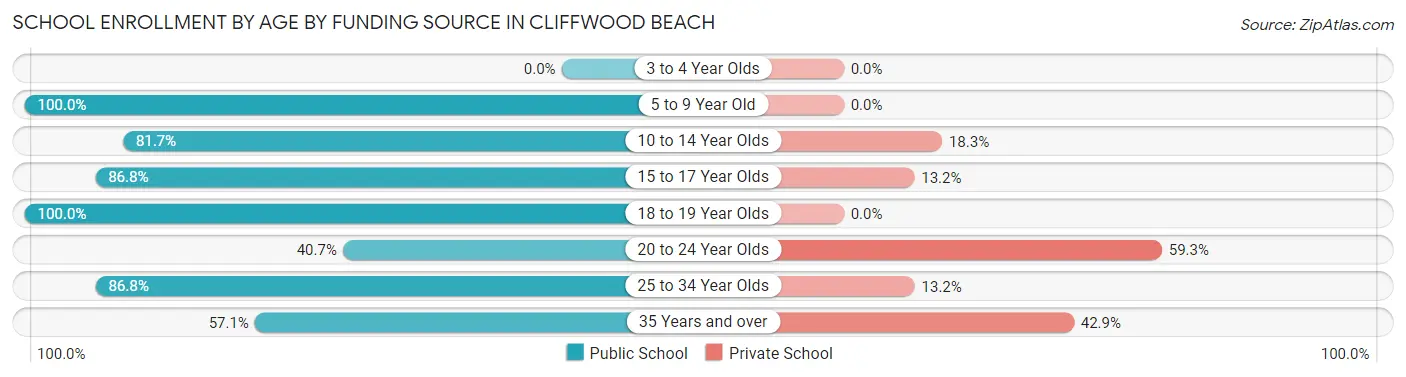
School Enrollment by Age by Funding Source in Cliffwood Beach
Out of a total of 441 students who are enrolled in schools in Cliffwood Beach, 68 (15.4%) attend a private institution, while the remaining 373 (84.6%) are enrolled in public schools. The age group of 20 to 24 year olds has the highest likelihood of being enrolled in private schools, with 16 (59.3% in the age bracket) enrolled. Conversely, the age group of 5 to 9 year old has the lowest likelihood of being enrolled in a private school, with 98 (100.0% in the age bracket) attending a public institution.
| Age Bracket | Public School | Private School |
| 3 to 4 Year Olds | 0 (0.0%) | 0 (0.0%) |
| 5 to 9 Year Old | 98 (100.0%) | 0 (0.0%) |
| 10 to 14 Year Olds | 116 (81.7%) | 26 (18.3%) |
| 15 to 17 Year Olds | 66 (86.8%) | 10 (13.2%) |
| 18 to 19 Year Olds | 24 (100.0%) | 0 (0.0%) |
| 20 to 24 Year Olds | 11 (40.7%) | 16 (59.3%) |
| 25 to 34 Year Olds | 46 (86.8%) | 7 (13.2%) |
| 35 Years and over | 12 (57.1%) | 9 (42.9%) |
| Total | 373 (84.6%) | 68 (15.4%) |
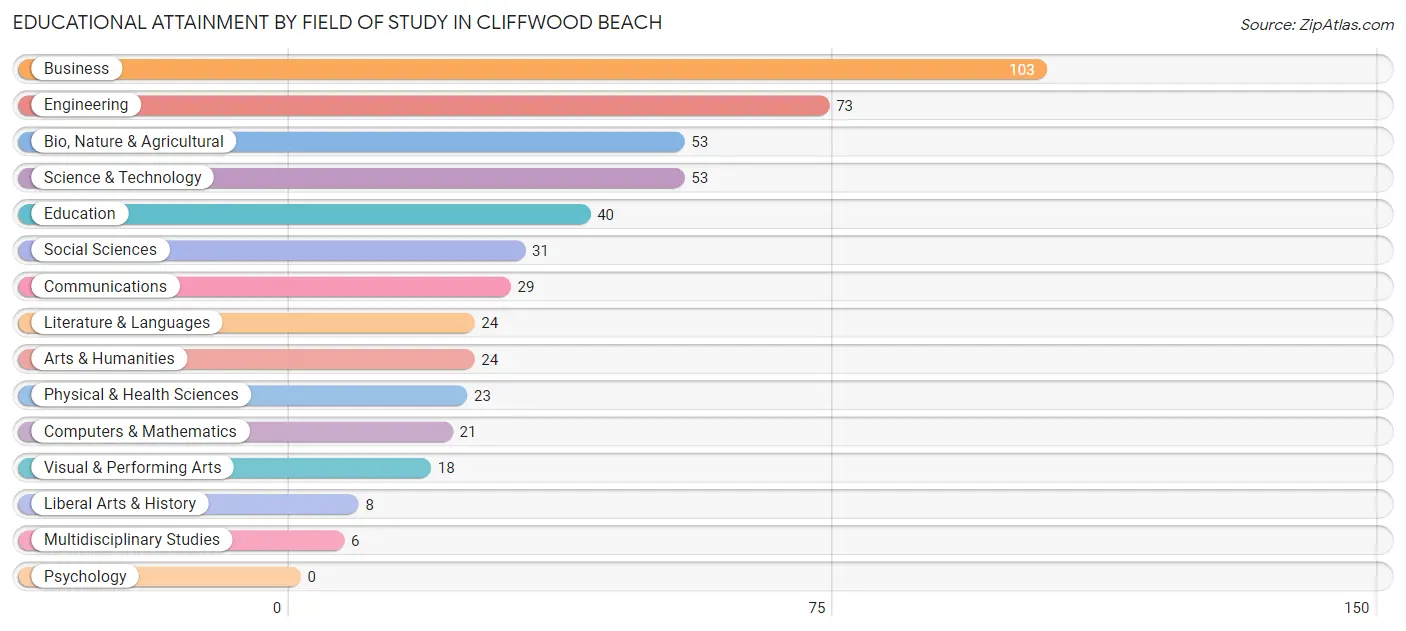
Educational Attainment by Field of Study in Cliffwood Beach
Business (103 | 20.4%), engineering (73 | 14.4%), bio, nature & agricultural (53 | 10.5%), science & technology (53 | 10.5%), and education (40 | 7.9%) are the most common fields of study among 506 individuals in Cliffwood Beach who have obtained a bachelor's degree or higher.
| Field of Study | # Graduates | % Graduates |
| Computers & Mathematics | 21 | 4.2% |
| Bio, Nature & Agricultural | 53 | 10.5% |
| Physical & Health Sciences | 23 | 4.5% |
| Psychology | 0 | 0.0% |
| Social Sciences | 31 | 6.1% |
| Engineering | 73 | 14.4% |
| Multidisciplinary Studies | 6 | 1.2% |
| Science & Technology | 53 | 10.5% |
| Business | 103 | 20.4% |
| Education | 40 | 7.9% |
| Literature & Languages | 24 | 4.7% |
| Liberal Arts & History | 8 | 1.6% |
| Visual & Performing Arts | 18 | 3.6% |
| Communications | 29 | 5.7% |
| Arts & Humanities | 24 | 4.7% |
| Total | 506 | 100.0% |
Transportation & Commute in Cliffwood Beach
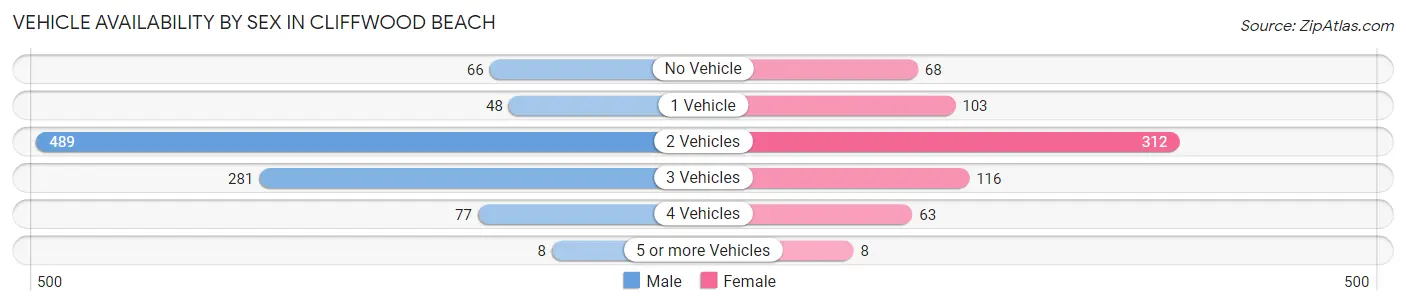
Vehicle Availability by Sex in Cliffwood Beach
The most prevalent vehicle ownership categories in Cliffwood Beach are males with 2 vehicles (489, accounting for 50.5%) and females with 2 vehicles (312, making up 73.0%).
| Vehicles Available | Male | Female |
| No Vehicle | 66 (6.8%) | 68 (10.2%) |
| 1 Vehicle | 48 (5.0%) | 103 (15.4%) |
| 2 Vehicles | 489 (50.5%) | 312 (46.6%) |
| 3 Vehicles | 281 (29.0%) | 116 (17.3%) |
| 4 Vehicles | 77 (8.0%) | 63 (9.4%) |
| 5 or more Vehicles | 8 (0.8%) | 8 (1.2%) |
| Total | 969 (100.0%) | 670 (100.0%) |
Commute Time in Cliffwood Beach
The most frequently occuring commute durations in Cliffwood Beach are 10 to 14 minutes (305 commuters, 19.6%), 30 to 34 minutes (222 commuters, 14.3%), and 45 to 59 minutes (194 commuters, 12.5%).
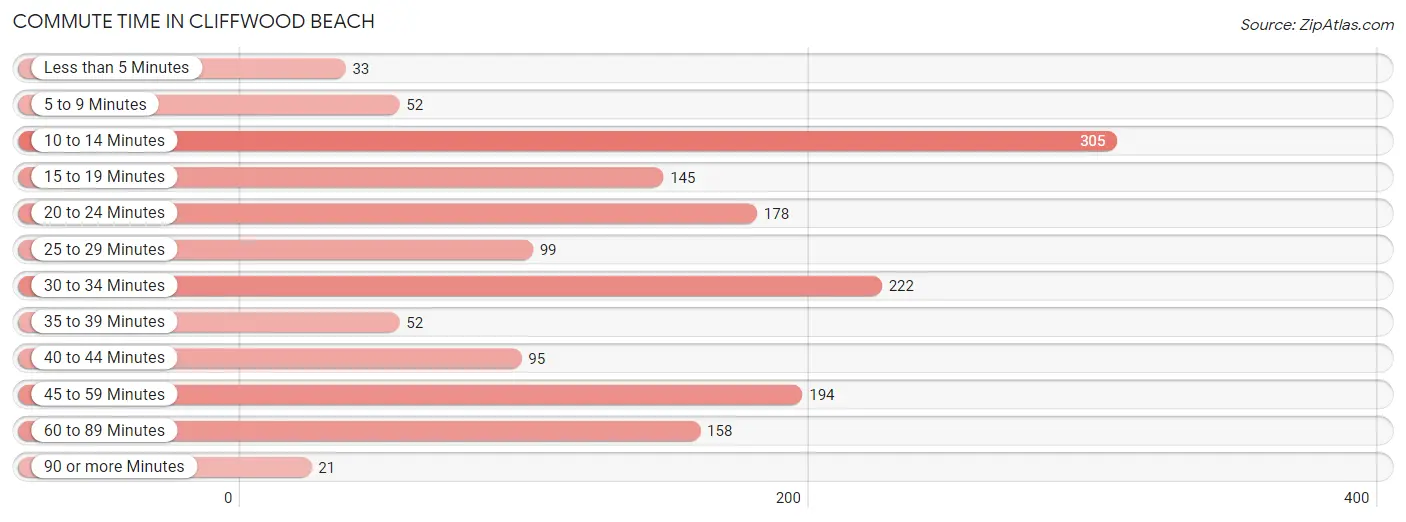
| Commute Time | # Commuters | % Commuters |
| Less than 5 Minutes | 33 | 2.1% |
| 5 to 9 Minutes | 52 | 3.4% |
| 10 to 14 Minutes | 305 | 19.6% |
| 15 to 19 Minutes | 145 | 9.3% |
| 20 to 24 Minutes | 178 | 11.5% |
| 25 to 29 Minutes | 99 | 6.4% |
| 30 to 34 Minutes | 222 | 14.3% |
| 35 to 39 Minutes | 52 | 3.4% |
| 40 to 44 Minutes | 95 | 6.1% |
| 45 to 59 Minutes | 194 | 12.5% |
| 60 to 89 Minutes | 158 | 10.2% |
| 90 or more Minutes | 21 | 1.3% |
Commute Time by Sex in Cliffwood Beach
The most common commute times in Cliffwood Beach are 30 to 34 minutes (189 commuters, 20.7%) for males and 10 to 14 minutes (212 commuters, 33.0%) for females.
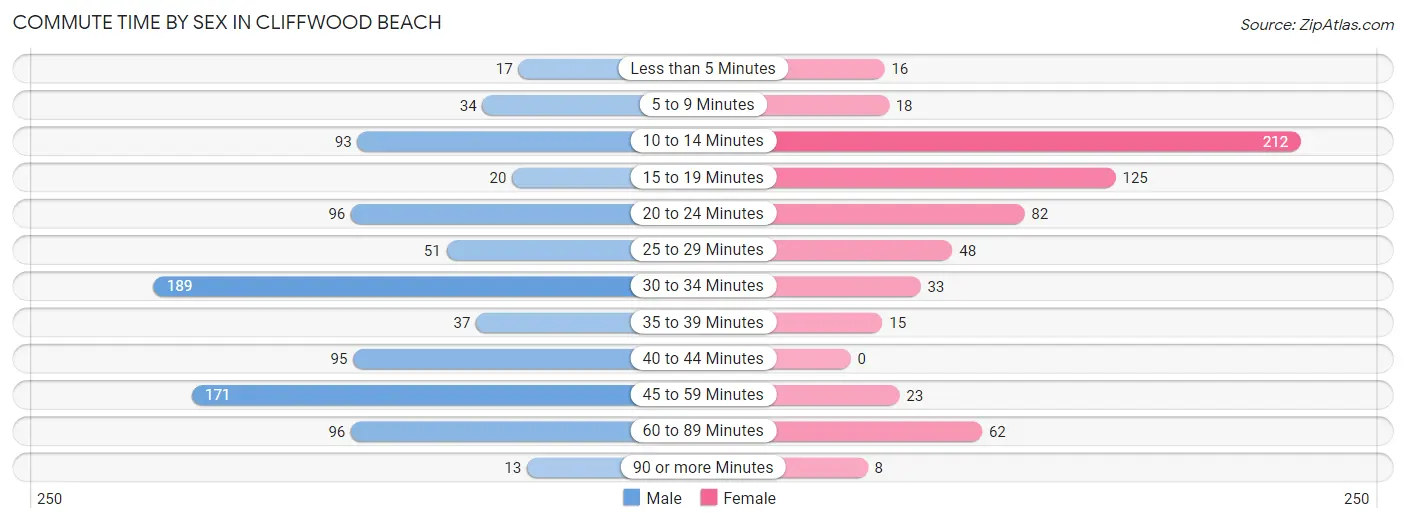
| Commute Time | Male | Female |
| Less than 5 Minutes | 17 (1.9%) | 16 (2.5%) |
| 5 to 9 Minutes | 34 (3.7%) | 18 (2.8%) |
| 10 to 14 Minutes | 93 (10.2%) | 212 (33.0%) |
| 15 to 19 Minutes | 20 (2.2%) | 125 (19.5%) |
| 20 to 24 Minutes | 96 (10.5%) | 82 (12.8%) |
| 25 to 29 Minutes | 51 (5.6%) | 48 (7.5%) |
| 30 to 34 Minutes | 189 (20.7%) | 33 (5.1%) |
| 35 to 39 Minutes | 37 (4.1%) | 15 (2.3%) |
| 40 to 44 Minutes | 95 (10.4%) | 0 (0.0%) |
| 45 to 59 Minutes | 171 (18.8%) | 23 (3.6%) |
| 60 to 89 Minutes | 96 (10.5%) | 62 (9.7%) |
| 90 or more Minutes | 13 (1.4%) | 8 (1.3%) |
Time of Departure to Work by Sex in Cliffwood Beach
The most frequent times of departure to work in Cliffwood Beach are 6:00 AM to 6:29 AM (274, 30.0%) for males and 8:00 AM to 8:29 AM (141, 22.0%) for females.
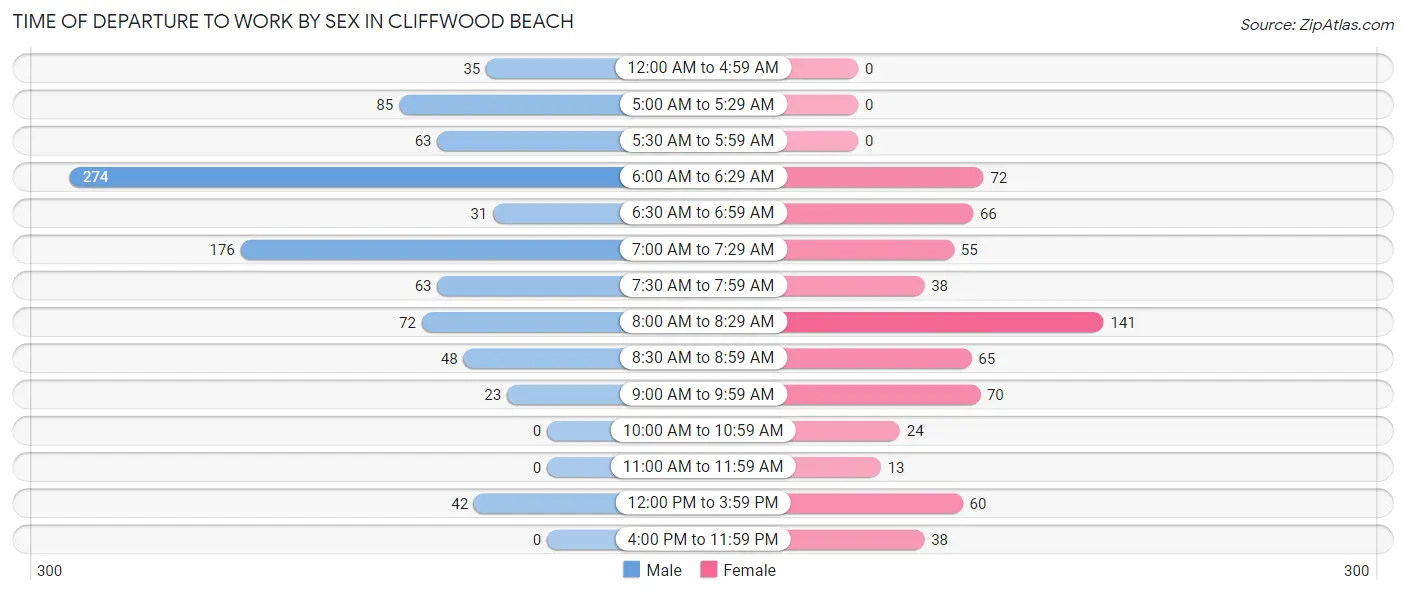
| Time of Departure | Male | Female |
| 12:00 AM to 4:59 AM | 35 (3.8%) | 0 (0.0%) |
| 5:00 AM to 5:29 AM | 85 (9.3%) | 0 (0.0%) |
| 5:30 AM to 5:59 AM | 63 (6.9%) | 0 (0.0%) |
| 6:00 AM to 6:29 AM | 274 (30.0%) | 72 (11.2%) |
| 6:30 AM to 6:59 AM | 31 (3.4%) | 66 (10.3%) |
| 7:00 AM to 7:29 AM | 176 (19.3%) | 55 (8.6%) |
| 7:30 AM to 7:59 AM | 63 (6.9%) | 38 (5.9%) |
| 8:00 AM to 8:29 AM | 72 (7.9%) | 141 (22.0%) |
| 8:30 AM to 8:59 AM | 48 (5.3%) | 65 (10.1%) |
| 9:00 AM to 9:59 AM | 23 (2.5%) | 70 (10.9%) |
| 10:00 AM to 10:59 AM | 0 (0.0%) | 24 (3.7%) |
| 11:00 AM to 11:59 AM | 0 (0.0%) | 13 (2.0%) |
| 12:00 PM to 3:59 PM | 42 (4.6%) | 60 (9.3%) |
| 4:00 PM to 11:59 PM | 0 (0.0%) | 38 (5.9%) |
| Total | 912 (100.0%) | 642 (100.0%) |
Housing Occupancy in Cliffwood Beach
Occupancy by Ownership in Cliffwood Beach
Of the total 1,254 dwellings in Cliffwood Beach, owner-occupied units account for 1,169 (93.2%), while renter-occupied units make up 85 (6.8%).
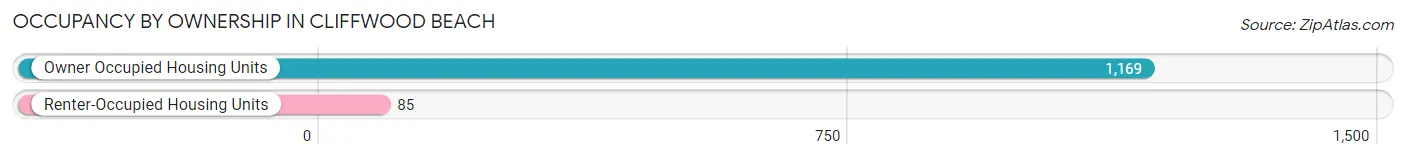
| Occupancy | # Housing Units | % Housing Units |
| Owner Occupied Housing Units | 1,169 | 93.2% |
| Renter-Occupied Housing Units | 85 | 6.8% |
| Total Occupied Housing Units | 1,254 | 100.0% |
Occupancy by Household Size in Cliffwood Beach
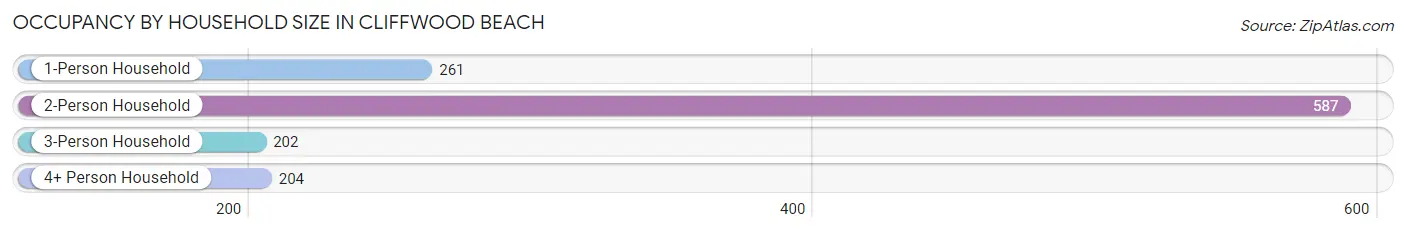
| Household Size | # Housing Units | % Housing Units |
| 1-Person Household | 261 | 20.8% |
| 2-Person Household | 587 | 46.8% |
| 3-Person Household | 202 | 16.1% |
| 4+ Person Household | 204 | 16.3% |
| Total Housing Units | 1,254 | 100.0% |
Occupancy by Ownership by Household Size in Cliffwood Beach

| Household Size | Owner-occupied | Renter-occupied |
| 1-Person Household | 231 (88.5%) | 30 (11.5%) |
| 2-Person Household | 582 (99.2%) | 5 (0.9%) |
| 3-Person Household | 202 (100.0%) | 0 (0.0%) |
| 4+ Person Household | 154 (75.5%) | 50 (24.5%) |
| Total Housing Units | 1,169 (93.2%) | 85 (6.8%) |
Occupancy by Educational Attainment in Cliffwood Beach
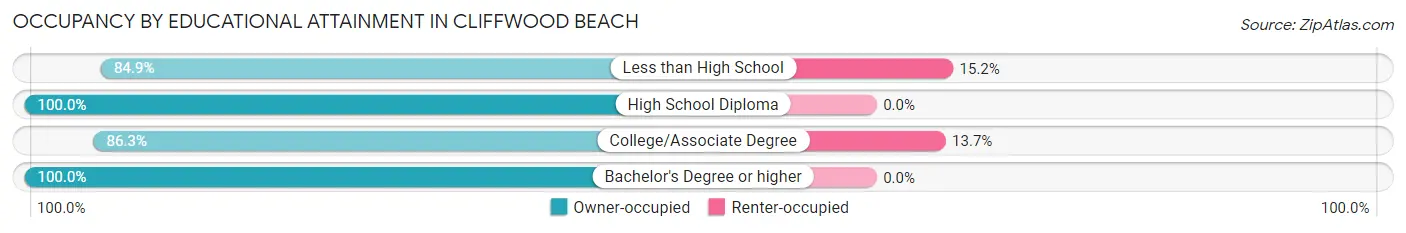
| Household Size | Owner-occupied | Renter-occupied |
| Less than High School | 112 (84.9%) | 20 (15.1%) |
| High School Diploma | 450 (100.0%) | 0 (0.0%) |
| College/Associate Degree | 410 (86.3%) | 65 (13.7%) |
| Bachelor's Degree or higher | 197 (100.0%) | 0 (0.0%) |
Occupancy by Age of Householder in Cliffwood Beach
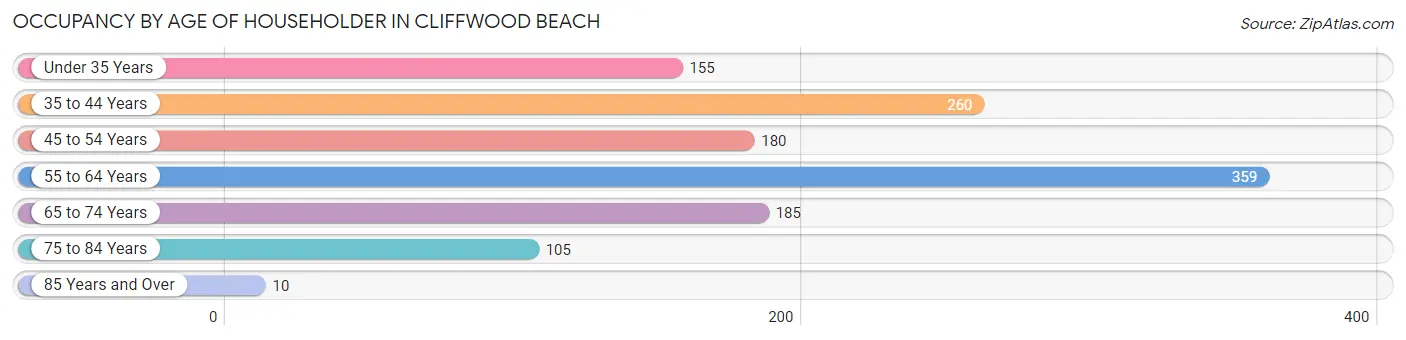
| Age Bracket | # Households | % Households |
| Under 35 Years | 155 | 12.4% |
| 35 to 44 Years | 260 | 20.7% |
| 45 to 54 Years | 180 | 14.3% |
| 55 to 64 Years | 359 | 28.6% |
| 65 to 74 Years | 185 | 14.7% |
| 75 to 84 Years | 105 | 8.4% |
| 85 Years and Over | 10 | 0.8% |
| Total | 1,254 | 100.0% |
Housing Finances in Cliffwood Beach
Median Income by Occupancy in Cliffwood Beach
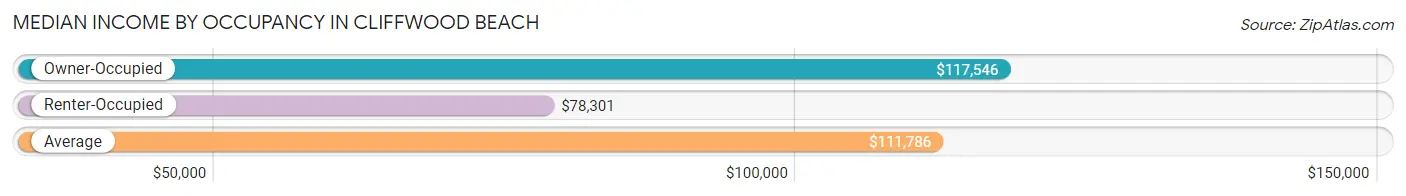
| Occupancy Type | # Households | Median Income |
| Owner-Occupied | 1,169 (93.2%) | $117,546 |
| Renter-Occupied | 85 (6.8%) | $78,301 |
| Average | 1,254 (100.0%) | $111,786 |
Occupancy by Householder Income Bracket in Cliffwood Beach
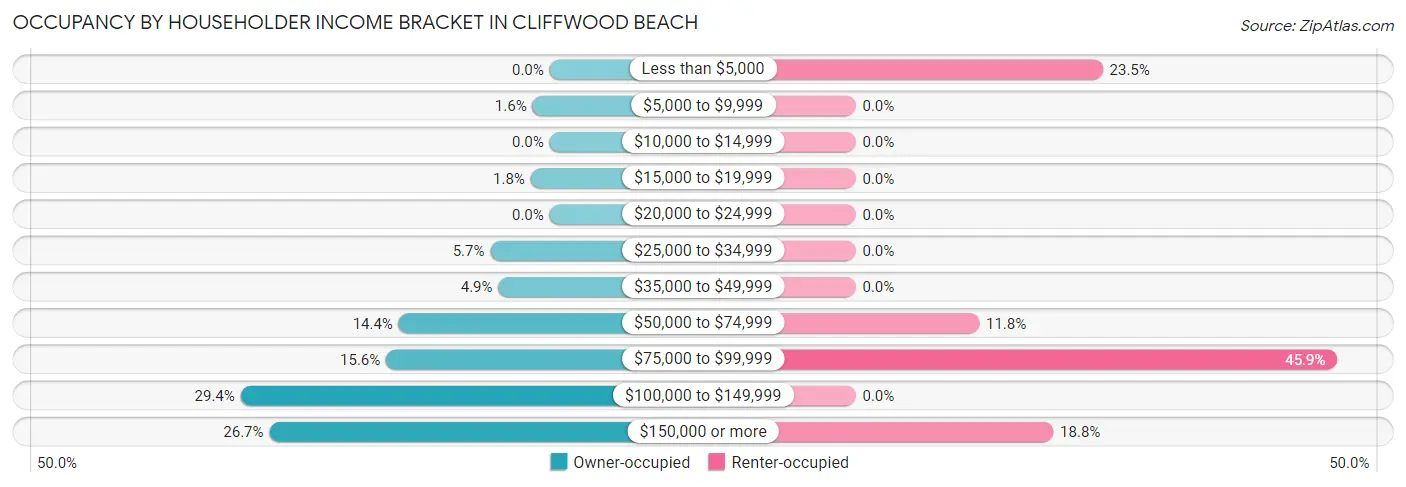
| Income Bracket | Owner-occupied | Renter-occupied |
| Less than $5,000 | 0 (0.0%) | 20 (23.5%) |
| $5,000 to $9,999 | 19 (1.6%) | 0 (0.0%) |
| $10,000 to $14,999 | 0 (0.0%) | 0 (0.0%) |
| $15,000 to $19,999 | 21 (1.8%) | 0 (0.0%) |
| $20,000 to $24,999 | 0 (0.0%) | 0 (0.0%) |
| $25,000 to $34,999 | 66 (5.7%) | 0 (0.0%) |
| $35,000 to $49,999 | 57 (4.9%) | 0 (0.0%) |
| $50,000 to $74,999 | 168 (14.4%) | 10 (11.8%) |
| $75,000 to $99,999 | 182 (15.6%) | 39 (45.9%) |
| $100,000 to $149,999 | 344 (29.4%) | 0 (0.0%) |
| $150,000 or more | 312 (26.7%) | 16 (18.8%) |
| Total | 1,169 (100.0%) | 85 (100.0%) |
Monthly Housing Cost Tiers in Cliffwood Beach
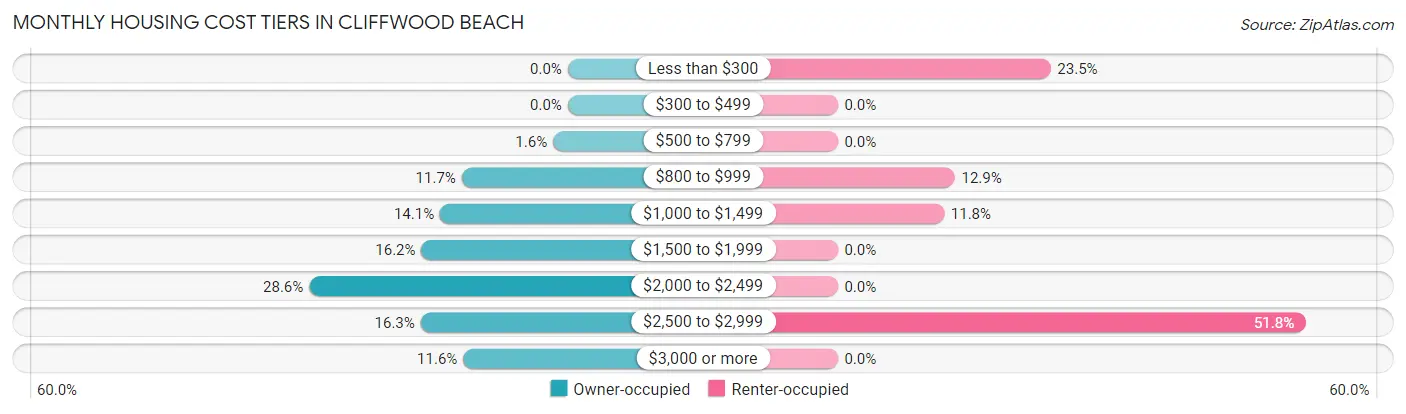
| Monthly Cost | Owner-occupied | Renter-occupied |
| Less than $300 | 0 (0.0%) | 20 (23.5%) |
| $300 to $499 | 0 (0.0%) | 0 (0.0%) |
| $500 to $799 | 19 (1.6%) | 0 (0.0%) |
| $800 to $999 | 137 (11.7%) | 11 (12.9%) |
| $1,000 to $1,499 | 165 (14.1%) | 10 (11.8%) |
| $1,500 to $1,999 | 189 (16.2%) | 0 (0.0%) |
| $2,000 to $2,499 | 334 (28.6%) | 0 (0.0%) |
| $2,500 to $2,999 | 190 (16.3%) | 44 (51.8%) |
| $3,000 or more | 135 (11.6%) | 0 (0.0%) |
| Total | 1,169 (100.0%) | 85 (100.0%) |
Physical Housing Characteristics in Cliffwood Beach
Housing Structures in Cliffwood Beach
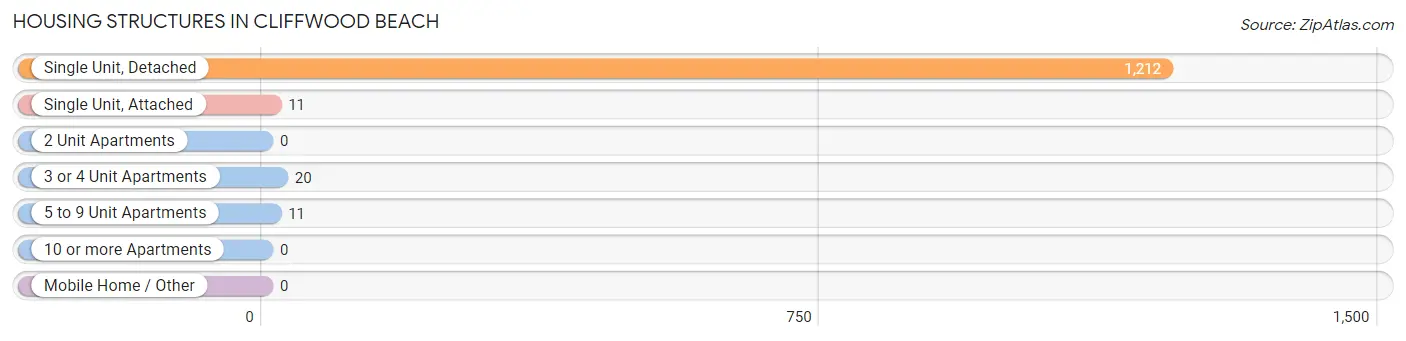
| Structure Type | # Housing Units | % Housing Units |
| Single Unit, Detached | 1,212 | 96.7% |
| Single Unit, Attached | 11 | 0.9% |
| 2 Unit Apartments | 0 | 0.0% |
| 3 or 4 Unit Apartments | 20 | 1.6% |
| 5 to 9 Unit Apartments | 11 | 0.9% |
| 10 or more Apartments | 0 | 0.0% |
| Mobile Home / Other | 0 | 0.0% |
| Total | 1,254 | 100.0% |
Housing Structures by Occupancy in Cliffwood Beach
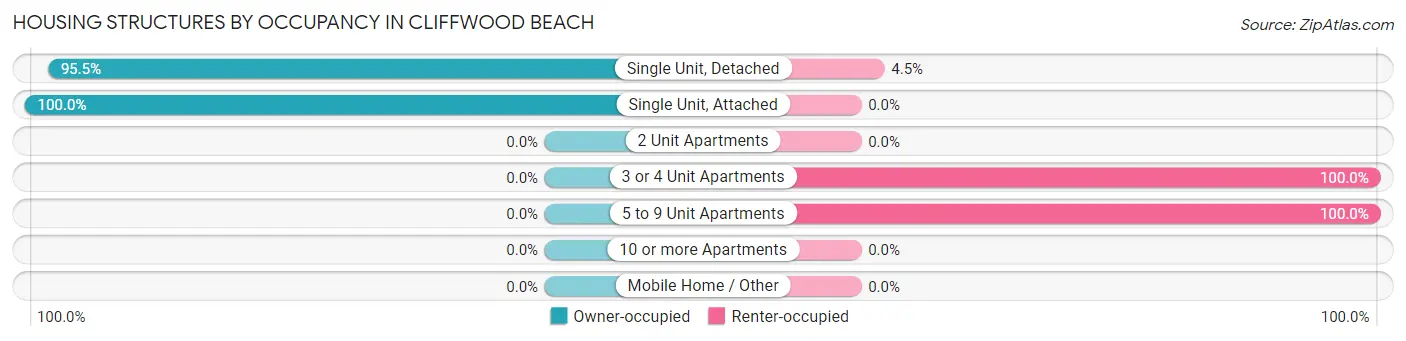
| Structure Type | Owner-occupied | Renter-occupied |
| Single Unit, Detached | 1,158 (95.5%) | 54 (4.5%) |
| Single Unit, Attached | 11 (100.0%) | 0 (0.0%) |
| 2 Unit Apartments | 0 (0.0%) | 0 (0.0%) |
| 3 or 4 Unit Apartments | 0 (0.0%) | 20 (100.0%) |
| 5 to 9 Unit Apartments | 0 (0.0%) | 11 (100.0%) |
| 10 or more Apartments | 0 (0.0%) | 0 (0.0%) |
| Mobile Home / Other | 0 (0.0%) | 0 (0.0%) |
| Total | 1,169 (93.2%) | 85 (6.8%) |
Housing Structures by Number of Rooms in Cliffwood Beach
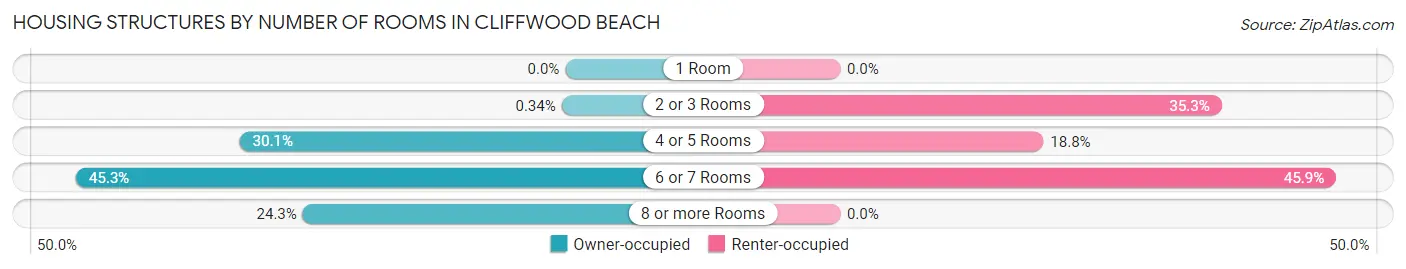
| Number of Rooms | Owner-occupied | Renter-occupied |
| 1 Room | 0 (0.0%) | 0 (0.0%) |
| 2 or 3 Rooms | 4 (0.3%) | 30 (35.3%) |
| 4 or 5 Rooms | 352 (30.1%) | 16 (18.8%) |
| 6 or 7 Rooms | 529 (45.3%) | 39 (45.9%) |
| 8 or more Rooms | 284 (24.3%) | 0 (0.0%) |
| Total | 1,169 (100.0%) | 85 (100.0%) |
Housing Structure by Heating Type in Cliffwood Beach
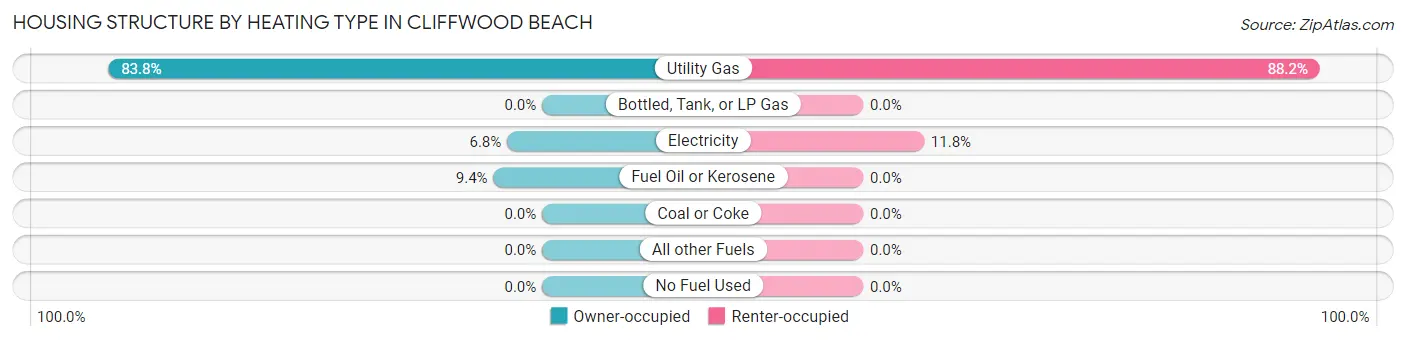
| Heating Type | Owner-occupied | Renter-occupied |
| Utility Gas | 980 (83.8%) | 75 (88.2%) |
| Bottled, Tank, or LP Gas | 0 (0.0%) | 0 (0.0%) |
| Electricity | 79 (6.8%) | 10 (11.8%) |
| Fuel Oil or Kerosene | 110 (9.4%) | 0 (0.0%) |
| Coal or Coke | 0 (0.0%) | 0 (0.0%) |
| All other Fuels | 0 (0.0%) | 0 (0.0%) |
| No Fuel Used | 0 (0.0%) | 0 (0.0%) |
| Total | 1,169 (100.0%) | 85 (100.0%) |
Household Vehicle Usage in Cliffwood Beach
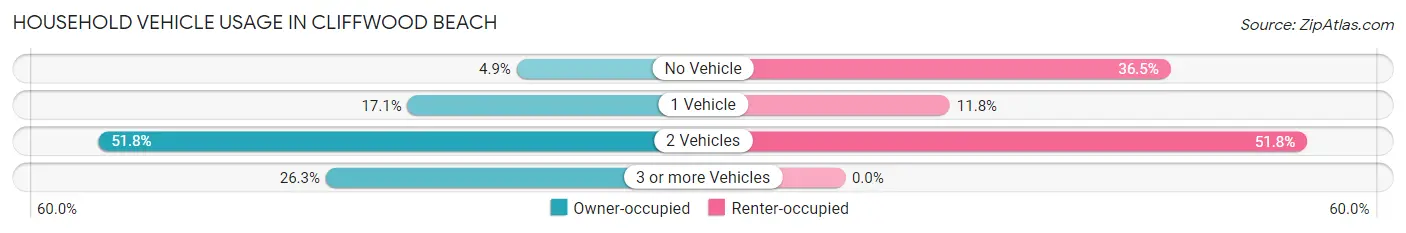
| Vehicles per Household | Owner-occupied | Renter-occupied |
| No Vehicle | 57 (4.9%) | 31 (36.5%) |
| 1 Vehicle | 200 (17.1%) | 10 (11.8%) |
| 2 Vehicles | 605 (51.7%) | 44 (51.8%) |
| 3 or more Vehicles | 307 (26.3%) | 0 (0.0%) |
| Total | 1,169 (100.0%) | 85 (100.0%) |
Real Estate & Mortgages in Cliffwood Beach
Real Estate and Mortgage Overview in Cliffwood Beach
| Characteristic | Without Mortgage | With Mortgage |
| Housing Units | 317 | 852 |
| Median Property Value | $282,000 | $311,600 |
| Median Household Income | $129,821 | $165 |
| Monthly Housing Costs | $1,021 | $135 |
| Real Estate Taxes | $8,153 | $24 |
Property Value by Mortgage Status in Cliffwood Beach
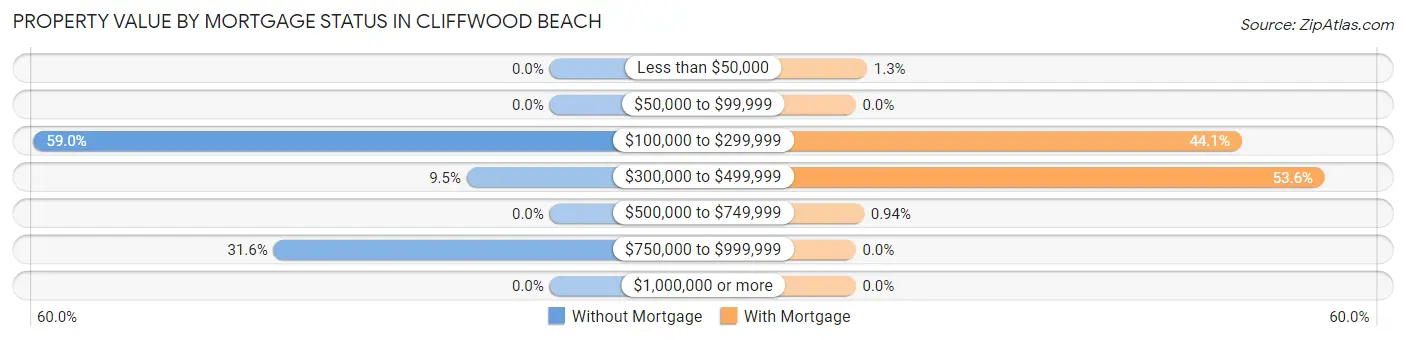
| Property Value | Without Mortgage | With Mortgage |
| Less than $50,000 | 0 (0.0%) | 11 (1.3%) |
| $50,000 to $99,999 | 0 (0.0%) | 0 (0.0%) |
| $100,000 to $299,999 | 187 (59.0%) | 376 (44.1%) |
| $300,000 to $499,999 | 30 (9.5%) | 457 (53.6%) |
| $500,000 to $749,999 | 0 (0.0%) | 8 (0.9%) |
| $750,000 to $999,999 | 100 (31.6%) | 0 (0.0%) |
| $1,000,000 or more | 0 (0.0%) | 0 (0.0%) |
| Total | 317 (100.0%) | 852 (100.0%) |
Household Income by Mortgage Status in Cliffwood Beach
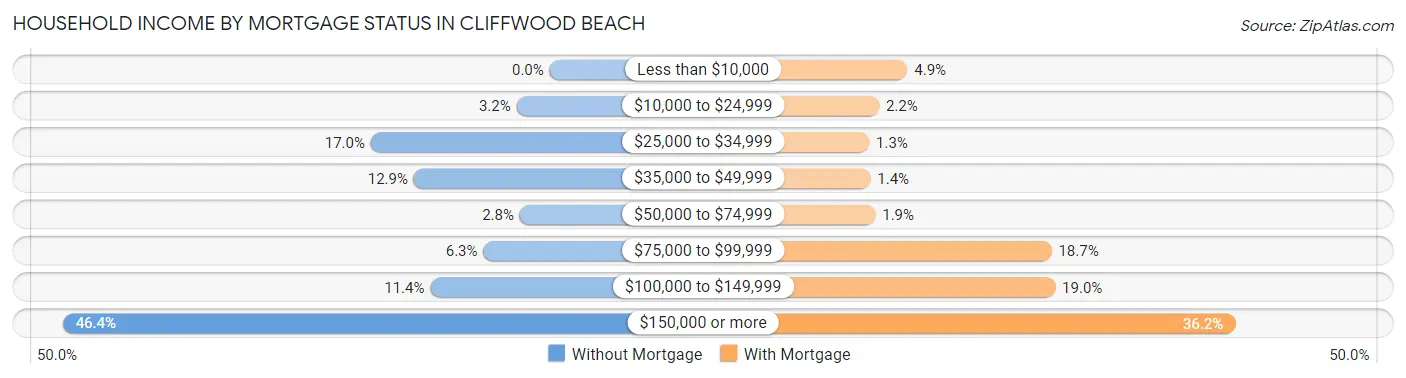
| Household Income | Without Mortgage | With Mortgage |
| Less than $10,000 | 0 (0.0%) | 42 (4.9%) |
| $10,000 to $24,999 | 10 (3.2%) | 19 (2.2%) |
| $25,000 to $34,999 | 54 (17.0%) | 11 (1.3%) |
| $35,000 to $49,999 | 41 (12.9%) | 12 (1.4%) |
| $50,000 to $74,999 | 9 (2.8%) | 16 (1.9%) |
| $75,000 to $99,999 | 20 (6.3%) | 159 (18.7%) |
| $100,000 to $149,999 | 36 (11.4%) | 162 (19.0%) |
| $150,000 or more | 147 (46.4%) | 308 (36.1%) |
| Total | 317 (100.0%) | 852 (100.0%) |
Property Value to Household Income Ratio in Cliffwood Beach
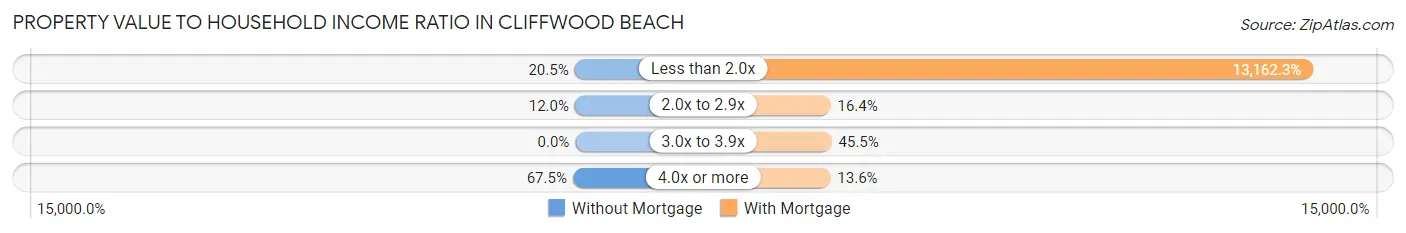
| Value-to-Income Ratio | Without Mortgage | With Mortgage |
| Less than 2.0x | 65 (20.5%) | 112,143 (13,162.3%) |
| 2.0x to 2.9x | 38 (12.0%) | 140 (16.4%) |
| 3.0x to 3.9x | 0 (0.0%) | 388 (45.5%) |
| 4.0x or more | 214 (67.5%) | 116 (13.6%) |
| Total | 317 (100.0%) | 852 (100.0%) |
Real Estate Taxes by Mortgage Status in Cliffwood Beach
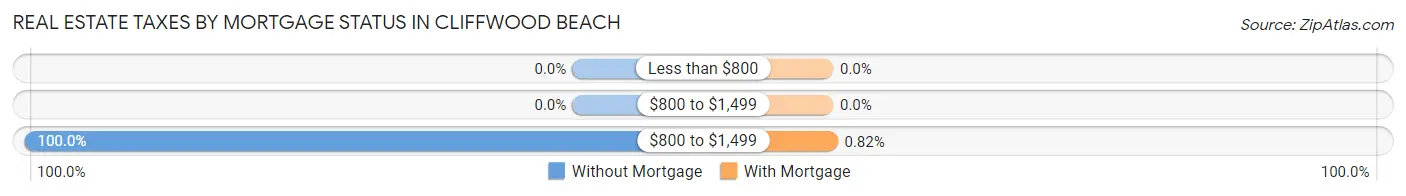
| Property Taxes | Without Mortgage | With Mortgage |
| Less than $800 | 0 (0.0%) | 0 (0.0%) |
| $800 to $1,499 | 0 (0.0%) | 0 (0.0%) |
| $800 to $1,499 | 317 (100.0%) | 7 (0.8%) |
| Total | 317 (100.0%) | 852 (100.0%) |
Health & Disability in Cliffwood Beach
Health Insurance Coverage by Age in Cliffwood Beach
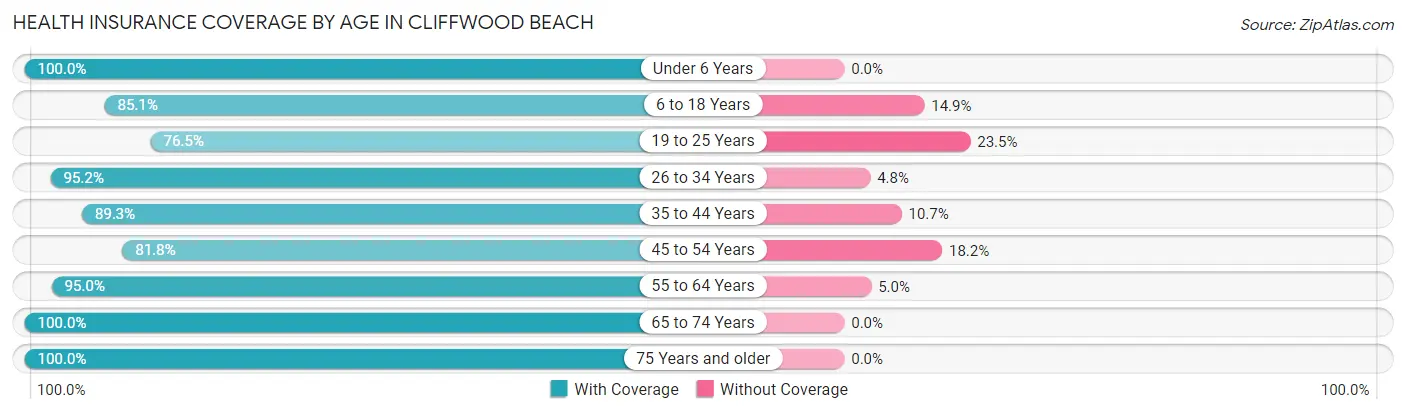
| Age Bracket | With Coverage | Without Coverage |
| Under 6 Years | 124 (100.0%) | 0 (0.0%) |
| 6 to 18 Years | 268 (85.1%) | 47 (14.9%) |
| 19 to 25 Years | 127 (76.5%) | 39 (23.5%) |
| 26 to 34 Years | 335 (95.2%) | 17 (4.8%) |
| 35 to 44 Years | 510 (89.3%) | 61 (10.7%) |
| 45 to 54 Years | 314 (81.8%) | 70 (18.2%) |
| 55 to 64 Years | 549 (95.0%) | 29 (5.0%) |
| 65 to 74 Years | 325 (100.0%) | 0 (0.0%) |
| 75 Years and older | 193 (100.0%) | 0 (0.0%) |
| Total | 2,745 (91.3%) | 263 (8.7%) |
Health Insurance Coverage by Citizenship Status in Cliffwood Beach
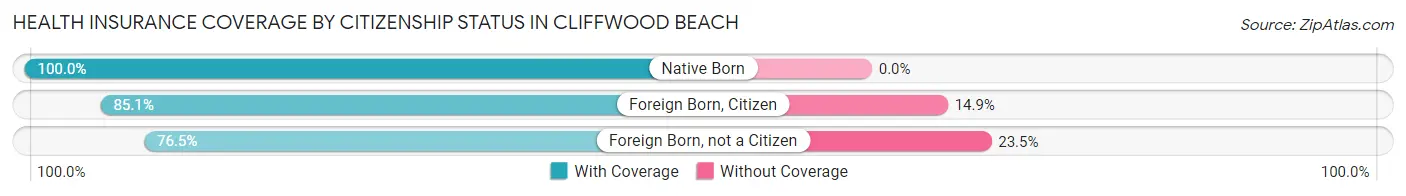
| Citizenship Status | With Coverage | Without Coverage |
| Native Born | 124 (100.0%) | 0 (0.0%) |
| Foreign Born, Citizen | 268 (85.1%) | 47 (14.9%) |
| Foreign Born, not a Citizen | 127 (76.5%) | 39 (23.5%) |
Health Insurance Coverage by Household Income in Cliffwood Beach
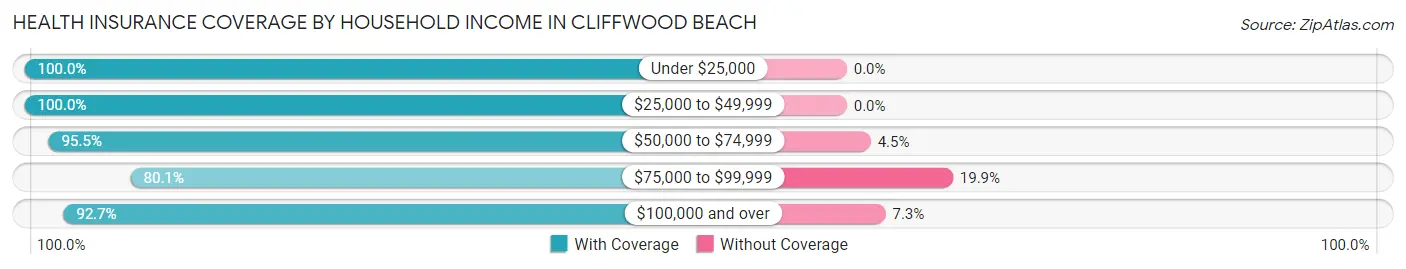
| Household Income | With Coverage | Without Coverage |
| Under $25,000 | 72 (100.0%) | 0 (0.0%) |
| $25,000 to $49,999 | 226 (100.0%) | 0 (0.0%) |
| $50,000 to $74,999 | 384 (95.5%) | 18 (4.5%) |
| $75,000 to $99,999 | 492 (80.1%) | 122 (19.9%) |
| $100,000 and over | 1,571 (92.7%) | 123 (7.3%) |
Public vs Private Health Insurance Coverage by Age in Cliffwood Beach
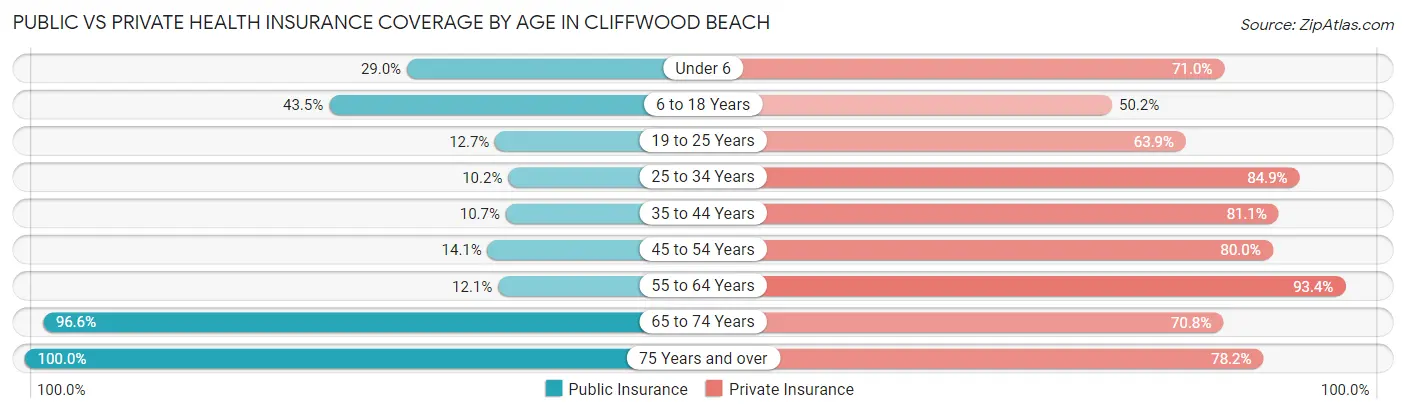
| Age Bracket | Public Insurance | Private Insurance |
| Under 6 | 36 (29.0%) | 88 (71.0%) |
| 6 to 18 Years | 137 (43.5%) | 158 (50.2%) |
| 19 to 25 Years | 21 (12.7%) | 106 (63.9%) |
| 25 to 34 Years | 36 (10.2%) | 299 (84.9%) |
| 35 to 44 Years | 61 (10.7%) | 463 (81.1%) |
| 45 to 54 Years | 54 (14.1%) | 307 (79.9%) |
| 55 to 64 Years | 70 (12.1%) | 540 (93.4%) |
| 65 to 74 Years | 314 (96.6%) | 230 (70.8%) |
| 75 Years and over | 193 (100.0%) | 151 (78.2%) |
| Total | 922 (30.6%) | 2,342 (77.9%) |
Disability Status by Sex by Age in Cliffwood Beach
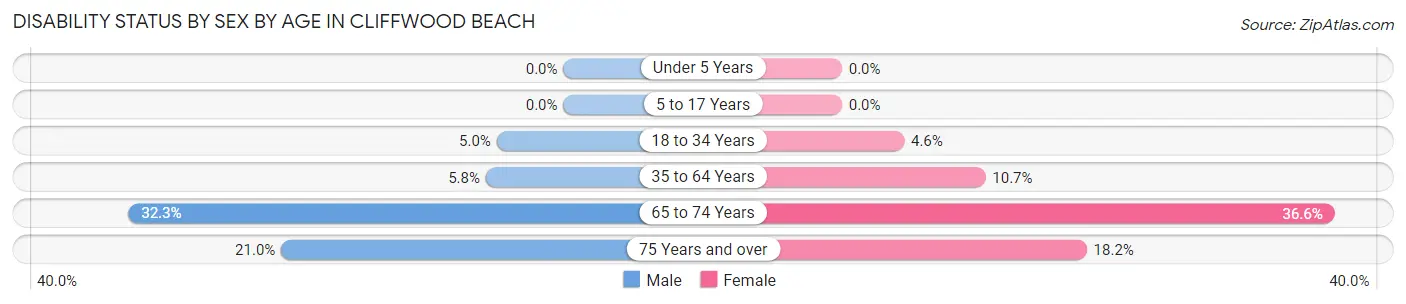
| Age Bracket | Male | Female |
| Under 5 Years | 0 (0.0%) | 0 (0.0%) |
| 5 to 17 Years | 0 (0.0%) | 0 (0.0%) |
| 18 to 34 Years | 16 (5.0%) | 9 (4.6%) |
| 35 to 64 Years | 44 (5.8%) | 82 (10.7%) |
| 65 to 74 Years | 52 (32.3%) | 60 (36.6%) |
| 75 Years and over | 22 (20.9%) | 16 (18.2%) |
Disability Class by Sex by Age in Cliffwood Beach
Disability Class: Hearing Difficulty
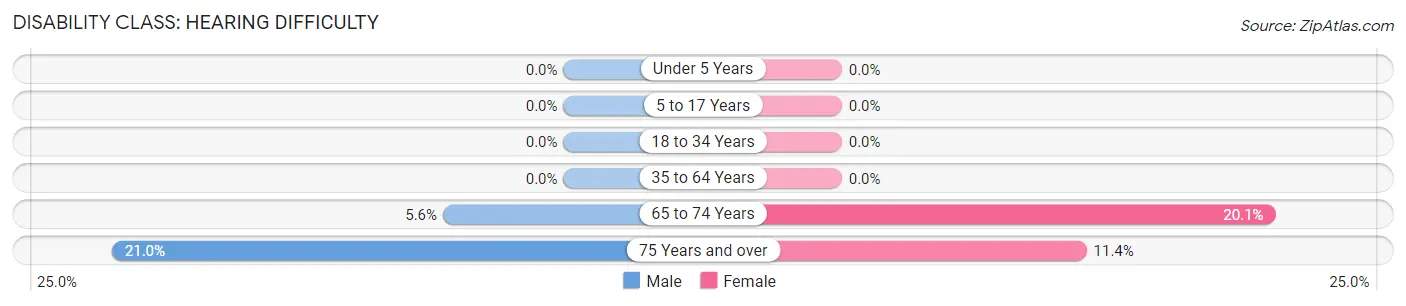
| Age Bracket | Male | Female |
| Under 5 Years | 0 (0.0%) | 0 (0.0%) |
| 5 to 17 Years | 0 (0.0%) | 0 (0.0%) |
| 18 to 34 Years | 0 (0.0%) | 0 (0.0%) |
| 35 to 64 Years | 0 (0.0%) | 0 (0.0%) |
| 65 to 74 Years | 9 (5.6%) | 33 (20.1%) |
| 75 Years and over | 22 (20.9%) | 10 (11.4%) |
Disability Class: Vision Difficulty
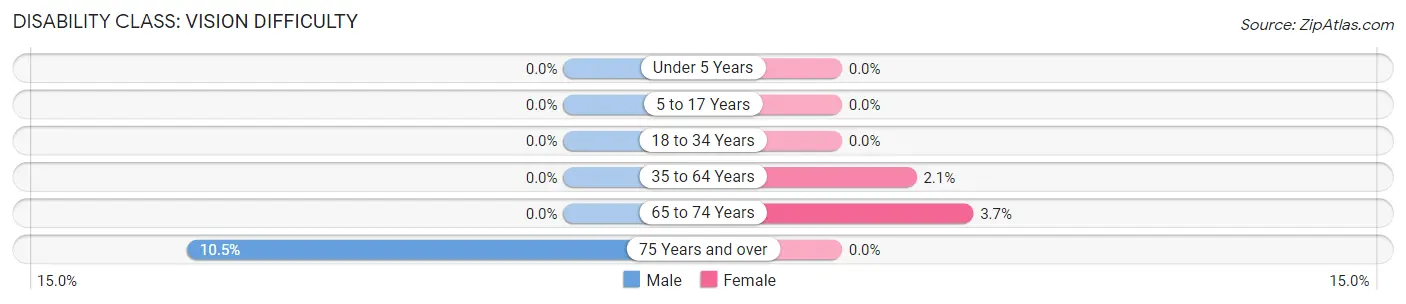
| Age Bracket | Male | Female |
| Under 5 Years | 0 (0.0%) | 0 (0.0%) |
| 5 to 17 Years | 0 (0.0%) | 0 (0.0%) |
| 18 to 34 Years | 0 (0.0%) | 0 (0.0%) |
| 35 to 64 Years | 0 (0.0%) | 16 (2.1%) |
| 65 to 74 Years | 0 (0.0%) | 6 (3.7%) |
| 75 Years and over | 11 (10.5%) | 0 (0.0%) |
Disability Class: Cognitive Difficulty
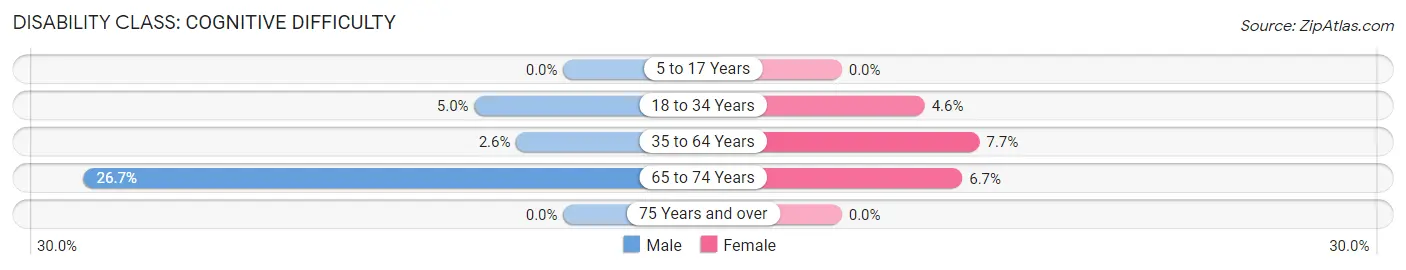
| Age Bracket | Male | Female |
| 5 to 17 Years | 0 (0.0%) | 0 (0.0%) |
| 18 to 34 Years | 16 (5.0%) | 9 (4.6%) |
| 35 to 64 Years | 20 (2.6%) | 59 (7.7%) |
| 65 to 74 Years | 43 (26.7%) | 11 (6.7%) |
| 75 Years and over | 0 (0.0%) | 0 (0.0%) |
Disability Class: Ambulatory Difficulty
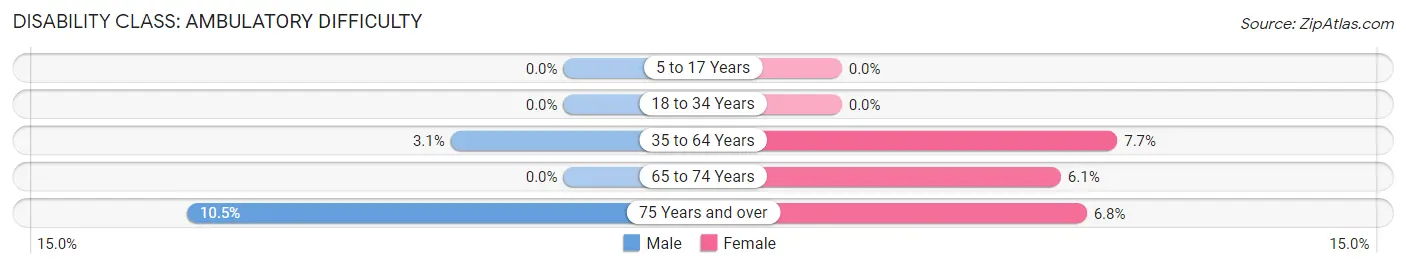
| Age Bracket | Male | Female |
| 5 to 17 Years | 0 (0.0%) | 0 (0.0%) |
| 18 to 34 Years | 0 (0.0%) | 0 (0.0%) |
| 35 to 64 Years | 24 (3.1%) | 59 (7.7%) |
| 65 to 74 Years | 0 (0.0%) | 10 (6.1%) |
| 75 Years and over | 11 (10.5%) | 6 (6.8%) |
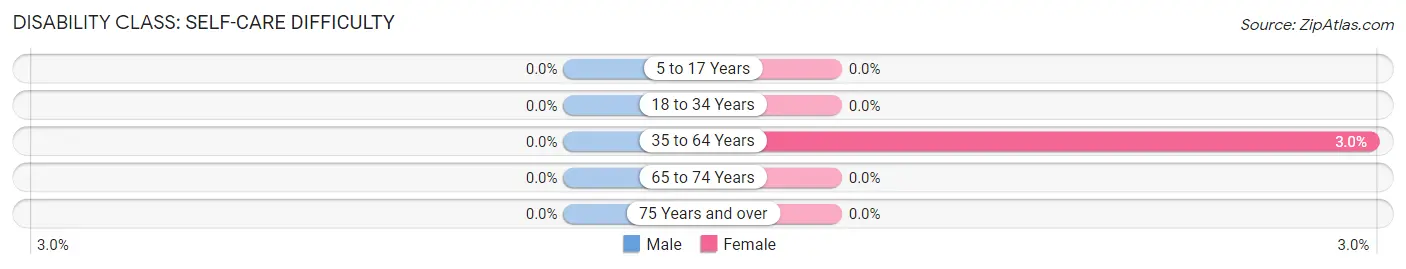
Disability Class: Self-Care Difficulty
| Age Bracket | Male | Female |
| 5 to 17 Years | 0 (0.0%) | 0 (0.0%) |
| 18 to 34 Years | 0 (0.0%) | 0 (0.0%) |
| 35 to 64 Years | 0 (0.0%) | 23 (3.0%) |
| 65 to 74 Years | 0 (0.0%) | 0 (0.0%) |
| 75 Years and over | 0 (0.0%) | 0 (0.0%) |
Technology Access in Cliffwood Beach
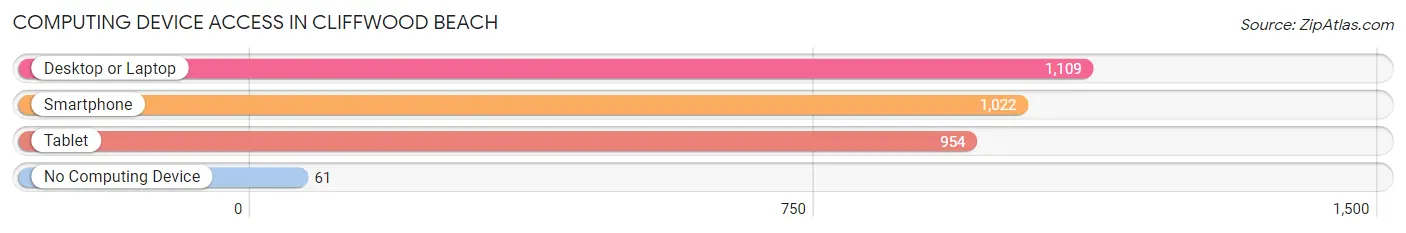
Computing Device Access in Cliffwood Beach
| Device Type | # Households | % Households |
| Desktop or Laptop | 1,109 | 88.4% |
| Smartphone | 1,022 | 81.5% |
| Tablet | 954 | 76.1% |
| No Computing Device | 61 | 4.9% |
| Total | 1,254 | 100.0% |
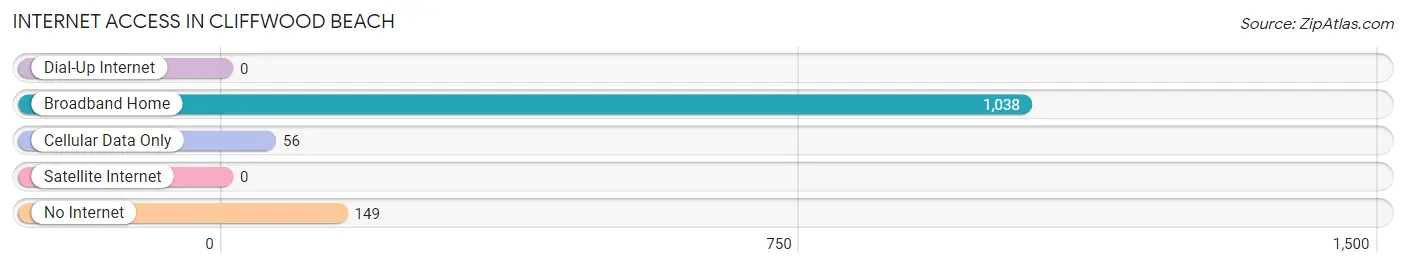
Internet Access in Cliffwood Beach
| Internet Type | # Households | % Households |
| Dial-Up Internet | 0 | 0.0% |
| Broadband Home | 1,038 | 82.8% |
| Cellular Data Only | 56 | 4.5% |
| Satellite Internet | 0 | 0.0% |
| No Internet | 149 | 11.9% |
| Total | 1,254 | 100.0% |
Cliffwood Beach Summary
Cliffwood Beach is a small unincorporated community located in Monmouth County, New Jersey. It is situated on the Raritan Bay, just south of the borough of Keyport. The community is part of the Bayshore Regional Strategic Plan, which aims to revitalize the area and promote economic development.
History
Cliffwood Beach was originally part of the Matawan Township, which was established in 1709. The area was first settled by Dutch and English settlers in the early 1700s. The area was known as “Cliffwood” and was home to a number of farms. In the late 1800s, the area began to develop as a summer resort destination. The area was known for its sandy beaches and was a popular spot for swimming and fishing.
In the early 1900s, the area began to develop as a residential community. The area was home to a number of small businesses, including a general store, a post office, and a few restaurants. In the 1950s, the area began to experience rapid growth as more people moved to the area. The area was eventually annexed by the borough of Keyport in the 1970s.
Geography
Cliffwood Beach is located in Monmouth County, New Jersey. It is situated on the Raritan Bay, just south of the borough of Keyport. The area is bordered by the boroughs of Matawan and Aberdeen to the north, and the borough of Hazlet to the south. The area is approximately 2.5 square miles in size and is home to a population of approximately 5,000 people.
The area is mostly flat and is home to a number of small creeks and streams. The area is also home to a number of parks and recreational areas, including the Cliffwood Beach Park and the Keyport Beach Park.
Economy
Cliffwood Beach is primarily a residential community, with a few small businesses located in the area. The area is home to a number of small retail stores, restaurants, and other businesses. The area is also home to a number of light industrial businesses, including a number of warehouses and distribution centers.
The area is also home to a number of marinas, which provide a variety of services to boaters. The area is also home to a number of recreational activities, including fishing, swimming, and boating.
Demographics
As of the 2010 census, the population of Cliffwood Beach was 5,000. The population is primarily white (90.2%), with a small percentage of African Americans (3.2%), Asians (2.2%), and Hispanics (2.2%). The median household income is $63,750, and the median home value is $310,000.
The area is home to a number of churches, including the Cliffwood Beach United Methodist Church and the St. John’s Lutheran Church. The area is also home to a number of schools, including the Cliffwood Beach Elementary School and the Keyport High School.
Conclusion
Cliffwood Beach is a small unincorporated community located in Monmouth County, New Jersey. It is situated on the Raritan Bay, just south of the borough of Keyport. The area is primarily a residential community, with a few small businesses located in the area. The area is home to a population of approximately 5,000 people, and the median household income is $63,750. The area is home to a number of churches, schools, parks, and recreational areas. The area is also home to a number of light industrial businesses, marinas, and other businesses.
Common Questions
What is Per Capita Income in Cliffwood Beach?
Per Capita income in Cliffwood Beach is $46,299.
What is the Median Family Income in Cliffwood Beach?
Median Family Income in Cliffwood Beach is $120,350.
What is the Median Household income in Cliffwood Beach?
Median Household Income in Cliffwood Beach is $111,786.
What is Income or Wage Gap in Cliffwood Beach?
Income or Wage Gap in Cliffwood Beach is 40.5%.
Women in Cliffwood Beach earn 59.5 cents for every dollar earned by a man.
What is Inequality or Gini Index in Cliffwood Beach?
Inequality or Gini Index in Cliffwood Beach is 0.32.
What is the Total Population of Cliffwood Beach?
Total Population of Cliffwood Beach is 3,008.
What is the Total Male Population of Cliffwood Beach?
Total Male Population of Cliffwood Beach is 1,598.
What is the Total Female Population of Cliffwood Beach?
Total Female Population of Cliffwood Beach is 1,410.
What is the Ratio of Males per 100 Females in Cliffwood Beach?
There are 113.33 Males per 100 Females in Cliffwood Beach.
What is the Ratio of Females per 100 Males in Cliffwood Beach?
There are 88.24 Females per 100 Males in Cliffwood Beach.
What is the Median Population Age in Cliffwood Beach?
Median Population Age in Cliffwood Beach is 44.8 Years.
What is the Average Family Size in Cliffwood Beach
Average Family Size in Cliffwood Beach is 2.8 People.
What is the Average Household Size in Cliffwood Beach
Average Household Size in Cliffwood Beach is 2.4 People.
How Large is the Labor Force in Cliffwood Beach?
There are 1,738 People in the Labor Forcein in Cliffwood Beach.
What is the Percentage of People in the Labor Force in Cliffwood Beach?
66.7% of People are in the Labor Force in Cliffwood Beach.
What is the Unemployment Rate in Cliffwood Beach?
Unemployment Rate in Cliffwood Beach is 5.1%.