Cities with the Highest Percentage of Asian Population in New Jersey
RELATED REPORTS & OPTIONS
Asian
New Jersey
Compare Cities
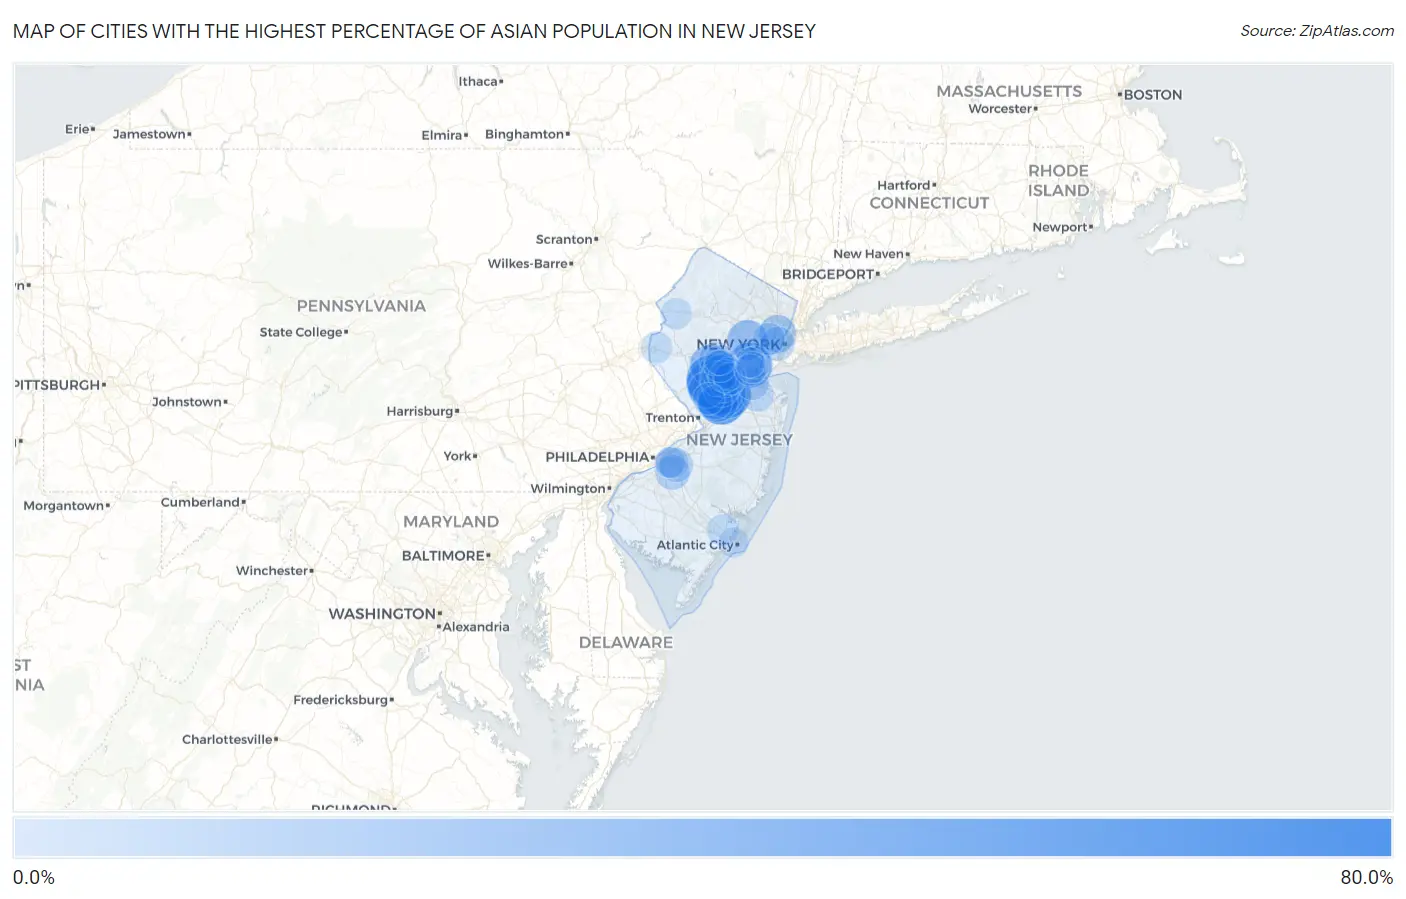
Map of Cities with the Highest Percentage of Asian Population in New Jersey
0.0%
80.0%
Cities with the Highest Percentage of Asian Population in New Jersey
| City | Asian | vs State | vs National | |
| 1. | Monroe Manor | 75.5% | 9.9%(+65.6)#1 | 5.8%(+69.7)#8 |
| 2. | Forsgate | 70.5% | 9.9%(+60.6)#2 | 5.8%(+64.7)#10 |
| 3. | Deans | 69.3% | 9.9%(+59.4)#3 | 5.8%(+63.5)#16 |
| 4. | Belle Mead | 63.1% | 9.9%(+53.2)#4 | 5.8%(+57.3)#25 |
| 5. | Ten Mile Run | 63.1% | 9.9%(+53.2)#5 | 5.8%(+57.3)#26 |
| 6. | Palisades Park Borough | 62.7% | 9.9%(+52.8)#6 | 5.8%(+56.9)#27 |
| 7. | Princeton Meadows | 62.1% | 9.9%(+52.2)#7 | 5.8%(+56.3)#30 |
| 8. | Dayton | 56.0% | 9.9%(+46.1)#8 | 5.8%(+50.2)#44 |
| 9. | Harlingen | 55.2% | 9.9%(+45.4)#9 | 5.8%(+49.5)#49 |
| 10. | Monmouth Junction | 54.9% | 9.9%(+45.0)#10 | 5.8%(+49.1)#51 |
| 11. | Heathcote | 52.9% | 9.9%(+43.0)#11 | 5.8%(+47.1)#64 |
| 12. | Iselin | 51.8% | 9.9%(+42.0)#12 | 5.8%(+46.1)#70 |
| 13. | Troy Hills | 46.8% | 9.9%(+37.0)#13 | 5.8%(+41.1)#95 |
| 14. | Deerfield Street | 46.0% | 9.9%(+36.1)#14 | 5.8%(+40.2)#101 |
| 15. | Parsippany | 45.0% | 9.9%(+35.2)#15 | 5.8%(+39.3)#104 |
| 16. | Fort Lee Borough | 43.8% | 9.9%(+33.9)#16 | 5.8%(+38.0)#108 |
| 17. | Englewood Cliffs Borough | 43.1% | 9.9%(+33.2)#17 | 5.8%(+37.3)#115 |
| 18. | Plainsboro Center | 42.2% | 9.9%(+32.4)#18 | 5.8%(+36.5)#121 |
| 19. | Edgewater Borough | 41.4% | 9.9%(+31.6)#19 | 5.8%(+35.7)#131 |
| 20. | Robbinsville Center | 40.3% | 9.9%(+30.4)#20 | 5.8%(+34.5)#139 |
| 21. | Bradley Gardens | 40.0% | 9.9%(+30.2)#21 | 5.8%(+34.3)#141 |
| 22. | Springfield | 39.7% | 9.9%(+29.8)#22 | 5.8%(+33.9)#145 |
| 23. | Short Hills | 39.5% | 9.9%(+29.6)#23 | 5.8%(+33.7)#146 |
| 24. | Zarephath | 39.2% | 9.9%(+29.3)#24 | 5.8%(+33.4)#149 |
| 25. | Leonia Borough | 37.4% | 9.9%(+27.5)#25 | 5.8%(+31.6)#175 |
| 26. | Sunset Lake | 36.2% | 9.9%(+26.3)#26 | 5.8%(+30.4)#184 |
| 27. | Old Tappan Borough | 36.0% | 9.9%(+26.1)#27 | 5.8%(+30.2)#187 |
| 28. | Northvale Borough | 35.6% | 9.9%(+25.7)#28 | 5.8%(+29.8)#190 |
| 29. | Closter Borough | 34.9% | 9.9%(+25.0)#29 | 5.8%(+29.1)#196 |
| 30. | Pleasant Plains | 34.9% | 9.9%(+25.0)#30 | 5.8%(+29.1)#199 |
| 31. | Menlo Park Terrace | 34.7% | 9.9%(+24.8)#31 | 5.8%(+28.9)#202 |
| 32. | Franklin Park | 33.1% | 9.9%(+23.3)#32 | 5.8%(+27.4)#224 |
| 33. | Secaucus | 33.0% | 9.9%(+23.1)#33 | 5.8%(+27.3)#225 |
| 34. | Lake Hiawatha | 32.9% | 9.9%(+23.0)#34 | 5.8%(+27.1)#227 |
| 35. | The Hills | 32.8% | 9.9%(+22.9)#35 | 5.8%(+27.0)#228 |
| 36. | Norwood Borough | 31.6% | 9.9%(+21.7)#36 | 5.8%(+25.8)#247 |
| 37. | Tenafly Borough | 31.4% | 9.9%(+21.5)#37 | 5.8%(+25.6)#249 |
| 38. | Alpine Borough | 31.1% | 9.9%(+21.2)#38 | 5.8%(+25.4)#253 |
| 39. | Kendall Park | 30.9% | 9.9%(+21.0)#39 | 5.8%(+25.1)#257 |
| 40. | River Edge Borough | 30.0% | 9.9%(+20.1)#40 | 5.8%(+24.2)#274 |
| 41. | Ridgefield Borough | 29.8% | 9.9%(+19.9)#41 | 5.8%(+24.0)#280 |
| 42. | Blawenburg | 29.5% | 9.9%(+19.6)#42 | 5.8%(+23.7)#287 |
| 43. | Cresskill Borough | 29.2% | 9.9%(+19.4)#43 | 5.8%(+23.5)#293 |
| 44. | Franklin Center | 28.7% | 9.9%(+18.8)#44 | 5.8%(+22.9)#300 |
| 45. | Weston | 27.8% | 9.9%(+17.9)#45 | 5.8%(+22.0)#312 |
| 46. | Bergenfield Borough | 27.4% | 9.9%(+17.5)#46 | 5.8%(+21.6)#322 |
| 47. | Demarest Borough | 26.8% | 9.9%(+16.9)#47 | 5.8%(+21.0)#331 |
| 48. | Six Mile Run | 26.6% | 9.9%(+16.7)#48 | 5.8%(+20.8)#335 |
| 49. | Blackwells Mills | 26.6% | 9.9%(+16.7)#49 | 5.8%(+20.8)#336 |
| 50. | Echelon | 26.3% | 9.9%(+16.4)#50 | 5.8%(+20.5)#347 |
| 51. | Jersey City | 25.8% | 9.9%(+15.9)#51 | 5.8%(+20.0)#358 |
| 52. | Rutgers University-Busch Campus | 25.2% | 9.9%(+15.3)#52 | 5.8%(+19.4)#378 |
| 53. | East Rutherford Borough | 25.1% | 9.9%(+15.2)#53 | 5.8%(+19.3)#379 |
| 54. | Rainbow Lakes | 25.1% | 9.9%(+15.2)#54 | 5.8%(+19.3)#380 |
| 55. | Carteret Borough | 25.0% | 9.9%(+15.1)#55 | 5.8%(+19.2)#384 |
| 56. | Princeton Junction | 24.6% | 9.9%(+14.8)#56 | 5.8%(+18.9)#389 |
| 57. | Greentree | 24.5% | 9.9%(+14.7)#57 | 5.8%(+18.8)#394 |
| 58. | Green Knoll | 24.4% | 9.9%(+14.5)#58 | 5.8%(+18.6)#398 |
| 59. | Connecticut Farms | 24.3% | 9.9%(+14.4)#59 | 5.8%(+18.5)#405 |
| 60. | Paramus Borough | 23.9% | 9.9%(+14.0)#60 | 5.8%(+18.1)#414 |
| 61. | Pine Brook | 23.8% | 9.9%(+14.0)#61 | 5.8%(+18.1)#415 |
| 62. | Morganville | 22.5% | 9.9%(+12.7)#62 | 5.8%(+16.8)#442 |
| 63. | Highland Park Borough | 21.8% | 9.9%(+11.9)#63 | 5.8%(+16.0)#467 |
| 64. | Little Ferry Borough | 21.5% | 9.9%(+11.7)#64 | 5.8%(+15.8)#472 |
| 65. | Madison Park | 21.2% | 9.9%(+11.3)#65 | 5.8%(+15.4)#483 |
| 66. | Somerset | 21.0% | 9.9%(+11.1)#66 | 5.8%(+15.2)#492 |
| 67. | Avenel | 20.8% | 9.9%(+10.9)#67 | 5.8%(+15.0)#502 |
| 68. | Middlebush | 20.5% | 9.9%(+10.7)#68 | 5.8%(+14.8)#507 |
| 69. | New Milford Borough | 20.2% | 9.9%(+10.3)#69 | 5.8%(+14.4)#522 |
| 70. | Kingston Estates | 20.2% | 9.9%(+10.3)#70 | 5.8%(+14.4)#523 |
| 71. | Voorhees | 20.0% | 9.9%(+10.1)#71 | 5.8%(+14.2)#533 |
| 72. | Harrison | 20.0% | 9.9%(+10.1)#72 | 5.8%(+14.2)#536 |
| 73. | Greenwich | 19.7% | 9.9%(+9.87)#73 | 5.8%(+14.0)#544 |
| 74. | Harrington Park Borough | 19.6% | 9.9%(+9.73)#74 | 5.8%(+13.8)#549 |
| 75. | Barnegat Light Borough | 19.3% | 9.9%(+9.44)#75 | 5.8%(+13.5)#565 |
| 76. | Pomona | 19.3% | 9.9%(+9.43)#76 | 5.8%(+13.5)#566 |
| 77. | Princeton | 19.2% | 9.9%(+9.35)#77 | 5.8%(+13.4)#572 |
| 78. | Lyons | 18.9% | 9.9%(+8.98)#78 | 5.8%(+13.1)#588 |
| 79. | Hillsborough | 18.8% | 9.9%(+8.92)#79 | 5.8%(+13.0)#589 |
| 80. | Hope | 18.7% | 9.9%(+8.85)#80 | 5.8%(+12.9)#594 |
| 81. | Wood Ridge Borough | 18.5% | 9.9%(+8.66)#81 | 5.8%(+12.8)#607 |
| 82. | Finderne | 18.3% | 9.9%(+8.47)#82 | 5.8%(+12.6)#616 |
| 83. | Dumont Borough | 18.3% | 9.9%(+8.47)#83 | 5.8%(+12.6)#618 |
| 84. | Fords | 17.9% | 9.9%(+8.02)#84 | 5.8%(+12.1)#641 |
| 85. | Cedar Knolls | 17.8% | 9.9%(+7.92)#85 | 5.8%(+12.0)#648 |
| 86. | Woodbridge | 17.5% | 9.9%(+7.66)#86 | 5.8%(+11.8)#665 |
| 87. | Maywood Borough | 17.4% | 9.9%(+7.49)#87 | 5.8%(+11.6)#678 |
| 88. | Sayreville Borough | 17.3% | 9.9%(+7.37)#88 | 5.8%(+11.5)#688 |
| 89. | South Plainfield Borough | 17.0% | 9.9%(+7.11)#89 | 5.8%(+11.2)#702 |
| 90. | Ellisburg | 16.9% | 9.9%(+7.00)#90 | 5.8%(+11.1)#708 |
| 91. | Raritan Borough | 16.8% | 9.9%(+6.94)#91 | 5.8%(+11.0)#714 |
| 92. | New Providence Borough | 16.5% | 9.9%(+6.59)#92 | 5.8%(+10.7)#733 |
| 93. | Silver Lake Cdp Essex County | 16.4% | 9.9%(+6.55)#93 | 5.8%(+10.7)#735 |
| 94. | Atlantic City | 16.1% | 9.9%(+6.19)#94 | 5.8%(+10.3)#758 |
| 95. | Allendale Borough | 16.0% | 9.9%(+6.17)#95 | 5.8%(+10.3)#760 |
| 96. | Neshanic | 15.8% | 9.9%(+5.97)#96 | 5.8%(+10.1)#775 |
| 97. | Ramapo College Of New Jersey | 15.8% | 9.9%(+5.91)#97 | 5.8%(+10.0)#780 |
| 98. | Rutherford Borough | 15.7% | 9.9%(+5.86)#98 | 5.8%(+9.96)#787 |
| 99. | Colonia | 15.6% | 9.9%(+5.71)#99 | 5.8%(+9.81)#793 |
| 100. | Martinsville | 15.5% | 9.9%(+5.64)#100 | 5.8%(+9.74)#798 |
Common Questions
What are the Top 10 Cities with the Highest Percentage of Asian Population in New Jersey?
Top 10 Cities with the Highest Percentage of Asian Population in New Jersey are:
#1
63.1%
#2
63.1%
#3
62.1%
#4
56.0%
#5
55.2%
#6
54.9%
#7
52.9%
#8
51.8%
#9
42.2%
#10
40.0%
What city has the Highest Percentage of Asian Population in New Jersey?
Belle Mead has the Highest Percentage of Asian Population in New Jersey with 63.1%.
What is the Percentage of Asian Population in the State of New Jersey?
Percentage of Asian Population in New Jersey is 9.9%.
What is the Percentage of Asian Population in the United States?
Percentage of Asian Population in the United States is 5.8%.