Cities with the Highest Percentage of Panamanian Population in New Jersey
RELATED REPORTS & OPTIONS
Panamanian
New Jersey
Compare Cities
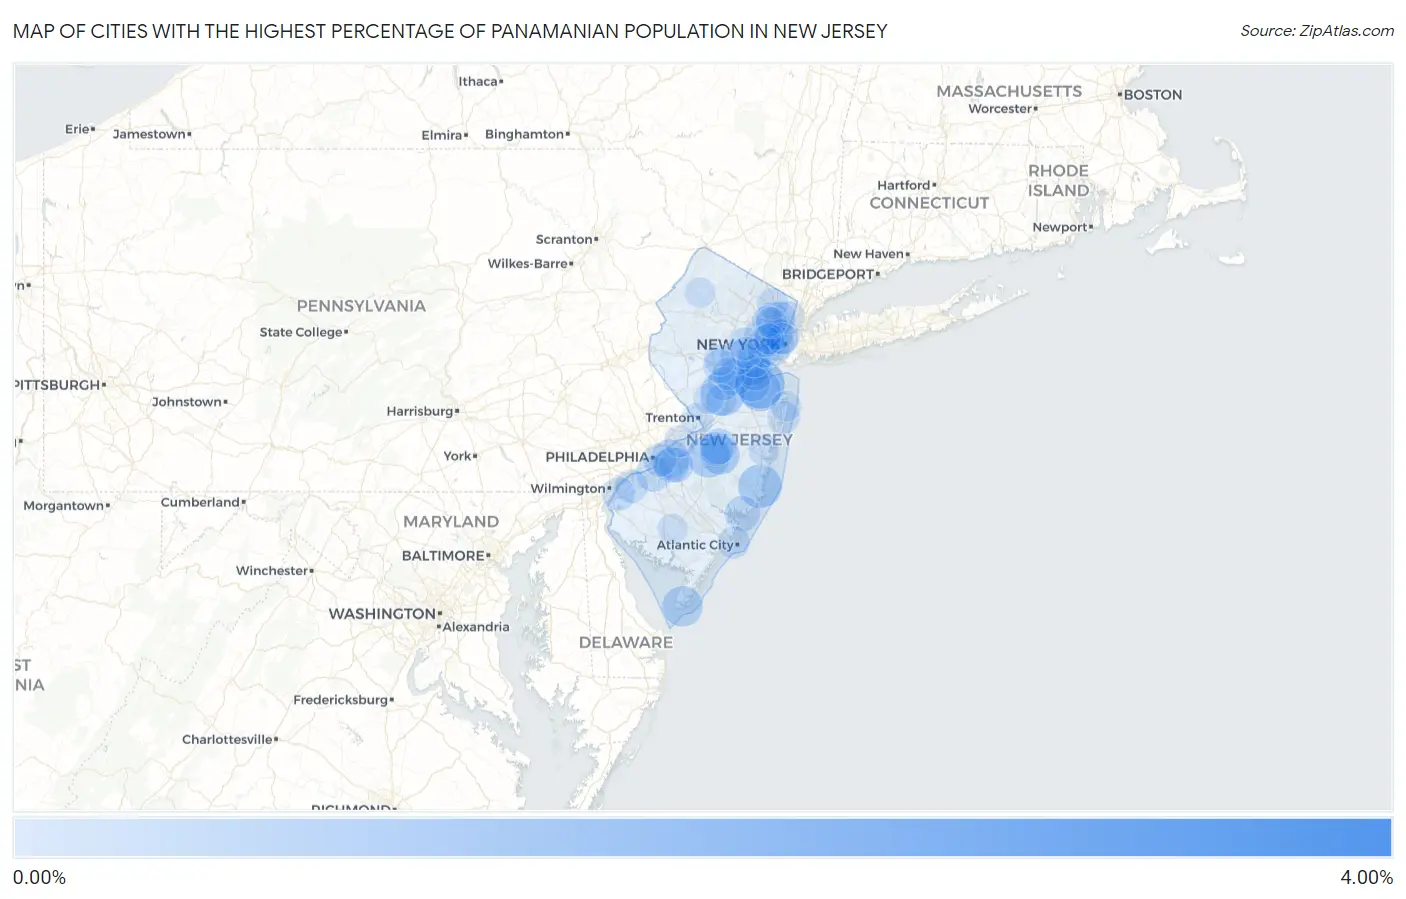
Map of Cities with the Highest Percentage of Panamanian Population in New Jersey
0.00%
4.00%
Cities with the Highest Percentage of Panamanian Population in New Jersey
| City | Panamanian | vs State | vs National | |
| 1. | Liberty Corner | 3.81% | 0.091%(+3.72)#1 | 0.068%(+3.74)#31 |
| 2. | Roselle Park Borough | 1.57% | 0.091%(+1.48)#2 | 0.068%(+1.50)#105 |
| 3. | Middlesex Borough | 1.45% | 0.091%(+1.35)#3 | 0.068%(+1.38)#116 |
| 4. | Cliffwood Beach | 1.26% | 0.091%(+1.17)#4 | 0.068%(+1.20)#137 |
| 5. | Roselle Borough | 1.04% | 0.091%(+0.953)#5 | 0.068%(+0.977)#183 |
| 6. | Monmouth Junction | 0.94% | 0.091%(+0.853)#6 | 0.068%(+0.876)#202 |
| 7. | Barnegat | 0.88% | 0.091%(+0.792)#7 | 0.068%(+0.815)#224 |
| 8. | Pemberton Heights | 0.83% | 0.091%(+0.737)#8 | 0.068%(+0.761)#246 |
| 9. | Strathmore | 0.80% | 0.091%(+0.706)#9 | 0.068%(+0.729)#262 |
| 10. | Cape May | 0.67% | 0.091%(+0.584)#10 | 0.068%(+0.607)#313 |
| 11. | Carteret Borough | 0.66% | 0.091%(+0.569)#11 | 0.068%(+0.592)#317 |
| 12. | Lindenwold Borough | 0.61% | 0.091%(+0.523)#12 | 0.068%(+0.546)#348 |
| 13. | Oaklyn Borough | 0.61% | 0.091%(+0.519)#13 | 0.068%(+0.542)#352 |
| 14. | Browns Mills | 0.60% | 0.091%(+0.505)#14 | 0.068%(+0.529)#356 |
| 15. | Westwood Borough | 0.60% | 0.091%(+0.505)#15 | 0.068%(+0.528)#357 |
| 16. | Cherry Hill Mall | 0.54% | 0.091%(+0.452)#16 | 0.068%(+0.475)#394 |
| 17. | Mount Arlington Borough | 0.51% | 0.091%(+0.421)#17 | 0.068%(+0.444)#421 |
| 18. | Elmwood Park Borough | 0.47% | 0.091%(+0.375)#18 | 0.068%(+0.398)#464 |
| 19. | Chesilhurst Borough | 0.43% | 0.091%(+0.342)#19 | 0.068%(+0.366)#505 |
| 20. | Sayreville Borough | 0.43% | 0.091%(+0.337)#20 | 0.068%(+0.360)#517 |
| 21. | Woodbridge | 0.39% | 0.091%(+0.301)#21 | 0.068%(+0.324)#559 |
| 22. | New Brunswick | 0.39% | 0.091%(+0.297)#22 | 0.068%(+0.320)#566 |
| 23. | Perth Amboy | 0.37% | 0.091%(+0.284)#23 | 0.068%(+0.307)#577 |
| 24. | Mcguire Afb | 0.37% | 0.091%(+0.277)#24 | 0.068%(+0.301)#585 |
| 25. | Woodbury | 0.36% | 0.091%(+0.270)#25 | 0.068%(+0.293)#594 |
| 26. | Barclay | 0.36% | 0.091%(+0.264)#26 | 0.068%(+0.287)#605 |
| 27. | Mystic Island | 0.35% | 0.091%(+0.263)#27 | 0.068%(+0.286)#611 |
| 28. | East Orange | 0.35% | 0.091%(+0.262)#28 | 0.068%(+0.285)#613 |
| 29. | Madison Park | 0.35% | 0.091%(+0.259)#29 | 0.068%(+0.282)#617 |
| 30. | Wallington Borough | 0.35% | 0.091%(+0.255)#30 | 0.068%(+0.279)#624 |
| 31. | Greentree | 0.31% | 0.091%(+0.218)#31 | 0.068%(+0.241)#677 |
| 32. | Union City | 0.30% | 0.091%(+0.209)#32 | 0.068%(+0.233)#699 |
| 33. | Rahway | 0.30% | 0.091%(+0.209)#33 | 0.068%(+0.232)#702 |
| 34. | Plainfield | 0.28% | 0.091%(+0.192)#34 | 0.068%(+0.216)#736 |
| 35. | Stockton University | 0.28% | 0.091%(+0.191)#35 | 0.068%(+0.215)#738 |
| 36. | Oradell Borough | 0.28% | 0.091%(+0.189)#36 | 0.068%(+0.212)#743 |
| 37. | Haledon Borough | 0.28% | 0.091%(+0.188)#37 | 0.068%(+0.212)#747 |
| 38. | Fort Dix | 0.27% | 0.091%(+0.179)#38 | 0.068%(+0.202)#768 |
| 39. | Kearny | 0.25% | 0.091%(+0.157)#39 | 0.068%(+0.180)#805 |
| 40. | Garfield | 0.23% | 0.091%(+0.143)#40 | 0.068%(+0.166)#839 |
| 41. | Jersey City | 0.23% | 0.091%(+0.140)#41 | 0.068%(+0.164)#848 |
| 42. | Preakness | 0.23% | 0.091%(+0.140)#42 | 0.068%(+0.164)#849 |
| 43. | Finderne | 0.22% | 0.091%(+0.130)#43 | 0.068%(+0.153)#882 |
| 44. | Camden | 0.22% | 0.091%(+0.129)#44 | 0.068%(+0.152)#886 |
| 45. | Bound Brook Borough | 0.22% | 0.091%(+0.127)#45 | 0.068%(+0.151)#892 |
| 46. | Beckett | 0.22% | 0.091%(+0.127)#46 | 0.068%(+0.151)#893 |
| 47. | Carneys Point | 0.21% | 0.091%(+0.118)#47 | 0.068%(+0.141)#925 |
| 48. | Raritan Borough | 0.20% | 0.091%(+0.114)#48 | 0.068%(+0.137)#940 |
| 49. | Franklin Park | 0.19% | 0.091%(+0.103)#49 | 0.068%(+0.126)#982 |
| 50. | Englishtown Borough | 0.19% | 0.091%(+0.097)#50 | 0.068%(+0.120)#1,004 |
| 51. | Summit | 0.19% | 0.091%(+0.095)#51 | 0.068%(+0.118)#1,008 |
| 52. | Keyport Borough | 0.18% | 0.091%(+0.090)#52 | 0.068%(+0.113)#1,038 |
| 53. | Metuchen Borough | 0.18% | 0.091%(+0.089)#53 | 0.068%(+0.113)#1,040 |
| 54. | Lake Como Borough | 0.18% | 0.091%(+0.084)#54 | 0.068%(+0.108)#1,065 |
| 55. | Englewood | 0.18% | 0.091%(+0.084)#55 | 0.068%(+0.107)#1,066 |
| 56. | Elizabeth | 0.17% | 0.091%(+0.081)#56 | 0.068%(+0.104)#1,079 |
| 57. | Cliffside Park Borough | 0.17% | 0.091%(+0.077)#57 | 0.068%(+0.101)#1,094 |
| 58. | Glassboro Borough | 0.17% | 0.091%(+0.074)#58 | 0.068%(+0.097)#1,109 |
| 59. | Asbury Park | 0.16% | 0.091%(+0.073)#59 | 0.068%(+0.096)#1,116 |
| 60. | Atlantic City | 0.16% | 0.091%(+0.073)#60 | 0.068%(+0.096)#1,117 |
| 61. | Somerset | 0.16% | 0.091%(+0.070)#61 | 0.068%(+0.093)#1,133 |
| 62. | Trenton | 0.14% | 0.091%(+0.047)#62 | 0.068%(+0.070)#1,215 |
| 63. | Bayonne | 0.13% | 0.091%(+0.038)#63 | 0.068%(+0.061)#1,273 |
| 64. | Hackensack | 0.12% | 0.091%(+0.034)#64 | 0.068%(+0.057)#1,298 |
| 65. | Beverly | 0.12% | 0.091%(+0.029)#65 | 0.068%(+0.052)#1,317 |
| 66. | Chatham Borough | 0.12% | 0.091%(+0.029)#66 | 0.068%(+0.052)#1,320 |
| 67. | Ramsey Borough | 0.12% | 0.091%(+0.024)#67 | 0.068%(+0.048)#1,350 |
| 68. | North Plainfield Borough | 0.11% | 0.091%(+0.024)#68 | 0.068%(+0.047)#1,356 |
| 69. | Secaucus | 0.11% | 0.091%(+0.021)#69 | 0.068%(+0.044)#1,369 |
| 70. | Ridgewood | 0.10% | 0.091%(+0.013)#70 | 0.068%(+0.036)#1,411 |
| 71. | Newark | 0.10% | 0.091%(+0.012)#71 | 0.068%(+0.035)#1,416 |
| 72. | Hawthorne Borough | 0.10% | 0.091%(+0.012)#72 | 0.068%(+0.035)#1,417 |
| 73. | South River Borough | 0.093% | 0.091%(+0.002)#73 | 0.068%(+0.026)#1,482 |
| 74. | Westfield | 0.091% | 0.091%(-0.000)#74 | 0.068%(+0.023)#1,491 |
| 75. | Hoboken | 0.087% | 0.091%(-0.004)#75 | 0.068%(+0.019)#1,521 |
| 76. | Sicklerville | 0.083% | 0.091%(-0.008)#76 | 0.068%(+0.015)#1,552 |
| 77. | Whippany | 0.079% | 0.091%(-0.012)#77 | 0.068%(+0.011)#1,582 |
| 78. | Clifton | 0.078% | 0.091%(-0.013)#78 | 0.068%(+0.010)#1,586 |
| 79. | Martinsville | 0.073% | 0.091%(-0.018)#79 | 0.068%(+0.005)#1,632 |
| 80. | Princeton Meadows | 0.071% | 0.091%(-0.020)#80 | 0.068%(+0.003)#1,649 |
| 81. | Dumont Borough | 0.061% | 0.091%(-0.030)#81 | 0.068%(-0.007)#1,735 |
| 82. | Passaic | 0.056% | 0.091%(-0.035)#82 | 0.068%(-0.012)#1,782 |
| 83. | Toms River | 0.053% | 0.091%(-0.038)#83 | 0.068%(-0.015)#1,800 |
| 84. | Fair Lawn Borough | 0.052% | 0.091%(-0.040)#84 | 0.068%(-0.016)#1,810 |
| 85. | Haddonfield Borough | 0.048% | 0.091%(-0.043)#85 | 0.068%(-0.020)#1,848 |
| 86. | South Plainfield Borough | 0.045% | 0.091%(-0.046)#86 | 0.068%(-0.022)#1,876 |
| 87. | Harrison | 0.042% | 0.091%(-0.049)#87 | 0.068%(-0.026)#1,921 |
| 88. | Newton | 0.036% | 0.091%(-0.055)#88 | 0.068%(-0.032)#1,988 |
| 89. | Princeton | 0.033% | 0.091%(-0.058)#89 | 0.068%(-0.035)#2,015 |
| 90. | Keansburg Borough | 0.031% | 0.091%(-0.060)#90 | 0.068%(-0.037)#2,051 |
| 91. | Long Branch | 0.025% | 0.091%(-0.066)#91 | 0.068%(-0.043)#2,121 |
| 92. | Vineland | 0.018% | 0.091%(-0.073)#92 | 0.068%(-0.050)#2,203 |
| 93. | Fort Lee Borough | 0.018% | 0.091%(-0.073)#93 | 0.068%(-0.050)#2,208 |
Common Questions
What are the Top 10 Cities with the Highest Percentage of Panamanian Population in New Jersey?
Top 10 Cities with the Highest Percentage of Panamanian Population in New Jersey are:
#1
1.26%
#2
0.94%
#3
0.88%
#4
0.83%
#5
0.80%
#6
0.67%
#7
0.60%
#8
0.54%
#9
0.39%
#10
0.39%
What city has the Highest Percentage of Panamanian Population in New Jersey?
Cliffwood Beach has the Highest Percentage of Panamanian Population in New Jersey with 1.26%.
What is the Percentage of Panamanian Population in the State of New Jersey?
Percentage of Panamanian Population in New Jersey is 0.091%.
What is the Percentage of Panamanian Population in the United States?
Percentage of Panamanian Population in the United States is 0.068%.