Cities with the Highest Percentage of Population Employed in Healthcare Support in New Jersey
RELATED REPORTS & OPTIONS
Healthcare Support
New Jersey
Compare Cities
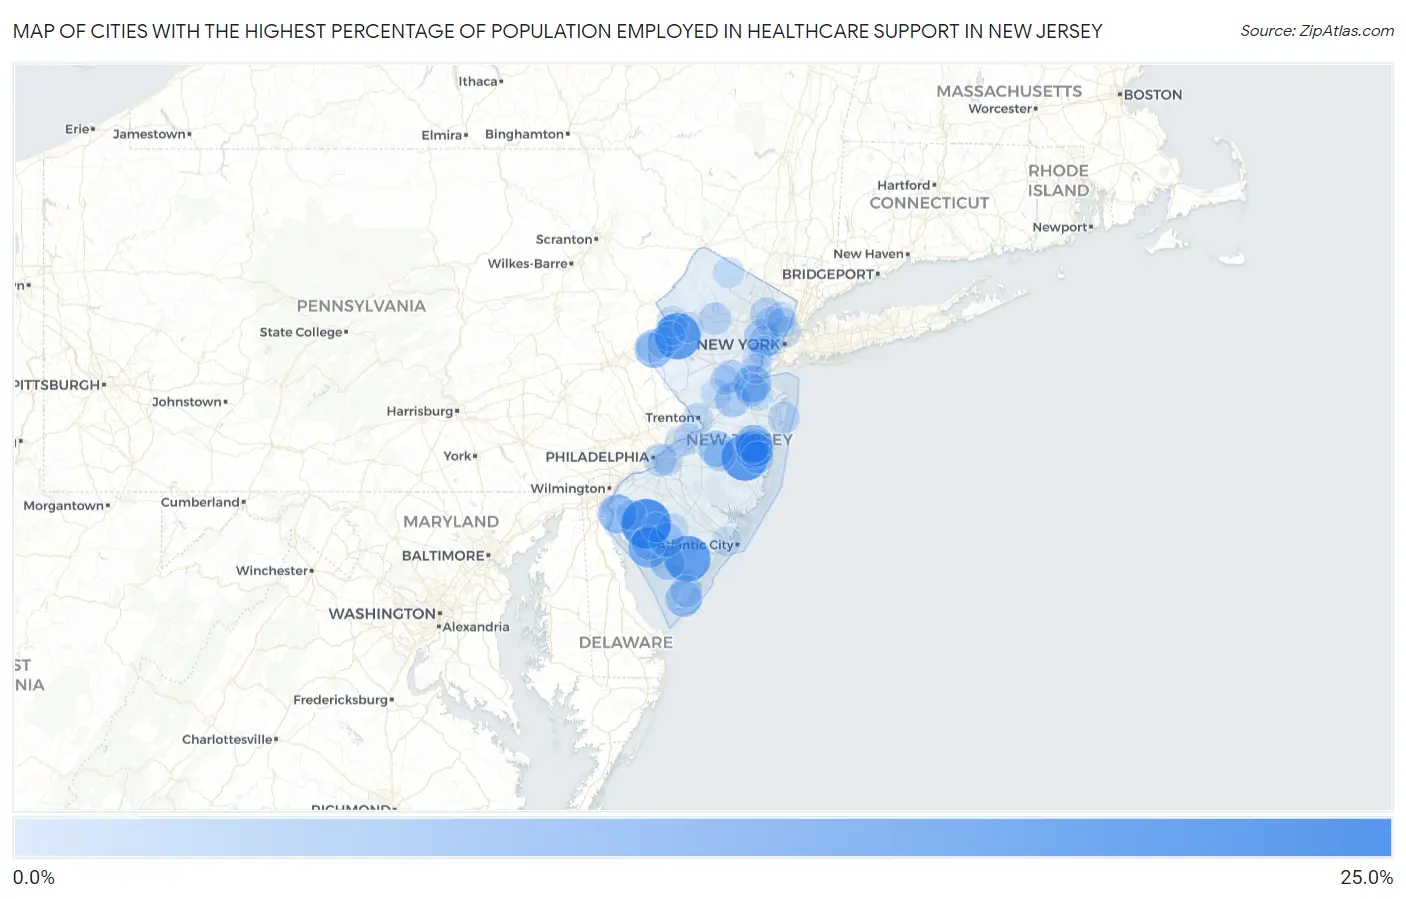
Map of Cities with the Highest Percentage of Population Employed in Healthcare Support in New Jersey
0.0%
25.0%
Cities with the Highest Percentage of Population Employed in Healthcare Support in New Jersey
| City | % Employed | vs State | vs National | |
| 1. | Seabrook Farms | 21.8% | 2.9%(+18.9)#1 | 3.3%(+18.5)#454 |
| 2. | Crestwood Village | 19.2% | 2.9%(+16.3)#2 | 3.3%(+15.9)#599 |
| 3. | Port Colden | 18.8% | 2.9%(+16.0)#3 | 3.3%(+15.6)#613 |
| 4. | Belleplain | 18.6% | 2.9%(+15.7)#4 | 3.3%(+15.3)#629 |
| 5. | Arrowhead Lake | 17.5% | 2.9%(+14.7)#5 | 3.3%(+14.3)#703 |
| 6. | Silver Lake Cdp Essex County | 13.7% | 2.9%(+10.8)#6 | 3.3%(+10.4)#1,175 |
| 7. | Cedarville | 13.6% | 2.9%(+10.7)#7 | 3.3%(+10.3)#1,201 |
| 8. | Brooklawn Borough | 13.2% | 2.9%(+10.3)#8 | 3.3%(+9.89)#1,288 |
| 9. | Leisure Village West | 12.7% | 2.9%(+9.82)#9 | 3.3%(+9.40)#1,399 |
| 10. | Salem | 11.9% | 2.9%(+9.02)#10 | 3.3%(+8.59)#1,617 |
| 11. | Carlls Corner | 11.8% | 2.9%(+8.93)#11 | 3.3%(+8.50)#1,637 |
| 12. | Upper Pohatcong | 11.6% | 2.9%(+8.78)#12 | 3.3%(+8.36)#1,685 |
| 13. | Heislerville | 11.6% | 2.9%(+8.74)#13 | 3.3%(+8.31)#1,696 |
| 14. | Dorothy | 11.5% | 2.9%(+8.63)#14 | 3.3%(+8.21)#1,738 |
| 15. | Cedar Glen West | 11.3% | 2.9%(+8.49)#15 | 3.3%(+8.07)#1,782 |
| 16. | Madison Park | 10.7% | 2.9%(+7.89)#16 | 3.3%(+7.46)#1,998 |
| 17. | Malaga | 10.3% | 2.9%(+7.44)#17 | 3.3%(+7.01)#2,177 |
| 18. | Erma | 9.9% | 2.9%(+7.00)#18 | 3.3%(+6.57)#2,401 |
| 19. | Ocean Gate Borough | 9.6% | 2.9%(+6.77)#19 | 3.3%(+6.35)#2,504 |
| 20. | Fort Dix | 9.5% | 2.9%(+6.63)#20 | 3.3%(+6.20)#2,577 |
| 21. | Windsor | 9.1% | 2.9%(+6.24)#21 | 3.3%(+5.81)#2,771 |
| 22. | Lakeside-Beebe Run | 9.1% | 2.9%(+6.24)#22 | 3.3%(+5.81)#2,780 |
| 23. | Tuckahoe | 9.0% | 2.9%(+6.12)#23 | 3.3%(+5.69)#2,862 |
| 24. | Centre Grove | 8.8% | 2.9%(+5.93)#24 | 3.3%(+5.50)#2,968 |
| 25. | Seaside Heights Borough | 8.6% | 2.9%(+5.70)#25 | 3.3%(+5.27)#3,127 |
| 26. | South Toms River Borough | 8.5% | 2.9%(+5.64)#26 | 3.3%(+5.21)#3,167 |
| 27. | Port Norris | 8.5% | 2.9%(+5.63)#27 | 3.3%(+5.21)#3,168 |
| 28. | Rossmoor | 8.5% | 2.9%(+5.61)#28 | 3.3%(+5.19)#3,195 |
| 29. | Fairton | 8.3% | 2.9%(+5.48)#29 | 3.3%(+5.05)#3,263 |
| 30. | Union | 8.3% | 2.9%(+5.47)#30 | 3.3%(+5.04)#3,298 |
| 31. | Shiloh Borough | 8.3% | 2.9%(+5.42)#31 | 3.3%(+5.00)#3,329 |
| 32. | Dennisville | 8.2% | 2.9%(+5.37)#32 | 3.3%(+4.94)#3,357 |
| 33. | Millville | 8.1% | 2.9%(+5.29)#33 | 3.3%(+4.87)#3,427 |
| 34. | East Orange | 8.1% | 2.9%(+5.21)#34 | 3.3%(+4.79)#3,492 |
| 35. | Port Morris | 7.8% | 2.9%(+4.98)#35 | 3.3%(+4.55)#3,672 |
| 36. | Mauricetown | 7.2% | 2.9%(+4.35)#36 | 3.3%(+3.93)#4,272 |
| 37. | Keansburg Borough | 7.1% | 2.9%(+4.24)#37 | 3.3%(+3.82)#4,379 |
| 38. | West Wildwood Borough | 7.1% | 2.9%(+4.24)#38 | 3.3%(+3.82)#4,381 |
| 39. | East Franklin | 7.1% | 2.9%(+4.23)#39 | 3.3%(+3.80)#4,399 |
| 40. | Pine Lake Park | 7.1% | 2.9%(+4.22)#40 | 3.3%(+3.80)#4,401 |
| 41. | Brownville | 7.0% | 2.9%(+4.16)#41 | 3.3%(+3.74)#4,476 |
| 42. | Leisure Knoll | 7.0% | 2.9%(+4.16)#42 | 3.3%(+3.74)#4,477 |
| 43. | Paterson | 6.9% | 2.9%(+4.05)#43 | 3.3%(+3.62)#4,591 |
| 44. | Camden | 6.9% | 2.9%(+4.02)#44 | 3.3%(+3.60)#4,623 |
| 45. | New Gretna | 6.8% | 2.9%(+3.94)#45 | 3.3%(+3.52)#4,718 |
| 46. | Wrightstown Borough | 6.7% | 2.9%(+3.81)#46 | 3.3%(+3.39)#4,859 |
| 47. | Browns Mills | 6.6% | 2.9%(+3.78)#47 | 3.3%(+3.35)#4,913 |
| 48. | Kenvil | 6.6% | 2.9%(+3.77)#48 | 3.3%(+3.35)#4,923 |
| 49. | Deal Borough | 6.6% | 2.9%(+3.76)#49 | 3.3%(+3.34)#4,933 |
| 50. | Prospect Park Borough | 6.6% | 2.9%(+3.75)#50 | 3.3%(+3.32)#4,947 |
| 51. | Whitesboro | 6.6% | 2.9%(+3.75)#51 | 3.3%(+3.32)#4,954 |
| 52. | Pine Hill Borough | 6.5% | 2.9%(+3.61)#52 | 3.3%(+3.18)#5,122 |
| 53. | Newark | 6.3% | 2.9%(+3.46)#53 | 3.3%(+3.03)#5,338 |
| 54. | Holiday City South | 6.1% | 2.9%(+3.27)#54 | 3.3%(+2.84)#5,593 |
| 55. | Asbury Park | 6.1% | 2.9%(+3.26)#55 | 3.3%(+2.84)#5,613 |
| 56. | Roselle Borough | 6.0% | 2.9%(+3.16)#56 | 3.3%(+2.73)#5,774 |
| 57. | Passaic | 6.0% | 2.9%(+3.14)#57 | 3.3%(+2.72)#5,805 |
| 58. | Penns Grove Borough | 5.9% | 2.9%(+3.09)#58 | 3.3%(+2.66)#5,893 |
| 59. | Milltown Borough | 5.9% | 2.9%(+3.01)#59 | 3.3%(+2.58)#6,014 |
| 60. | Hi Nella Borough | 5.8% | 2.9%(+2.99)#60 | 3.3%(+2.56)#6,048 |
| 61. | Trenton | 5.8% | 2.9%(+2.97)#61 | 3.3%(+2.55)#6,064 |
| 62. | New Village | 5.8% | 2.9%(+2.95)#62 | 3.3%(+2.52)#6,089 |
| 63. | Mountain Lake | 5.7% | 2.9%(+2.88)#63 | 3.3%(+2.46)#6,210 |
| 64. | Golden Triangle | 5.7% | 2.9%(+2.85)#64 | 3.3%(+2.43)#6,262 |
| 65. | Vineland | 5.6% | 2.9%(+2.79)#65 | 3.3%(+2.37)#6,373 |
| 66. | Morganville | 5.6% | 2.9%(+2.79)#66 | 3.3%(+2.37)#6,378 |
| 67. | Guttenberg | 5.6% | 2.9%(+2.78)#67 | 3.3%(+2.35)#6,396 |
| 68. | Rockaway Borough | 5.6% | 2.9%(+2.72)#68 | 3.3%(+2.30)#6,488 |
| 69. | Somerdale Borough | 5.4% | 2.9%(+2.59)#69 | 3.3%(+2.17)#6,694 |
| 70. | Pitman Borough | 5.4% | 2.9%(+2.52)#70 | 3.3%(+2.09)#6,840 |
| 71. | Vernon Center | 5.3% | 2.9%(+2.47)#71 | 3.3%(+2.04)#6,938 |
| 72. | Ampere North | 5.3% | 2.9%(+2.43)#72 | 3.3%(+2.00)#7,008 |
| 73. | Oxford | 5.3% | 2.9%(+2.41)#73 | 3.3%(+1.99)#7,028 |
| 74. | Gouldtown | 5.3% | 2.9%(+2.41)#74 | 3.3%(+1.99)#7,029 |
| 75. | Magnolia Borough | 5.1% | 2.9%(+2.26)#75 | 3.3%(+1.83)#7,342 |
| 76. | Kingston | 5.1% | 2.9%(+2.24)#76 | 3.3%(+1.81)#7,404 |
| 77. | Flagtown | 5.1% | 2.9%(+2.23)#77 | 3.3%(+1.81)#7,414 |
| 78. | Hackensack | 5.1% | 2.9%(+2.23)#78 | 3.3%(+1.81)#7,421 |
| 79. | Beverly | 4.9% | 2.9%(+2.07)#79 | 3.3%(+1.64)#7,785 |
| 80. | Lodi Borough | 4.9% | 2.9%(+2.06)#80 | 3.3%(+1.63)#7,808 |
| 81. | Elizabeth | 4.9% | 2.9%(+2.02)#81 | 3.3%(+1.60)#7,886 |
| 82. | Burlington | 4.9% | 2.9%(+2.02)#82 | 3.3%(+1.59)#7,895 |
| 83. | Highland Park Borough | 4.9% | 2.9%(+2.01)#83 | 3.3%(+1.59)#7,903 |
| 84. | Brass Castle | 4.8% | 2.9%(+1.98)#84 | 3.3%(+1.55)#7,976 |
| 85. | Beattystown | 4.8% | 2.9%(+1.97)#85 | 3.3%(+1.55)#7,978 |
| 86. | Menlo Park Terrace | 4.8% | 2.9%(+1.93)#86 | 3.3%(+1.51)#8,069 |
| 87. | Six Mile Run | 4.8% | 2.9%(+1.90)#87 | 3.3%(+1.48)#8,150 |
| 88. | Alloway | 4.7% | 2.9%(+1.89)#88 | 3.3%(+1.47)#8,167 |
| 89. | Ridgefield Park | 4.7% | 2.9%(+1.89)#89 | 3.3%(+1.47)#8,172 |
| 90. | Linden | 4.7% | 2.9%(+1.88)#90 | 3.3%(+1.46)#8,189 |
| 91. | Longport Borough | 4.7% | 2.9%(+1.87)#91 | 3.3%(+1.45)#8,214 |
| 92. | Ledgewood | 4.7% | 2.9%(+1.83)#92 | 3.3%(+1.41)#8,321 |
| 93. | Pleasantville | 4.7% | 2.9%(+1.82)#93 | 3.3%(+1.40)#8,343 |
| 94. | Westville Borough | 4.7% | 2.9%(+1.80)#94 | 3.3%(+1.38)#8,392 |
| 95. | Sewaren | 4.6% | 2.9%(+1.78)#95 | 3.3%(+1.36)#8,443 |
| 96. | Mckee | 4.6% | 2.9%(+1.76)#96 | 3.3%(+1.33)#8,497 |
| 97. | Pompton Plains | 4.6% | 2.9%(+1.72)#97 | 3.3%(+1.30)#8,576 |
| 98. | Lakehurst Borough | 4.5% | 2.9%(+1.63)#98 | 3.3%(+1.20)#8,792 |
| 99. | Phillipsburg | 4.5% | 2.9%(+1.63)#99 | 3.3%(+1.20)#8,795 |
| 100. | Rosenhayn | 4.5% | 2.9%(+1.61)#100 | 3.3%(+1.18)#8,861 |
Common Questions
What are the Top 10 Cities with the Highest Percentage of Population Employed in Healthcare Support in New Jersey?
Top 10 Cities with the Highest Percentage of Population Employed in Healthcare Support in New Jersey are:
#1
21.8%
#2
19.2%
#3
18.8%
#4
18.6%
#5
13.6%
#6
12.7%
#7
11.9%
#8
11.6%
#9
11.3%
#10
10.7%
What city has the Highest Percentage of Population Employed in Healthcare Support in New Jersey?
Seabrook Farms has the Highest Percentage of Population Employed in Healthcare Support in New Jersey with 21.8%.
What is the Percentage of Population Employed in Healthcare Support in the State of New Jersey?
Percentage of Population Employed in Healthcare Support in New Jersey is 2.9%.
What is the Percentage of Population Employed in Healthcare Support in the United States?
Percentage of Population Employed in Healthcare Support in the United States is 3.3%.