Cities with the Largest Moroccan Community in New Jersey
RELATED REPORTS & OPTIONS
Moroccan
New Jersey
Compare Cities
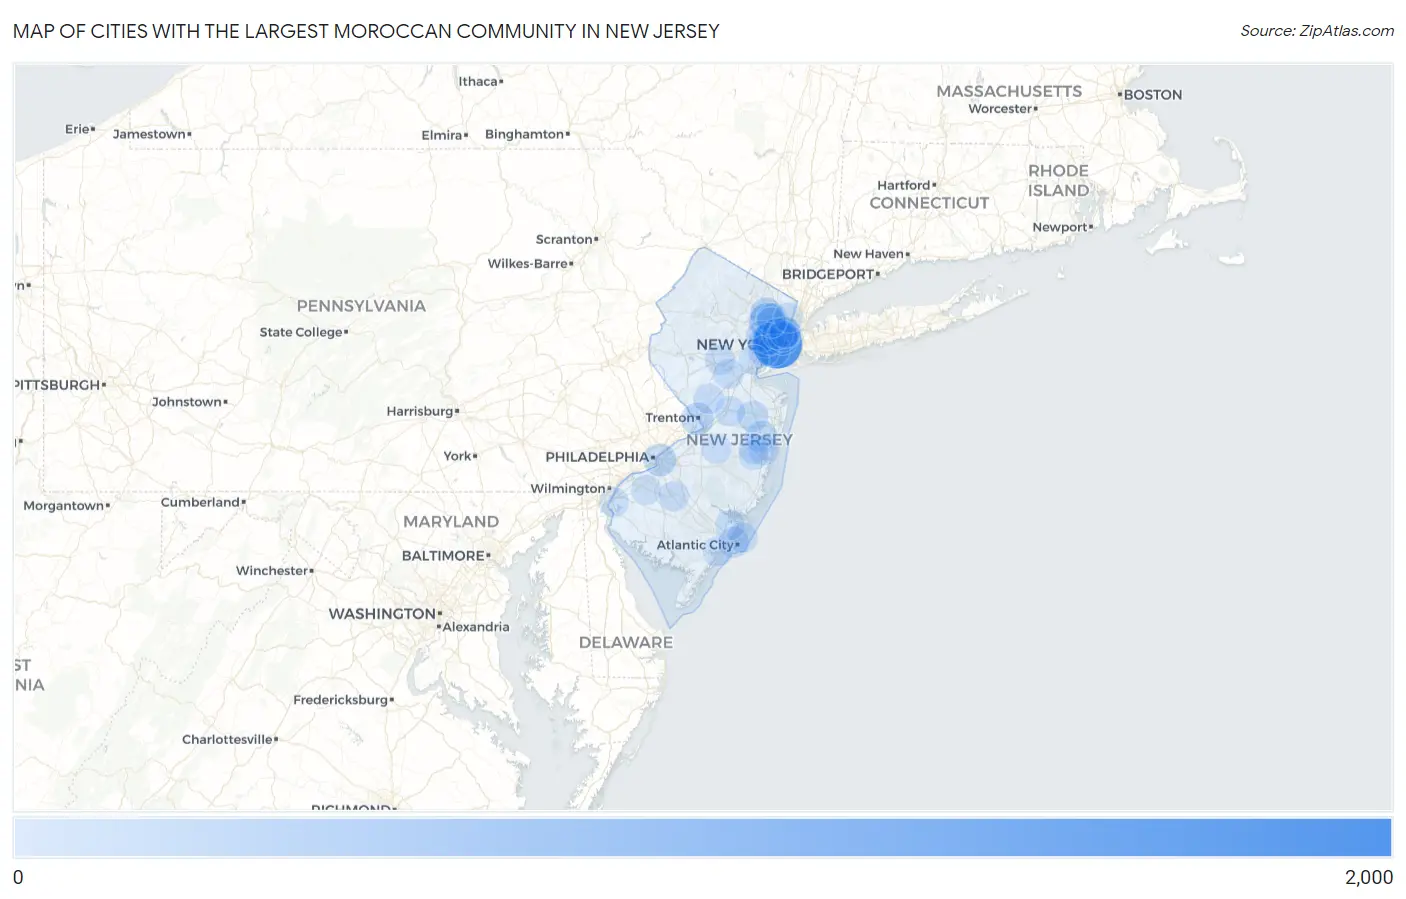
Map of Cities with the Largest Moroccan Community in New Jersey
0
2,000
Cities with the Largest Moroccan Community in New Jersey
| City | Moroccan | vs State | vs National | |
| 1. | Jersey City | 1,882 | 8,738(21.54%)#1 | 130,410(1.44%)#3 |
| 2. | Clifton | 588 | 8,738(6.73%)#2 | 130,410(0.45%)#23 |
| 3. | Kearny | 256 | 8,738(2.93%)#3 | 130,410(0.20%)#75 |
| 4. | Camden | 233 | 8,738(2.67%)#4 | 130,410(0.18%)#85 |
| 5. | Trenton | 231 | 8,738(2.64%)#5 | 130,410(0.18%)#87 |
| 6. | West New York | 215 | 8,738(2.46%)#6 | 130,410(0.16%)#95 |
| 7. | Paterson | 207 | 8,738(2.37%)#7 | 130,410(0.16%)#100 |
| 8. | Bayonne | 206 | 8,738(2.36%)#8 | 130,410(0.16%)#101 |
| 9. | Newark | 202 | 8,738(2.31%)#9 | 130,410(0.15%)#105 |
| 10. | Hoboken | 195 | 8,738(2.23%)#10 | 130,410(0.15%)#111 |
| 11. | Fort Lee Borough | 183 | 8,738(2.09%)#11 | 130,410(0.14%)#119 |
| 12. | Harrison | 134 | 8,738(1.53%)#12 | 130,410(0.10%)#169 |
| 13. | West Freehold | 123 | 8,738(1.41%)#13 | 130,410(0.09%)#177 |
| 14. | Lakewood | 113 | 8,738(1.29%)#14 | 130,410(0.09%)#199 |
| 15. | East Orange | 94 | 8,738(1.08%)#15 | 130,410(0.07%)#246 |
| 16. | Garfield | 94 | 8,738(1.08%)#16 | 130,410(0.07%)#249 |
| 17. | Sayreville Borough | 83 | 8,738(0.95%)#17 | 130,410(0.06%)#283 |
| 18. | Ridgefield Borough | 72 | 8,738(0.82%)#18 | 130,410(0.06%)#328 |
| 19. | Elizabeth | 67 | 8,738(0.77%)#19 | 130,410(0.05%)#345 |
| 20. | Secaucus | 64 | 8,738(0.73%)#20 | 130,410(0.05%)#374 |
| 21. | Macopin | 64 | 8,738(0.73%)#21 | 130,410(0.05%)#376 |
| 22. | River Edge Borough | 63 | 8,738(0.72%)#22 | 130,410(0.05%)#381 |
| 23. | Eatontown Borough | 58 | 8,738(0.66%)#23 | 130,410(0.04%)#401 |
| 24. | Atlantic City | 52 | 8,738(0.60%)#24 | 130,410(0.04%)#438 |
| 25. | Woodcliff Lake Borough | 49 | 8,738(0.56%)#25 | 130,410(0.04%)#464 |
| 26. | Saddle River Borough | 49 | 8,738(0.56%)#26 | 130,410(0.04%)#465 |
| 27. | Pleasantdale | 45 | 8,738(0.51%)#27 | 130,410(0.03%)#501 |
| 28. | Preakness | 44 | 8,738(0.50%)#28 | 130,410(0.03%)#505 |
| 29. | Brigantine | 41 | 8,738(0.47%)#29 | 130,410(0.03%)#533 |
| 30. | North Arlington Borough | 40 | 8,738(0.46%)#30 | 130,410(0.03%)#547 |
| 31. | Williamstown | 40 | 8,738(0.46%)#31 | 130,410(0.03%)#548 |
| 32. | Flemington Borough | 39 | 8,738(0.45%)#32 | 130,410(0.03%)#554 |
| 33. | Sicklerville | 38 | 8,738(0.43%)#33 | 130,410(0.03%)#559 |
| 34. | Waldwick Borough | 38 | 8,738(0.43%)#34 | 130,410(0.03%)#568 |
| 35. | Princeton | 37 | 8,738(0.42%)#35 | 130,410(0.03%)#577 |
| 36. | Union City | 36 | 8,738(0.41%)#36 | 130,410(0.03%)#584 |
| 37. | New Milford Borough | 35 | 8,738(0.40%)#37 | 130,410(0.03%)#611 |
| 38. | Guttenberg | 34 | 8,738(0.39%)#38 | 130,410(0.03%)#623 |
| 39. | Toms River | 29 | 8,738(0.33%)#39 | 130,410(0.02%)#673 |
| 40. | Martinsville | 27 | 8,738(0.31%)#40 | 130,410(0.02%)#707 |
| 41. | Twin Rivers | 26 | 8,738(0.30%)#41 | 130,410(0.02%)#720 |
| 42. | Spring Lake Heights Borough | 25 | 8,738(0.29%)#42 | 130,410(0.02%)#737 |
| 43. | Point Pleasant Borough | 23 | 8,738(0.26%)#43 | 130,410(0.02%)#775 |
| 44. | Norwood Borough | 23 | 8,738(0.26%)#44 | 130,410(0.02%)#781 |
| 45. | Oakland Borough | 22 | 8,738(0.25%)#45 | 130,410(0.02%)#798 |
| 46. | Somerset | 20 | 8,738(0.23%)#46 | 130,410(0.02%)#833 |
| 47. | Westwood Borough | 18 | 8,738(0.21%)#47 | 130,410(0.01%)#882 |
| 48. | East Rutherford Borough | 18 | 8,738(0.21%)#48 | 130,410(0.01%)#884 |
| 49. | Highlands Borough | 18 | 8,738(0.21%)#49 | 130,410(0.01%)#889 |
| 50. | Rahway | 17 | 8,738(0.19%)#50 | 130,410(0.01%)#899 |
| 51. | Pennsville | 16 | 8,738(0.18%)#51 | 130,410(0.01%)#924 |
| 52. | Passaic | 15 | 8,738(0.17%)#52 | 130,410(0.01%)#941 |
| 53. | Fair Lawn Borough | 15 | 8,738(0.17%)#53 | 130,410(0.01%)#948 |
| 54. | Raritan Borough | 15 | 8,738(0.17%)#54 | 130,410(0.01%)#960 |
| 55. | William Paterson University Of New Jersey | 15 | 8,738(0.17%)#55 | 130,410(0.01%)#964 |
| 56. | Spotswood Borough | 14 | 8,738(0.16%)#56 | 130,410(0.01%)#995 |
| 57. | Paramus Borough | 11 | 8,738(0.13%)#57 | 130,410(0.01%)#1,070 |
| 58. | Mullica Hill | 11 | 8,738(0.13%)#58 | 130,410(0.01%)#1,081 |
| 59. | Leisure Village West | 11 | 8,738(0.13%)#59 | 130,410(0.01%)#1,082 |
| 60. | Smithville | 10 | 8,738(0.11%)#60 | 130,410(0.01%)#1,110 |
| 61. | Fort Dix | 10 | 8,738(0.11%)#61 | 130,410(0.01%)#1,113 |
| 62. | Northvale Borough | 10 | 8,738(0.11%)#62 | 130,410(0.01%)#1,118 |
| 63. | Monmouth Beach Borough | 9 | 8,738(0.10%)#63 | 130,410(0.01%)#1,159 |
| 64. | Holiday City Berkeley | 8 | 8,738(0.09%)#64 | 130,410(0.01%)#1,186 |
| 65. | Somers Point | 8 | 8,738(0.09%)#65 | 130,410(0.01%)#1,187 |
| 66. | Englewood | 7 | 8,738(0.08%)#66 | 130,410(0.01%)#1,212 |
| 67. | Gouldtown | 7 | 8,738(0.08%)#67 | 130,410(0.01%)#1,237 |
| 68. | Highland Park Borough | 6 | 8,738(0.07%)#68 | 130,410(0.00%)#1,263 |
| 69. | Haddonfield Borough | 6 | 8,738(0.07%)#69 | 130,410(0.00%)#1,265 |
| 70. | South Plainfield Borough | 4 | 8,738(0.05%)#70 | 130,410(0.00%)#1,340 |
| 71. | Gibbsboro Borough | 4 | 8,738(0.05%)#71 | 130,410(0.00%)#1,350 |
| 72. | Ramapo College Of New Jersey | 4 | 8,738(0.05%)#72 | 130,410(0.00%)#1,351 |
| 73. | Tenafly Borough | 3 | 8,738(0.03%)#73 | 130,410(0.00%)#1,371 |
| 74. | The College Of New Jersey | 3 | 8,738(0.03%)#74 | 130,410(0.00%)#1,373 |
| 75. | Alpine Borough | 3 | 8,738(0.03%)#75 | 130,410(0.00%)#1,383 |
| 76. | Deal Borough | 2 | 8,738(0.02%)#76 | 130,410(0.00%)#1,412 |
| 77. | Lebanon Borough | 1 | 8,738(0.01%)#77 | 130,410(0.00%)#1,431 |
Common Questions
What are the Top 10 Cities with the Largest Moroccan Community in New Jersey?
Top 10 Cities with the Largest Moroccan Community in New Jersey are:
#1
1,882
#2
588
#3
256
#4
233
#5
231
#6
215
#7
207
#8
206
#9
202
#10
195
What city has the Largest Moroccan Community in New Jersey?
Jersey City has the Largest Moroccan Community in New Jersey with 1,882.
What is the Total Moroccan Population in the State of New Jersey?
Total Moroccan Population in New Jersey is 8,738.
What is the Total Moroccan Population in the United States?
Total Moroccan Population in the United States is 130,410.