Cities with the Highest Percentage of Colombian Population in New Jersey
RELATED REPORTS & OPTIONS
Colombian
New Jersey
Compare Cities
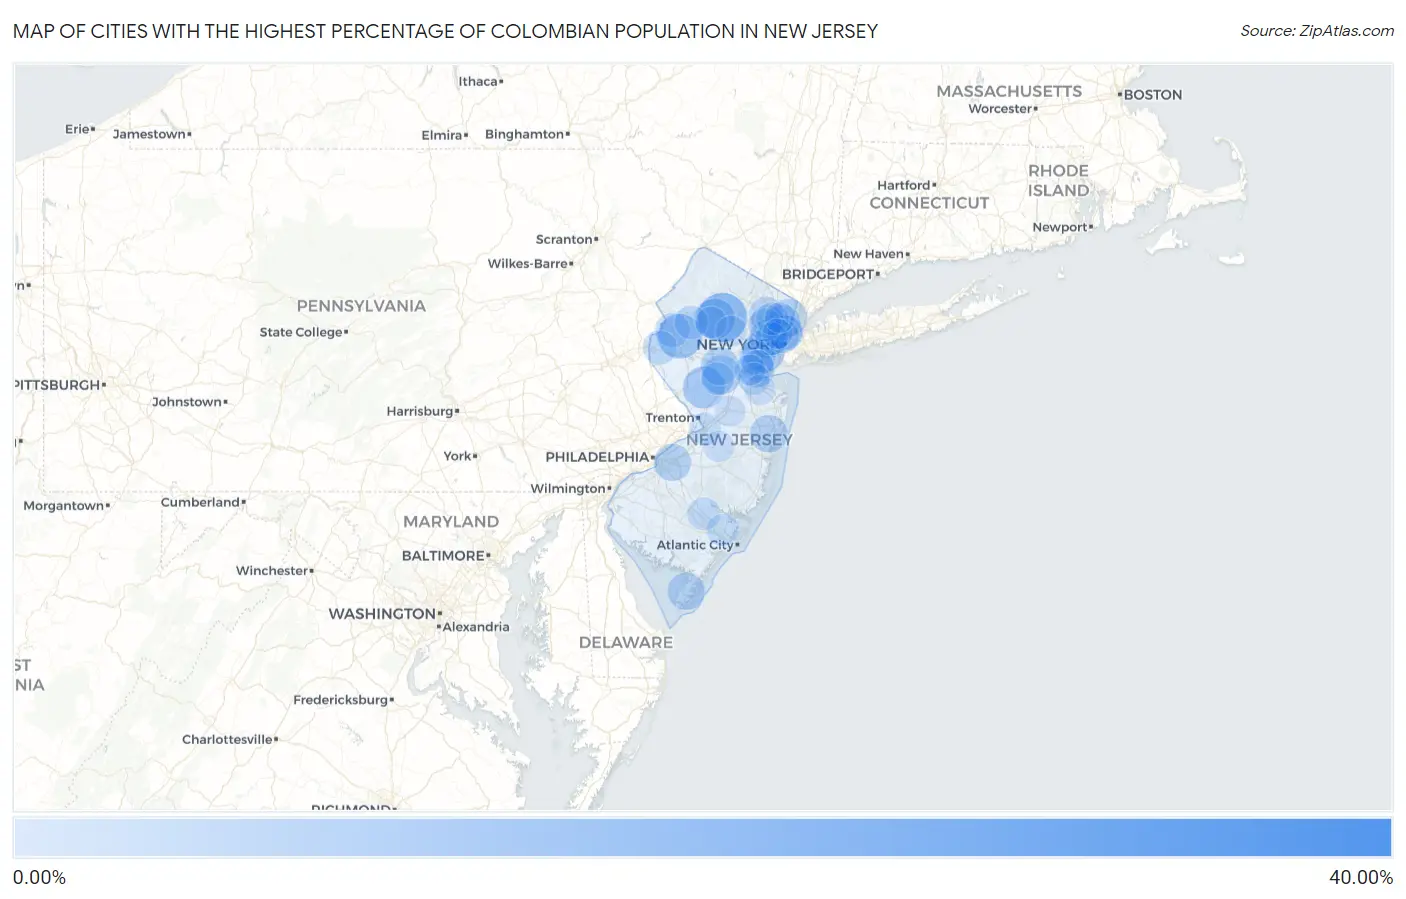
Map of Cities with the Highest Percentage of Colombian Population in New Jersey
0.00%
40.00%
Cities with the Highest Percentage of Colombian Population in New Jersey
| City | Colombian | vs State | vs National | |
| 1. | Victory Gardens Borough | 31.69% | 1.53%(+30.2)#1 | 0.41%(+31.3)#3 |
| 2. | Moonachie Borough | 24.77% | 1.53%(+23.2)#2 | 0.41%(+24.4)#6 |
| 3. | Wharton Borough | 15.69% | 1.53%(+14.2)#3 | 0.41%(+15.3)#13 |
| 4. | Dover | 15.30% | 1.53%(+13.8)#4 | 0.41%(+14.9)#14 |
| 5. | Anderson | 12.05% | 1.53%(+10.5)#5 | 0.41%(+11.6)#26 |
| 6. | Elizabeth | 10.36% | 1.53%(+8.84)#6 | 0.41%(+9.95)#34 |
| 7. | Skillman | 10.10% | 1.53%(+8.57)#7 | 0.41%(+9.69)#36 |
| 8. | Totowa Borough | 9.71% | 1.53%(+8.19)#8 | 0.41%(+9.30)#39 |
| 9. | Kenvil | 9.29% | 1.53%(+7.76)#9 | 0.41%(+8.88)#44 |
| 10. | East Millstone | 8.32% | 1.53%(+6.79)#10 | 0.41%(+7.91)#51 |
| 11. | Harrison | 8.17% | 1.53%(+6.64)#11 | 0.41%(+7.76)#57 |
| 12. | Finderne | 7.75% | 1.53%(+6.23)#12 | 0.41%(+7.34)#64 |
| 13. | Hamburg Borough | 7.51% | 1.53%(+5.99)#13 | 0.41%(+7.10)#65 |
| 14. | Ramtown | 7.29% | 1.53%(+5.76)#14 | 0.41%(+6.88)#72 |
| 15. | Englewood | 7.25% | 1.53%(+5.73)#15 | 0.41%(+6.84)#73 |
| 16. | Whitesboro | 7.13% | 1.53%(+5.60)#16 | 0.41%(+6.72)#75 |
| 17. | Leonia Borough | 7.01% | 1.53%(+5.48)#17 | 0.41%(+6.60)#77 |
| 18. | Kingston Estates | 7.00% | 1.53%(+5.47)#18 | 0.41%(+6.59)#78 |
| 19. | Sewaren | 6.98% | 1.53%(+5.45)#19 | 0.41%(+6.57)#79 |
| 20. | West New York | 6.83% | 1.53%(+5.30)#20 | 0.41%(+6.42)#82 |
| 21. | Bogota Borough | 6.73% | 1.53%(+5.21)#21 | 0.41%(+6.32)#84 |
| 22. | Linden | 6.50% | 1.53%(+4.98)#22 | 0.41%(+6.09)#92 |
| 23. | Lodi Borough | 6.48% | 1.53%(+4.96)#23 | 0.41%(+6.07)#93 |
| 24. | Lebanon Borough | 6.44% | 1.53%(+4.91)#24 | 0.41%(+6.03)#96 |
| 25. | Ridgefield Park | 6.27% | 1.53%(+4.74)#25 | 0.41%(+5.86)#99 |
| 26. | North Plainfield Borough | 6.17% | 1.53%(+4.65)#26 | 0.41%(+5.76)#102 |
| 27. | Prospect Park Borough | 5.54% | 1.53%(+4.01)#27 | 0.41%(+5.13)#119 |
| 28. | Bergenfield Borough | 5.49% | 1.53%(+3.97)#28 | 0.41%(+5.08)#123 |
| 29. | Keyport Borough | 5.48% | 1.53%(+3.96)#29 | 0.41%(+5.07)#125 |
| 30. | Rutherford Borough | 5.40% | 1.53%(+3.87)#30 | 0.41%(+4.99)#128 |
| 31. | Guttenberg | 5.23% | 1.53%(+3.70)#31 | 0.41%(+4.82)#140 |
| 32. | Oxford | 5.20% | 1.53%(+3.68)#32 | 0.41%(+4.79)#143 |
| 33. | Mount Arlington Borough | 5.20% | 1.53%(+3.68)#33 | 0.41%(+4.79)#144 |
| 34. | North Haledon Borough | 4.98% | 1.53%(+3.45)#34 | 0.41%(+4.57)#153 |
| 35. | Paterson | 4.95% | 1.53%(+3.43)#35 | 0.41%(+4.54)#155 |
| 36. | Stewartsville | 4.87% | 1.53%(+3.34)#36 | 0.41%(+4.46)#159 |
| 37. | Clifton | 4.72% | 1.53%(+3.19)#37 | 0.41%(+4.31)#167 |
| 38. | Bedminster | 4.69% | 1.53%(+3.16)#38 | 0.41%(+4.28)#168 |
| 39. | Hackettstown | 4.61% | 1.53%(+3.08)#39 | 0.41%(+4.20)#173 |
| 40. | Union City | 4.58% | 1.53%(+3.05)#40 | 0.41%(+4.17)#175 |
| 41. | Roselle Borough | 4.53% | 1.53%(+3.01)#41 | 0.41%(+4.12)#178 |
| 42. | Neshanic | 4.53% | 1.53%(+3.00)#42 | 0.41%(+4.12)#182 |
| 43. | Dumont Borough | 4.45% | 1.53%(+2.93)#43 | 0.41%(+4.04)#188 |
| 44. | Cresskill Borough | 4.31% | 1.53%(+2.78)#44 | 0.41%(+3.90)#199 |
| 45. | Brookdale | 4.28% | 1.53%(+2.75)#45 | 0.41%(+3.87)#204 |
| 46. | Deal Borough | 4.19% | 1.53%(+2.66)#46 | 0.41%(+3.78)#216 |
| 47. | Little Ferry Borough | 4.14% | 1.53%(+2.61)#47 | 0.41%(+3.73)#221 |
| 48. | Kearny | 4.09% | 1.53%(+2.56)#48 | 0.41%(+3.68)#222 |
| 49. | Elwood | 4.03% | 1.53%(+2.50)#49 | 0.41%(+3.62)#225 |
| 50. | Blackwells Mills | 3.96% | 1.53%(+2.44)#50 | 0.41%(+3.55)#230 |
| 51. | Hasbrouck Heights Borough | 3.92% | 1.53%(+2.40)#51 | 0.41%(+3.51)#234 |
| 52. | Garfield | 3.92% | 1.53%(+2.40)#52 | 0.41%(+3.51)#235 |
| 53. | East Newark Borough | 3.90% | 1.53%(+2.37)#53 | 0.41%(+3.49)#237 |
| 54. | Port Reading | 3.89% | 1.53%(+2.36)#54 | 0.41%(+3.48)#241 |
| 55. | Bordentown | 3.86% | 1.53%(+2.33)#55 | 0.41%(+3.45)#244 |
| 56. | Bound Brook Borough | 3.85% | 1.53%(+2.32)#56 | 0.41%(+3.44)#246 |
| 57. | Elmwood Park Borough | 3.80% | 1.53%(+2.27)#57 | 0.41%(+3.39)#256 |
| 58. | Ridgefield Borough | 3.76% | 1.53%(+2.23)#58 | 0.41%(+3.35)#258 |
| 59. | Madison Borough | 3.69% | 1.53%(+2.17)#59 | 0.41%(+3.28)#266 |
| 60. | Middlesex Borough | 3.65% | 1.53%(+2.12)#60 | 0.41%(+3.24)#272 |
| 61. | Fairview Borough | 3.63% | 1.53%(+2.10)#61 | 0.41%(+3.22)#275 |
| 62. | Alpha Borough | 3.55% | 1.53%(+2.03)#62 | 0.41%(+3.14)#285 |
| 63. | Glen Ridge Borough | 3.55% | 1.53%(+2.03)#63 | 0.41%(+3.14)#286 |
| 64. | South Amboy | 3.50% | 1.53%(+1.98)#64 | 0.41%(+3.09)#288 |
| 65. | Pomona | 3.48% | 1.53%(+1.95)#65 | 0.41%(+3.07)#293 |
| 66. | Wood Ridge Borough | 3.47% | 1.53%(+1.94)#66 | 0.41%(+3.06)#294 |
| 67. | Cliffside Park Borough | 3.46% | 1.53%(+1.93)#67 | 0.41%(+3.05)#295 |
| 68. | Succasunna | 3.38% | 1.53%(+1.85)#68 | 0.41%(+2.97)#304 |
| 69. | Port Morris | 3.34% | 1.53%(+1.82)#69 | 0.41%(+2.93)#308 |
| 70. | Dunellen Borough | 3.28% | 1.53%(+1.75)#70 | 0.41%(+2.87)#318 |
| 71. | Raritan Borough | 3.26% | 1.53%(+1.74)#71 | 0.41%(+2.85)#320 |
| 72. | Flanders | 3.24% | 1.53%(+1.71)#72 | 0.41%(+2.83)#323 |
| 73. | Woodland Park Borough | 3.12% | 1.53%(+1.60)#73 | 0.41%(+2.71)#341 |
| 74. | Somerville Borough | 3.06% | 1.53%(+1.54)#74 | 0.41%(+2.65)#353 |
| 75. | Hightstown Borough | 3.00% | 1.53%(+1.48)#75 | 0.41%(+2.59)#358 |
| 76. | Morristown | 3.00% | 1.53%(+1.47)#76 | 0.41%(+2.59)#359 |
| 77. | Morris Plains Borough | 2.97% | 1.53%(+1.44)#77 | 0.41%(+2.56)#367 |
| 78. | Englewood Cliffs Borough | 2.94% | 1.53%(+1.41)#78 | 0.41%(+2.53)#373 |
| 79. | Mcguire Afb | 2.93% | 1.53%(+1.40)#79 | 0.41%(+2.52)#374 |
| 80. | Bloomingdale Borough | 2.91% | 1.53%(+1.39)#80 | 0.41%(+2.50)#376 |
| 81. | Maywood Borough | 2.84% | 1.53%(+1.31)#81 | 0.41%(+2.43)#386 |
| 82. | Roselle Park Borough | 2.81% | 1.53%(+1.28)#82 | 0.41%(+2.40)#391 |
| 83. | Twin Rivers | 2.80% | 1.53%(+1.27)#83 | 0.41%(+2.39)#392 |
| 84. | Haledon Borough | 2.72% | 1.53%(+1.19)#84 | 0.41%(+2.31)#403 |
| 85. | South Bound Brook Borough | 2.69% | 1.53%(+1.16)#85 | 0.41%(+2.28)#412 |
| 86. | Strathmore | 2.64% | 1.53%(+1.11)#86 | 0.41%(+2.23)#419 |
| 87. | Pompton Lakes Borough | 2.61% | 1.53%(+1.08)#87 | 0.41%(+2.20)#425 |
| 88. | Fords | 2.59% | 1.53%(+1.06)#88 | 0.41%(+2.18)#427 |
| 89. | Palisades Park Borough | 2.52% | 1.53%(+0.995)#89 | 0.41%(+2.11)#438 |
| 90. | Manville Borough | 2.49% | 1.53%(+0.962)#90 | 0.41%(+2.08)#445 |
| 91. | Hackensack | 2.43% | 1.53%(+0.904)#91 | 0.41%(+2.02)#463 |
| 92. | Paramus Borough | 2.41% | 1.53%(+0.881)#92 | 0.41%(+2.00)#467 |
| 93. | Bridgewater Center | 2.36% | 1.53%(+0.832)#93 | 0.41%(+1.95)#479 |
| 94. | West Wildwood Borough | 2.34% | 1.53%(+0.816)#94 | 0.41%(+1.93)#482 |
| 95. | Waldwick Borough | 2.33% | 1.53%(+0.808)#95 | 0.41%(+1.92)#484 |
| 96. | New Milford Borough | 2.32% | 1.53%(+0.795)#96 | 0.41%(+1.91)#487 |
| 97. | Ho Ho Kus Borough | 2.27% | 1.53%(+0.741)#97 | 0.41%(+1.86)#500 |
| 98. | Secaucus | 2.25% | 1.53%(+0.728)#98 | 0.41%(+1.84)#502 |
| 99. | Preakness | 2.23% | 1.53%(+0.706)#99 | 0.41%(+1.82)#507 |
| 100. | Watchung Borough | 2.23% | 1.53%(+0.702)#100 | 0.41%(+1.82)#509 |
Common Questions
What are the Top 10 Cities with the Highest Percentage of Colombian Population in New Jersey?
Top 10 Cities with the Highest Percentage of Colombian Population in New Jersey are:
What city has the Highest Percentage of Colombian Population in New Jersey?
Dover has the Highest Percentage of Colombian Population in New Jersey with 15.30%.
What is the Percentage of Colombian Population in the State of New Jersey?
Percentage of Colombian Population in New Jersey is 1.53%.
What is the Percentage of Colombian Population in the United States?
Percentage of Colombian Population in the United States is 0.41%.