Cities with the Highest Percentage of Mexican Population in New Jersey
RELATED REPORTS & OPTIONS
Mexican
New Jersey
Compare Cities
Map of Cities with the Highest Percentage of Mexican Population in New Jersey
0.00%
50.00%
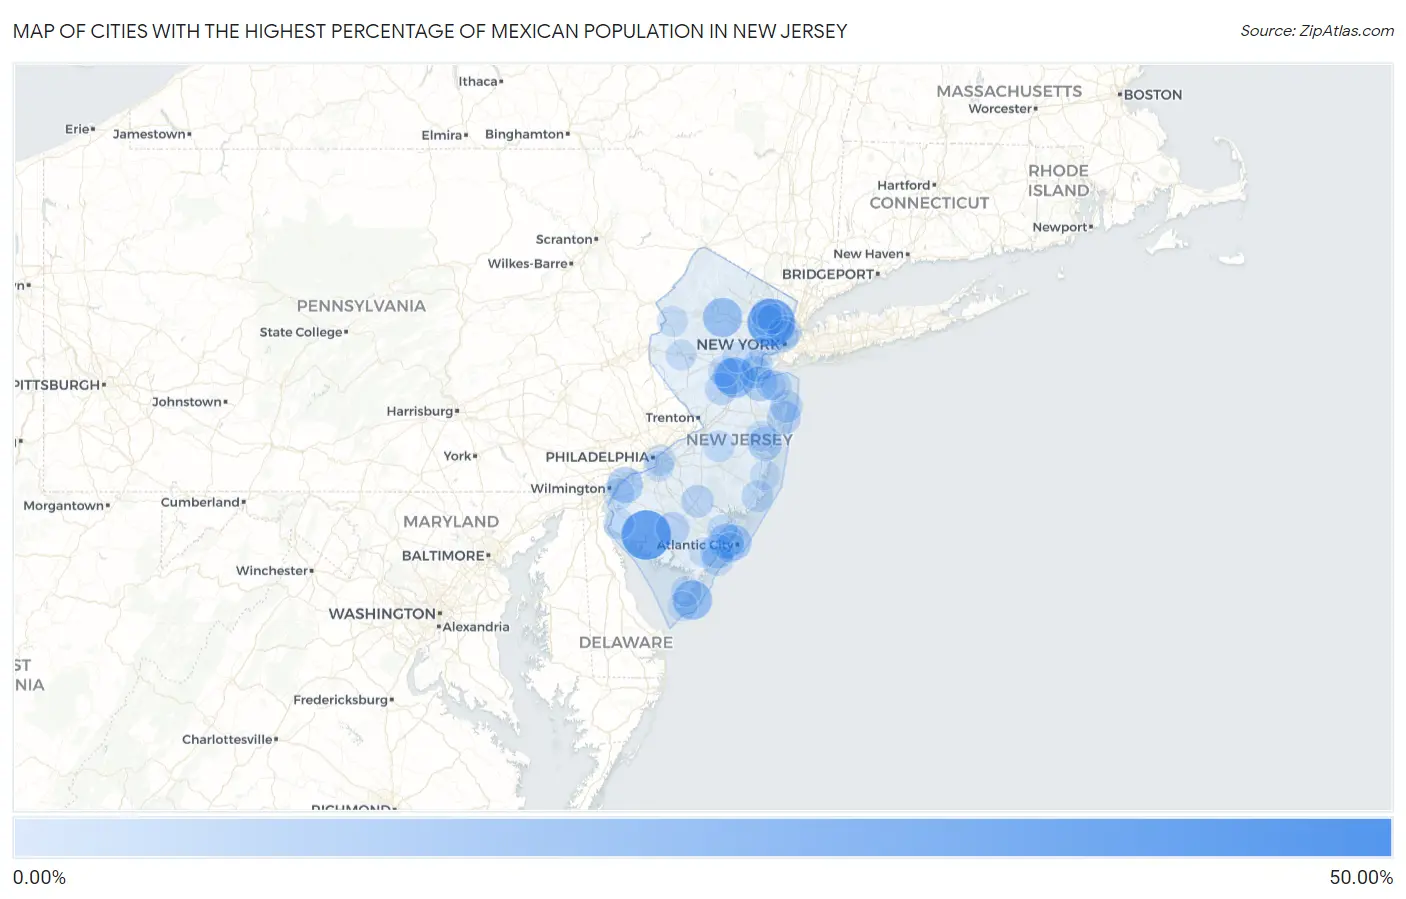
Cities with the Highest Percentage of Mexican Population in New Jersey
| City | Mexican | vs State | vs National | |
| 1. | Roadstown | 42.07% | 2.44%(+39.6)#1 | 11.22%(+30.9)#1,446 |
| 2. | Harrisonville | 40.45% | 2.44%(+38.0)#2 | 11.22%(+29.2)#1,509 |
| 3. | Three Bridges | 37.61% | 2.44%(+35.2)#3 | 11.22%(+26.4)#1,638 |
| 4. | Bridgeton | 33.74% | 2.44%(+31.3)#4 | 11.22%(+22.5)#1,868 |
| 5. | Passaic | 30.59% | 2.44%(+28.1)#5 | 11.22%(+19.4)#2,076 |
| 6. | Freehold Borough | 29.41% | 2.44%(+27.0)#6 | 11.22%(+18.2)#2,166 |
| 7. | New Brunswick | 19.19% | 2.44%(+16.7)#7 | 11.22%(+7.97)#3,189 |
| 8. | Bradley Beach Borough | 19.03% | 2.44%(+16.6)#8 | 11.22%(+7.81)#3,208 |
| 9. | Wildwood | 17.64% | 2.44%(+15.2)#9 | 11.22%(+6.42)#3,405 |
| 10. | Dover | 17.44% | 2.44%(+15.0)#10 | 11.22%(+6.22)#3,439 |
| 11. | Red Bank Borough | 17.29% | 2.44%(+14.8)#11 | 11.22%(+6.07)#3,464 |
| 12. | Arrowhead Lake | 14.56% | 2.44%(+12.1)#12 | 11.22%(+3.34)#3,987 |
| 13. | Pedricktown | 12.53% | 2.44%(+10.1)#13 | 11.22%(+1.32)#4,455 |
| 14. | Woodlynne Borough | 12.33% | 2.44%(+9.89)#14 | 11.22%(+1.11)#4,514 |
| 15. | East Franklin | 12.28% | 2.44%(+9.84)#15 | 11.22%(+1.06)#4,525 |
| 16. | Deal Borough | 12.09% | 2.44%(+9.65)#16 | 11.22%(+0.874)#4,582 |
| 17. | Atlantic City | 12.04% | 2.44%(+9.60)#17 | 11.22%(+0.819)#4,596 |
| 18. | South Bound Brook Borough | 11.99% | 2.44%(+9.55)#18 | 11.22%(+0.769)#4,607 |
| 19. | Swedesboro Borough | 11.90% | 2.44%(+9.46)#19 | 11.22%(+0.680)#4,634 |
| 20. | Gouldtown | 11.71% | 2.44%(+9.27)#20 | 11.22%(+0.495)#4,670 |
| 21. | Pleasantville | 11.71% | 2.44%(+9.26)#21 | 11.22%(+0.487)#4,675 |
| 22. | Point Pleasant Beach Borough | 10.80% | 2.44%(+8.36)#22 | 11.22%(-0.417)#4,962 |
| 23. | Cliffwood Beach | 10.77% | 2.44%(+8.33)#23 | 11.22%(-0.448)#4,975 |
| 24. | Pemberton Borough | 10.24% | 2.44%(+7.80)#24 | 11.22%(-0.980)#5,153 |
| 25. | Lake Como Borough | 10.06% | 2.44%(+7.62)#25 | 11.22%(-1.16)#5,226 |
| 26. | Somers Point | 9.81% | 2.44%(+7.37)#26 | 11.22%(-1.41)#5,327 |
| 27. | Leisure Village | 9.58% | 2.44%(+7.14)#27 | 11.22%(-1.64)#5,420 |
| 28. | Asbury Park | 9.38% | 2.44%(+6.94)#28 | 11.22%(-1.84)#5,506 |
| 29. | Vineland | 9.30% | 2.44%(+6.86)#29 | 11.22%(-1.91)#5,534 |
| 30. | Beach Haven Borough | 9.14% | 2.44%(+6.70)#30 | 11.22%(-2.08)#5,600 |
| 31. | Bound Brook Borough | 8.79% | 2.44%(+6.34)#31 | 11.22%(-2.43)#5,749 |
| 32. | Belmar Borough | 8.52% | 2.44%(+6.08)#32 | 11.22%(-2.69)#5,883 |
| 33. | Shiloh Borough | 8.20% | 2.44%(+5.76)#33 | 11.22%(-3.02)#6,065 |
| 34. | West New York | 8.11% | 2.44%(+5.67)#34 | 11.22%(-3.11)#6,108 |
| 35. | Absecon Highlands | 8.09% | 2.44%(+5.65)#35 | 11.22%(-3.13)#6,122 |
| 36. | West Cape May Borough | 8.09% | 2.44%(+5.65)#36 | 11.22%(-3.13)#6,124 |
| 37. | Cookstown | 7.55% | 2.44%(+5.11)#37 | 11.22%(-3.67)#6,421 |
| 38. | Long Branch | 7.52% | 2.44%(+5.07)#38 | 11.22%(-3.70)#6,435 |
| 39. | South River Borough | 7.35% | 2.44%(+4.91)#39 | 11.22%(-3.87)#6,533 |
| 40. | Hammonton | 7.29% | 2.44%(+4.85)#40 | 11.22%(-3.93)#6,563 |
| 41. | Kendall Park | 7.28% | 2.44%(+4.83)#41 | 11.22%(-3.94)#6,573 |
| 42. | East Newark Borough | 7.21% | 2.44%(+4.77)#42 | 11.22%(-4.01)#6,608 |
| 43. | Perth Amboy | 7.15% | 2.44%(+4.71)#43 | 11.22%(-4.07)#6,637 |
| 44. | Victory Gardens Borough | 7.10% | 2.44%(+4.66)#44 | 11.22%(-4.12)#6,671 |
| 45. | Union City | 6.89% | 2.44%(+4.45)#45 | 11.22%(-4.32)#6,794 |
| 46. | Bellmawr Borough | 6.71% | 2.44%(+4.27)#46 | 11.22%(-4.50)#6,911 |
| 47. | Manahawkin | 6.42% | 2.44%(+3.98)#47 | 11.22%(-4.80)#7,125 |
| 48. | Jamesburg Borough | 6.40% | 2.44%(+3.96)#48 | 11.22%(-4.82)#7,140 |
| 49. | Lindenwold Borough | 6.39% | 2.44%(+3.95)#49 | 11.22%(-4.83)#7,145 |
| 50. | Flemington Borough | 6.29% | 2.44%(+3.85)#50 | 11.22%(-4.93)#7,232 |
| 51. | Springfield | 6.23% | 2.44%(+3.79)#51 | 11.22%(-4.99)#7,279 |
| 52. | Ocean City | 6.15% | 2.44%(+3.71)#52 | 11.22%(-5.06)#7,328 |
| 53. | West Park | 6.09% | 2.44%(+3.65)#53 | 11.22%(-5.13)#7,372 |
| 54. | Port Reading | 6.04% | 2.44%(+3.60)#54 | 11.22%(-5.18)#7,400 |
| 55. | Clifton | 5.82% | 2.44%(+3.38)#55 | 11.22%(-5.40)#7,583 |
| 56. | Mcguire Afb | 5.71% | 2.44%(+3.27)#56 | 11.22%(-5.51)#7,674 |
| 57. | Mount Ephraim Borough | 5.54% | 2.44%(+3.10)#57 | 11.22%(-5.68)#7,832 |
| 58. | Lawnside Borough | 5.52% | 2.44%(+3.08)#58 | 11.22%(-5.69)#7,842 |
| 59. | Carneys Point | 5.49% | 2.44%(+3.05)#59 | 11.22%(-5.72)#7,865 |
| 60. | Prospect Park Borough | 5.22% | 2.44%(+2.78)#60 | 11.22%(-6.00)#8,129 |
| 61. | Hancocks Bridge | 5.17% | 2.44%(+2.73)#61 | 11.22%(-6.05)#8,172 |
| 62. | Franklin Center | 5.16% | 2.44%(+2.72)#62 | 11.22%(-6.06)#8,186 |
| 63. | Vincentown | 5.14% | 2.44%(+2.70)#63 | 11.22%(-6.08)#8,203 |
| 64. | Belford | 5.12% | 2.44%(+2.67)#64 | 11.22%(-6.10)#8,229 |
| 65. | Penns Grove Borough | 5.08% | 2.44%(+2.64)#65 | 11.22%(-6.14)#8,263 |
| 66. | Camden | 5.08% | 2.44%(+2.63)#66 | 11.22%(-6.14)#8,273 |
| 67. | Buena Borough | 5.04% | 2.44%(+2.60)#67 | 11.22%(-6.18)#8,311 |
| 68. | Paterson | 5.04% | 2.44%(+2.59)#68 | 11.22%(-6.18)#8,315 |
| 69. | North Haledon Borough | 4.98% | 2.44%(+2.54)#69 | 11.22%(-6.24)#8,379 |
| 70. | Wharton Borough | 4.91% | 2.44%(+2.46)#70 | 11.22%(-6.31)#8,442 |
| 71. | Whitesboro | 4.81% | 2.44%(+2.36)#71 | 11.22%(-6.41)#8,545 |
| 72. | Mountain Lake | 4.79% | 2.44%(+2.35)#72 | 11.22%(-6.43)#8,567 |
| 73. | Lakewood | 4.78% | 2.44%(+2.34)#73 | 11.22%(-6.44)#8,576 |
| 74. | Clinton | 4.72% | 2.44%(+2.28)#74 | 11.22%(-6.50)#8,649 |
| 75. | Somerville Borough | 4.69% | 2.44%(+2.25)#75 | 11.22%(-6.53)#8,678 |
| 76. | Magnolia Borough | 4.65% | 2.44%(+2.21)#76 | 11.22%(-6.57)#8,723 |
| 77. | East Rutherford Borough | 4.64% | 2.44%(+2.20)#77 | 11.22%(-6.58)#8,739 |
| 78. | Keansburg Borough | 4.61% | 2.44%(+2.17)#78 | 11.22%(-6.61)#8,773 |
| 79. | Gloucester City | 4.57% | 2.44%(+2.13)#79 | 11.22%(-6.65)#8,817 |
| 80. | Seaside Heights Borough | 4.54% | 2.44%(+2.10)#80 | 11.22%(-6.68)#8,859 |
| 81. | Stockton University | 4.45% | 2.44%(+2.00)#81 | 11.22%(-6.77)#8,954 |
| 82. | Pomona | 4.42% | 2.44%(+1.97)#82 | 11.22%(-6.80)#8,989 |
| 83. | Frenchtown Borough | 4.33% | 2.44%(+1.89)#83 | 11.22%(-6.89)#9,083 |
| 84. | Jobstown | 4.20% | 2.44%(+1.75)#84 | 11.22%(-7.02)#9,240 |
| 85. | Palmyra Borough | 4.13% | 2.44%(+1.69)#85 | 11.22%(-7.09)#9,314 |
| 86. | Garfield | 4.04% | 2.44%(+1.60)#86 | 11.22%(-7.18)#9,414 |
| 87. | Englishtown Borough | 3.95% | 2.44%(+1.50)#87 | 11.22%(-7.27)#9,505 |
| 88. | North Middletown | 3.86% | 2.44%(+1.42)#88 | 11.22%(-7.36)#9,608 |
| 89. | Folsom Borough | 3.80% | 2.44%(+1.36)#89 | 11.22%(-7.41)#9,682 |
| 90. | Chester Borough | 3.72% | 2.44%(+1.27)#90 | 11.22%(-7.50)#9,795 |
| 91. | Stratford Borough | 3.71% | 2.44%(+1.26)#91 | 11.22%(-7.51)#9,808 |
| 92. | Paulsboro Borough | 3.70% | 2.44%(+1.25)#92 | 11.22%(-7.52)#9,827 |
| 93. | Dunellen Borough | 3.69% | 2.44%(+1.24)#93 | 11.22%(-7.53)#9,836 |
| 94. | Plainfield | 3.68% | 2.44%(+1.24)#94 | 11.22%(-7.53)#9,837 |
| 95. | Cape May | 3.59% | 2.44%(+1.15)#95 | 11.22%(-7.63)#9,993 |
| 96. | Corbin City | 3.59% | 2.44%(+1.15)#96 | 11.22%(-7.63)#9,997 |
| 97. | Forked River | 3.58% | 2.44%(+1.14)#97 | 11.22%(-7.64)#10,009 |
| 98. | Ventnor City | 3.50% | 2.44%(+1.06)#98 | 11.22%(-7.72)#10,114 |
| 99. | Flanders | 3.46% | 2.44%(+1.02)#99 | 11.22%(-7.76)#10,180 |
| 100. | Elizabeth | 3.44% | 2.44%(+0.998)#100 | 11.22%(-7.78)#10,211 |
Common Questions
What are the Top 10 Cities with the Highest Percentage of Mexican Population in New Jersey?
Top 10 Cities with the Highest Percentage of Mexican Population in New Jersey are:
#1
33.74%
#2
30.59%
#3
19.19%
#4
17.64%
#5
17.44%
#6
12.53%
#7
12.28%
#8
12.04%
#9
11.71%
#10
10.77%
What city has the Highest Percentage of Mexican Population in New Jersey?
Bridgeton has the Highest Percentage of Mexican Population in New Jersey with 33.74%.
What is the Percentage of Mexican Population in the State of New Jersey?
Percentage of Mexican Population in New Jersey is 2.44%.
What is the Percentage of Mexican Population in the United States?
Percentage of Mexican Population in the United States is 11.22%.