Cities with the Most Immigrants from Dominica in New Jersey
RELATED REPORTS & OPTIONS
Dominica
New Jersey
Compare Cities
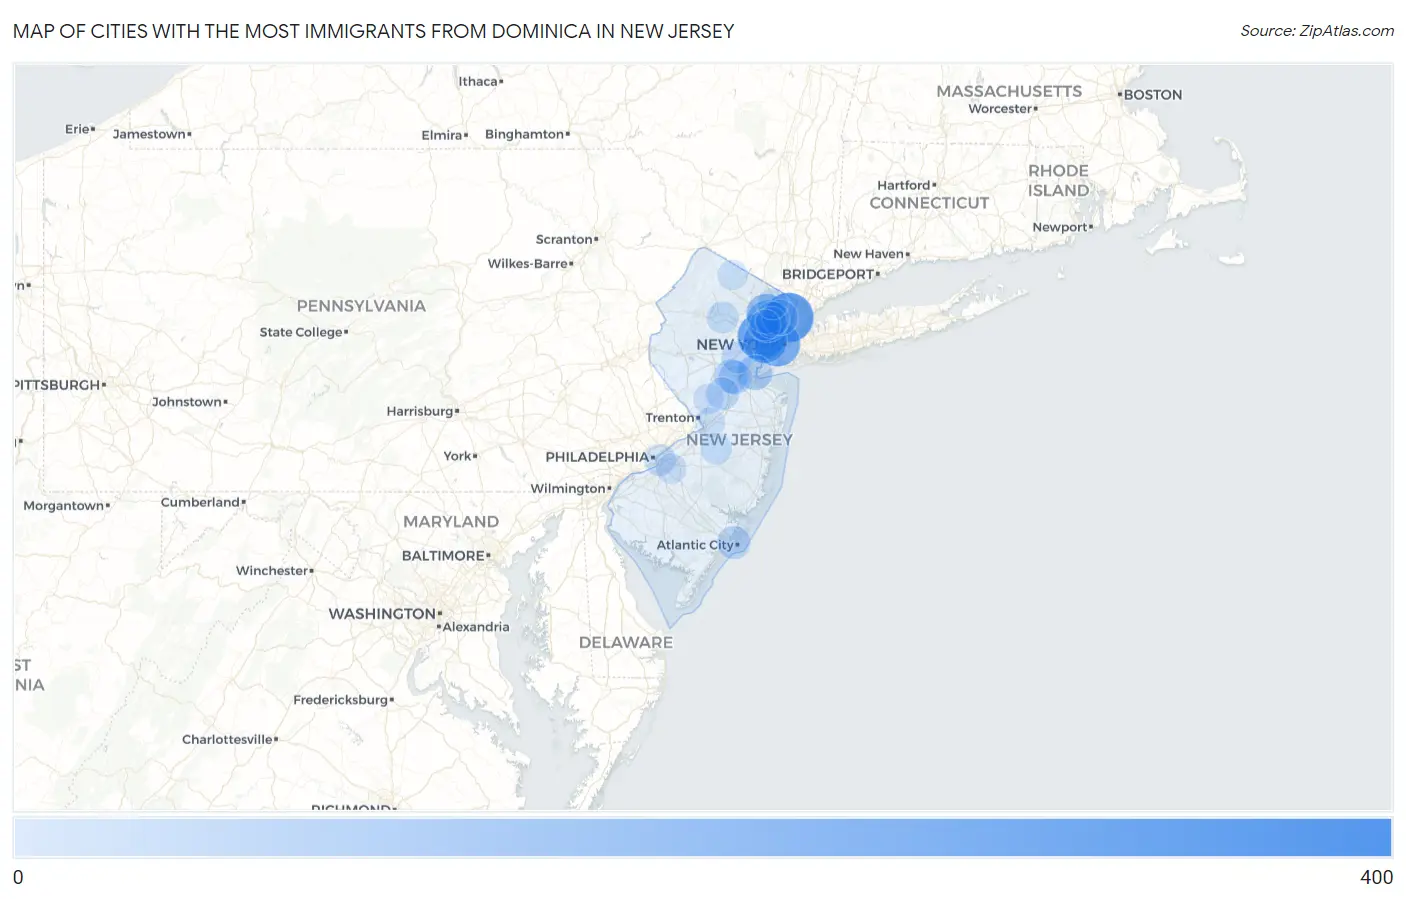
Map of Cities with the Most Immigrants from Dominica in New Jersey
0
400
Cities with the Most Immigrants from Dominica in New Jersey
| City | Dominica | vs State | vs National | |
| 1. | Sayreville Borough | 314 | 3,359(9.35%)#1 | 33,030(0.95%)#11 |
| 2. | Englewood | 269 | 3,359(8.01%)#2 | 33,030(0.81%)#16 |
| 3. | East Orange | 236 | 3,359(7.03%)#3 | 33,030(0.71%)#20 |
| 4. | Jersey City | 212 | 3,359(6.31%)#4 | 33,030(0.64%)#24 |
| 5. | North Plainfield Borough | 191 | 3,359(5.69%)#5 | 33,030(0.58%)#30 |
| 6. | Newark | 187 | 3,359(5.57%)#6 | 33,030(0.57%)#31 |
| 7. | Clifton | 158 | 3,359(4.70%)#7 | 33,030(0.48%)#37 |
| 8. | Paterson | 133 | 3,359(3.96%)#8 | 33,030(0.40%)#42 |
| 9. | Bergenfield Borough | 119 | 3,359(3.54%)#9 | 33,030(0.36%)#49 |
| 10. | Ridgefield Borough | 87 | 3,359(2.59%)#10 | 33,030(0.26%)#63 |
| 11. | Hackensack | 73 | 3,359(2.17%)#11 | 33,030(0.22%)#69 |
| 12. | Perth Amboy | 69 | 3,359(2.05%)#12 | 33,030(0.21%)#73 |
| 13. | Garfield | 53 | 3,359(1.58%)#13 | 33,030(0.16%)#99 |
| 14. | East Franklin | 52 | 3,359(1.55%)#14 | 33,030(0.16%)#104 |
| 15. | New Brunswick | 49 | 3,359(1.46%)#15 | 33,030(0.15%)#108 |
| 16. | Rutgers University-Busch Campus | 44 | 3,359(1.31%)#16 | 33,030(0.13%)#117 |
| 17. | Rockaway Borough | 43 | 3,359(1.28%)#17 | 33,030(0.13%)#122 |
| 18. | Atlantic City | 41 | 3,359(1.22%)#18 | 33,030(0.12%)#127 |
| 19. | Monmouth Junction | 38 | 3,359(1.13%)#19 | 33,030(0.12%)#137 |
| 20. | Bogota Borough | 37 | 3,359(1.10%)#20 | 33,030(0.11%)#140 |
| 21. | Leonia Borough | 33 | 3,359(0.98%)#21 | 33,030(0.10%)#153 |
| 22. | Wallington Borough | 28 | 3,359(0.83%)#22 | 33,030(0.08%)#179 |
| 23. | Plainfield | 26 | 3,359(0.77%)#23 | 33,030(0.08%)#190 |
| 24. | Vauxhall | 24 | 3,359(0.71%)#24 | 33,030(0.07%)#200 |
| 25. | Washington Borough | 22 | 3,359(0.65%)#25 | 33,030(0.07%)#210 |
| 26. | Dover | 21 | 3,359(0.63%)#26 | 33,030(0.06%)#217 |
| 27. | Prospect Park Borough | 20 | 3,359(0.60%)#27 | 33,030(0.06%)#226 |
| 28. | Camden | 19 | 3,359(0.57%)#28 | 33,030(0.06%)#232 |
| 29. | Fort Dix | 14 | 3,359(0.42%)#29 | 33,030(0.04%)#267 |
| 30. | Madison Borough | 13 | 3,359(0.39%)#30 | 33,030(0.04%)#273 |
| 31. | Passaic | 12 | 3,359(0.36%)#31 | 33,030(0.04%)#279 |
| 32. | Ridgewood | 12 | 3,359(0.36%)#32 | 33,030(0.04%)#283 |
| 33. | Fort Lee Borough | 10 | 3,359(0.30%)#33 | 33,030(0.03%)#296 |
| 34. | Brookdale | 7 | 3,359(0.21%)#34 | 33,030(0.02%)#323 |
| 35. | Rutgers University-Livingston Campus | 7 | 3,359(0.21%)#35 | 33,030(0.02%)#324 |
| 36. | Princeton | 6 | 3,359(0.18%)#36 | 33,030(0.02%)#327 |
| 37. | Ashland | 6 | 3,359(0.18%)#37 | 33,030(0.02%)#330 |
| 38. | Kean University | 3 | 3,359(0.09%)#38 | 33,030(0.01%)#357 |
| 39. | Lodi Borough | 2 | 3,359(0.06%)#39 | 33,030(0.01%)#358 |
| 40. | West Long Branch Borough | 2 | 3,359(0.06%)#40 | 33,030(0.01%)#360 |
| 41. | Oakland Borough | 1 | 3,359(0.03%)#41 | 33,030(0.00%)#366 |
| 42. | Bellmawr Borough | 1 | 3,359(0.03%)#42 | 33,030(0.00%)#367 |
| 43. | Yardville | 1 | 3,359(0.03%)#43 | 33,030(0.00%)#368 |
| 44. | Highland Lakes | 1 | 3,359(0.03%)#44 | 33,030(0.00%)#369 |
Common Questions
What are the Top 10 Cities with the Most Immigrants from Dominica in New Jersey?
Top 10 Cities with the Most Immigrants from Dominica in New Jersey are:
#1
269
#2
236
#3
212
#4
187
#5
158
#6
133
#7
73
#8
69
#9
53
#10
52
What city has the Most Immigrants from Dominica in New Jersey?
Englewood has the Most Immigrants from Dominica in New Jersey with 269.
What is the Total Immigrants from Dominica in the State of New Jersey?
Total Immigrants from Dominica in New Jersey is 3,359.
What is the Total Immigrants from Dominica in the United States?
Total Immigrants from Dominica in the United States is 33,030.