Cities with the Most Immigrants from Brazil in New Jersey
RELATED REPORTS & OPTIONS
Brazil
New Jersey
Compare Cities
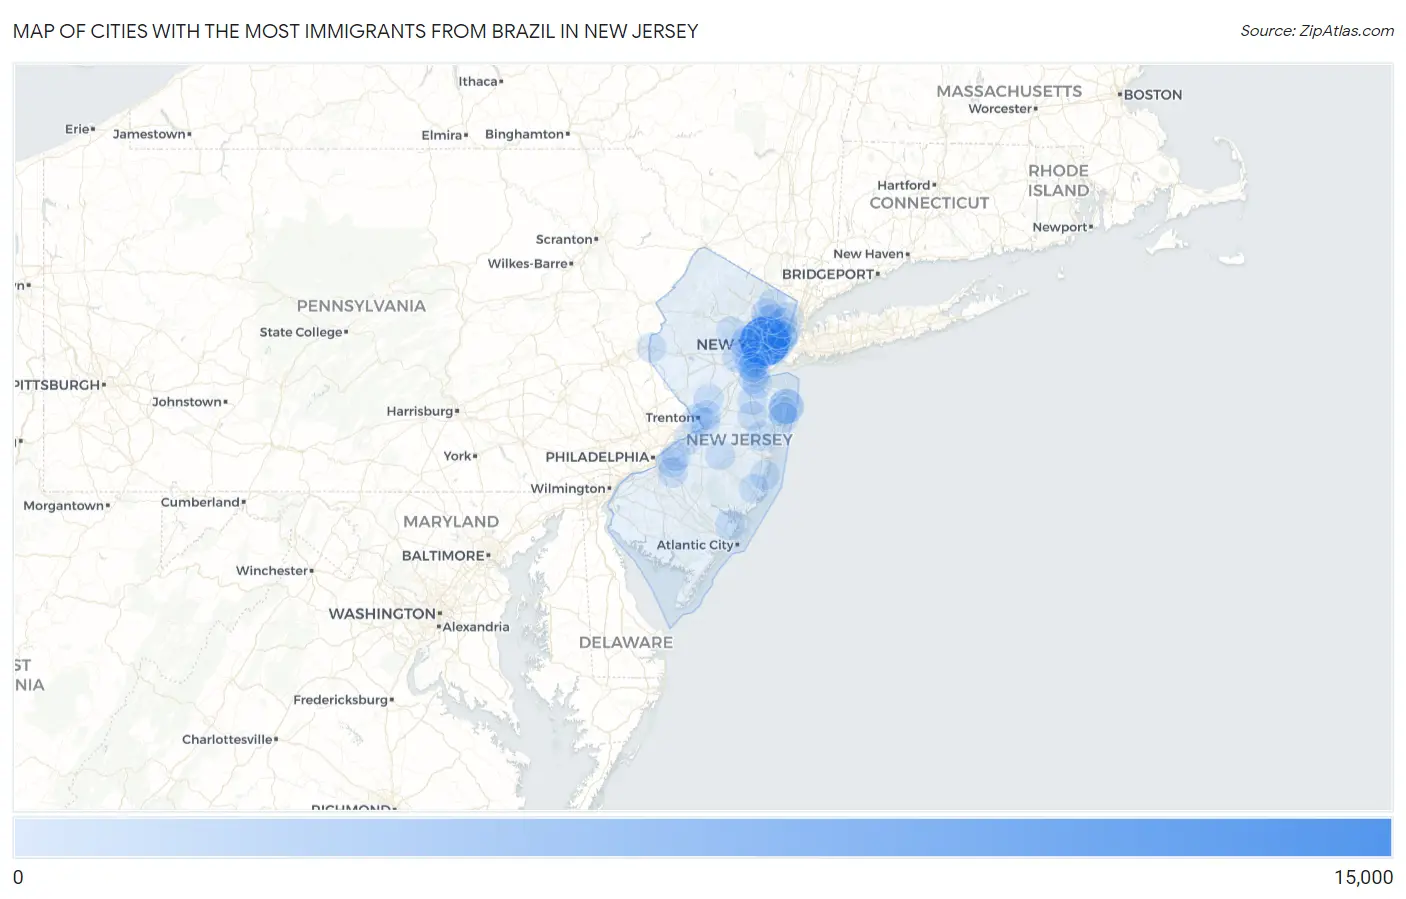
Map of Cities with the Most Immigrants from Brazil in New Jersey
0
15,000
Cities with the Most Immigrants from Brazil in New Jersey
| City | Brazil | vs State | vs National | |
| 1. | Newark | 13,292 | 46,020(28.88%)#1 | 552,373(2.41%)#2 |
| 2. | Long Branch | 3,162 | 46,020(6.87%)#2 | 552,373(0.57%)#25 |
| 3. | Elizabeth | 2,521 | 46,020(5.48%)#3 | 552,373(0.46%)#29 |
| 4. | Kearny | 2,114 | 46,020(4.59%)#4 | 552,373(0.38%)#33 |
| 5. | Jersey City | 830 | 46,020(1.80%)#5 | 552,373(0.15%)#81 |
| 6. | Cliffside Park Borough | 812 | 46,020(1.76%)#6 | 552,373(0.15%)#88 |
| 7. | Harrison | 510 | 46,020(1.11%)#7 | 552,373(0.09%)#151 |
| 8. | Clifton | 504 | 46,020(1.10%)#8 | 552,373(0.09%)#153 |
| 9. | Sayreville Borough | 411 | 46,020(0.89%)#9 | 552,373(0.07%)#192 |
| 10. | South River Borough | 349 | 46,020(0.76%)#10 | 552,373(0.06%)#226 |
| 11. | North Arlington Borough | 331 | 46,020(0.72%)#11 | 552,373(0.06%)#236 |
| 12. | Roselle Borough | 325 | 46,020(0.71%)#12 | 552,373(0.06%)#242 |
| 13. | Paterson | 279 | 46,020(0.61%)#13 | 552,373(0.05%)#282 |
| 14. | Hoboken | 264 | 46,020(0.57%)#14 | 552,373(0.05%)#300 |
| 15. | Rahway | 263 | 46,020(0.57%)#15 | 552,373(0.05%)#301 |
| 16. | Englewood | 247 | 46,020(0.54%)#16 | 552,373(0.04%)#325 |
| 17. | Colonia | 229 | 46,020(0.50%)#17 | 552,373(0.04%)#347 |
| 18. | Watchung Borough | 225 | 46,020(0.49%)#18 | 552,373(0.04%)#355 |
| 19. | West New York | 203 | 46,020(0.44%)#19 | 552,373(0.04%)#390 |
| 20. | Eatontown Borough | 199 | 46,020(0.43%)#20 | 552,373(0.04%)#397 |
| 21. | East Newark Borough | 199 | 46,020(0.43%)#21 | 552,373(0.04%)#398 |
| 22. | Plainfield | 187 | 46,020(0.41%)#22 | 552,373(0.03%)#412 |
| 23. | Lodi Borough | 181 | 46,020(0.39%)#23 | 552,373(0.03%)#424 |
| 24. | Westfield | 177 | 46,020(0.38%)#24 | 552,373(0.03%)#431 |
| 25. | Fair Lawn Borough | 175 | 46,020(0.38%)#25 | 552,373(0.03%)#435 |
| 26. | Fort Lee Borough | 173 | 46,020(0.38%)#26 | 552,373(0.03%)#439 |
| 27. | Bayonne | 160 | 46,020(0.35%)#27 | 552,373(0.03%)#466 |
| 28. | Linden | 159 | 46,020(0.35%)#28 | 552,373(0.03%)#470 |
| 29. | Echelon | 154 | 46,020(0.33%)#29 | 552,373(0.03%)#481 |
| 30. | The Hills | 147 | 46,020(0.32%)#30 | 552,373(0.03%)#507 |
| 31. | East Orange | 146 | 46,020(0.32%)#31 | 552,373(0.03%)#513 |
| 32. | Roselle Park Borough | 143 | 46,020(0.31%)#32 | 552,373(0.03%)#520 |
| 33. | West Long Branch Borough | 143 | 46,020(0.31%)#33 | 552,373(0.03%)#521 |
| 34. | Union | 140 | 46,020(0.30%)#34 | 552,373(0.03%)#530 |
| 35. | Trenton | 137 | 46,020(0.30%)#35 | 552,373(0.02%)#540 |
| 36. | Milltown Borough | 135 | 46,020(0.29%)#36 | 552,373(0.02%)#552 |
| 37. | Kingston Estates | 135 | 46,020(0.29%)#37 | 552,373(0.02%)#553 |
| 38. | Edgewater Borough | 134 | 46,020(0.29%)#38 | 552,373(0.02%)#557 |
| 39. | Raritan Borough | 134 | 46,020(0.29%)#39 | 552,373(0.02%)#558 |
| 40. | Mountainside Borough | 132 | 46,020(0.29%)#40 | 552,373(0.02%)#562 |
| 41. | Summit | 128 | 46,020(0.28%)#41 | 552,373(0.02%)#576 |
| 42. | Union City | 123 | 46,020(0.27%)#42 | 552,373(0.02%)#598 |
| 43. | River Edge Borough | 122 | 46,020(0.27%)#43 | 552,373(0.02%)#610 |
| 44. | Forked River | 104 | 46,020(0.23%)#44 | 552,373(0.02%)#687 |
| 45. | Princeton | 101 | 46,020(0.22%)#45 | 552,373(0.02%)#698 |
| 46. | Secaucus | 97 | 46,020(0.21%)#46 | 552,373(0.02%)#722 |
| 47. | Totowa Borough | 93 | 46,020(0.20%)#47 | 552,373(0.02%)#751 |
| 48. | Fairview Borough | 92 | 46,020(0.20%)#48 | 552,373(0.02%)#756 |
| 49. | Madison Borough | 88 | 46,020(0.19%)#49 | 552,373(0.02%)#776 |
| 50. | Robertsville | 88 | 46,020(0.19%)#50 | 552,373(0.02%)#778 |
| 51. | Smithville | 85 | 46,020(0.18%)#51 | 552,373(0.02%)#793 |
| 52. | Glassboro Borough | 84 | 46,020(0.18%)#52 | 552,373(0.02%)#800 |
| 53. | Lakewood | 83 | 46,020(0.18%)#53 | 552,373(0.02%)#808 |
| 54. | West Freehold | 79 | 46,020(0.17%)#54 | 552,373(0.01%)#838 |
| 55. | Garwood Borough | 78 | 46,020(0.17%)#55 | 552,373(0.01%)#847 |
| 56. | Ampere North | 77 | 46,020(0.17%)#56 | 552,373(0.01%)#862 |
| 57. | Carteret Borough | 72 | 46,020(0.16%)#57 | 552,373(0.01%)#904 |
| 58. | Packanack Lake | 72 | 46,020(0.16%)#58 | 552,373(0.01%)#908 |
| 59. | Ocean Acres | 71 | 46,020(0.15%)#59 | 552,373(0.01%)#916 |
| 60. | Garfield | 70 | 46,020(0.15%)#60 | 552,373(0.01%)#922 |
| 61. | Bergenfield Borough | 70 | 46,020(0.15%)#61 | 552,373(0.01%)#923 |
| 62. | Chatham Borough | 70 | 46,020(0.15%)#62 | 552,373(0.01%)#930 |
| 63. | Ridgefield Park | 63 | 46,020(0.14%)#63 | 552,373(0.01%)#995 |
| 64. | Oak Ridge | 63 | 46,020(0.14%)#64 | 552,373(0.01%)#996 |
| 65. | Tinton Falls Borough | 62 | 46,020(0.13%)#65 | 552,373(0.01%)#1,007 |
| 66. | Mount Hope | 59 | 46,020(0.13%)#66 | 552,373(0.01%)#1,048 |
| 67. | Elmwood Park Borough | 56 | 46,020(0.12%)#67 | 552,373(0.01%)#1,089 |
| 68. | Avenel | 56 | 46,020(0.12%)#68 | 552,373(0.01%)#1,091 |
| 69. | Watsessing | 56 | 46,020(0.12%)#69 | 552,373(0.01%)#1,093 |
| 70. | Silver Lake Cdp Essex County | 56 | 46,020(0.12%)#70 | 552,373(0.01%)#1,096 |
| 71. | New Providence Borough | 54 | 46,020(0.12%)#71 | 552,373(0.01%)#1,117 |
| 72. | Troy Hills | 54 | 46,020(0.12%)#72 | 552,373(0.01%)#1,123 |
| 73. | Oakhurst | 54 | 46,020(0.12%)#73 | 552,373(0.01%)#1,125 |
| 74. | Ringwood Borough | 52 | 46,020(0.11%)#74 | 552,373(0.01%)#1,147 |
| 75. | South Amboy | 52 | 46,020(0.11%)#75 | 552,373(0.01%)#1,148 |
| 76. | Ridgewood | 51 | 46,020(0.11%)#76 | 552,373(0.01%)#1,159 |
| 77. | Phillipsburg | 51 | 46,020(0.11%)#77 | 552,373(0.01%)#1,161 |
| 78. | Short Hills | 49 | 46,020(0.11%)#78 | 552,373(0.01%)#1,186 |
| 79. | Mercerville | 49 | 46,020(0.11%)#79 | 552,373(0.01%)#1,187 |
| 80. | Burlington | 49 | 46,020(0.11%)#80 | 552,373(0.01%)#1,191 |
| 81. | Moorestown Lenola | 48 | 46,020(0.10%)#81 | 552,373(0.01%)#1,203 |
| 82. | White Horse | 48 | 46,020(0.10%)#82 | 552,373(0.01%)#1,206 |
| 83. | Perth Amboy | 47 | 46,020(0.10%)#83 | 552,373(0.01%)#1,208 |
| 84. | Red Bank Borough | 47 | 46,020(0.10%)#84 | 552,373(0.01%)#1,219 |
| 85. | Cresskill Borough | 47 | 46,020(0.10%)#85 | 552,373(0.01%)#1,221 |
| 86. | Point Pleasant Borough | 46 | 46,020(0.10%)#86 | 552,373(0.01%)#1,234 |
| 87. | Jamesburg Borough | 46 | 46,020(0.10%)#87 | 552,373(0.01%)#1,240 |
| 88. | Morristown | 45 | 46,020(0.10%)#88 | 552,373(0.01%)#1,252 |
| 89. | Laurence Harbor | 45 | 46,020(0.10%)#89 | 552,373(0.01%)#1,255 |
| 90. | Little Ferry Borough | 43 | 46,020(0.09%)#90 | 552,373(0.01%)#1,285 |
| 91. | Spotswood Borough | 43 | 46,020(0.09%)#91 | 552,373(0.01%)#1,289 |
| 92. | Montvale Borough | 41 | 46,020(0.09%)#92 | 552,373(0.01%)#1,331 |
| 93. | Hillsborough | 40 | 46,020(0.09%)#93 | 552,373(0.01%)#1,338 |
| 94. | Florham Park Borough | 40 | 46,020(0.09%)#94 | 552,373(0.01%)#1,341 |
| 95. | Asbury Park | 39 | 46,020(0.08%)#95 | 552,373(0.01%)#1,357 |
| 96. | Somerville Borough | 39 | 46,020(0.08%)#96 | 552,373(0.01%)#1,359 |
| 97. | Woodbridge | 38 | 46,020(0.08%)#97 | 552,373(0.01%)#1,377 |
| 98. | New Milford Borough | 38 | 46,020(0.08%)#98 | 552,373(0.01%)#1,378 |
| 99. | Browns Mills | 38 | 46,020(0.08%)#99 | 552,373(0.01%)#1,386 |
| 100. | Towaco | 38 | 46,020(0.08%)#100 | 552,373(0.01%)#1,387 |
Common Questions
What are the Top 10 Cities with the Most Immigrants from Brazil in New Jersey?
Top 10 Cities with the Most Immigrants from Brazil in New Jersey are:
#1
13,292
#2
3,162
#3
2,521
#4
2,114
#5
830
#6
510
#7
504
#8
279
#9
264
#10
263
What city has the Most Immigrants from Brazil in New Jersey?
Newark has the Most Immigrants from Brazil in New Jersey with 13,292.
What is the Total Immigrants from Brazil in the State of New Jersey?
Total Immigrants from Brazil in New Jersey is 46,020.
What is the Total Immigrants from Brazil in the United States?
Total Immigrants from Brazil in the United States is 552,373.