Cities with the Largest Scandinavian Community in New Jersey
RELATED REPORTS & OPTIONS
Scandinavian
New Jersey
Compare Cities
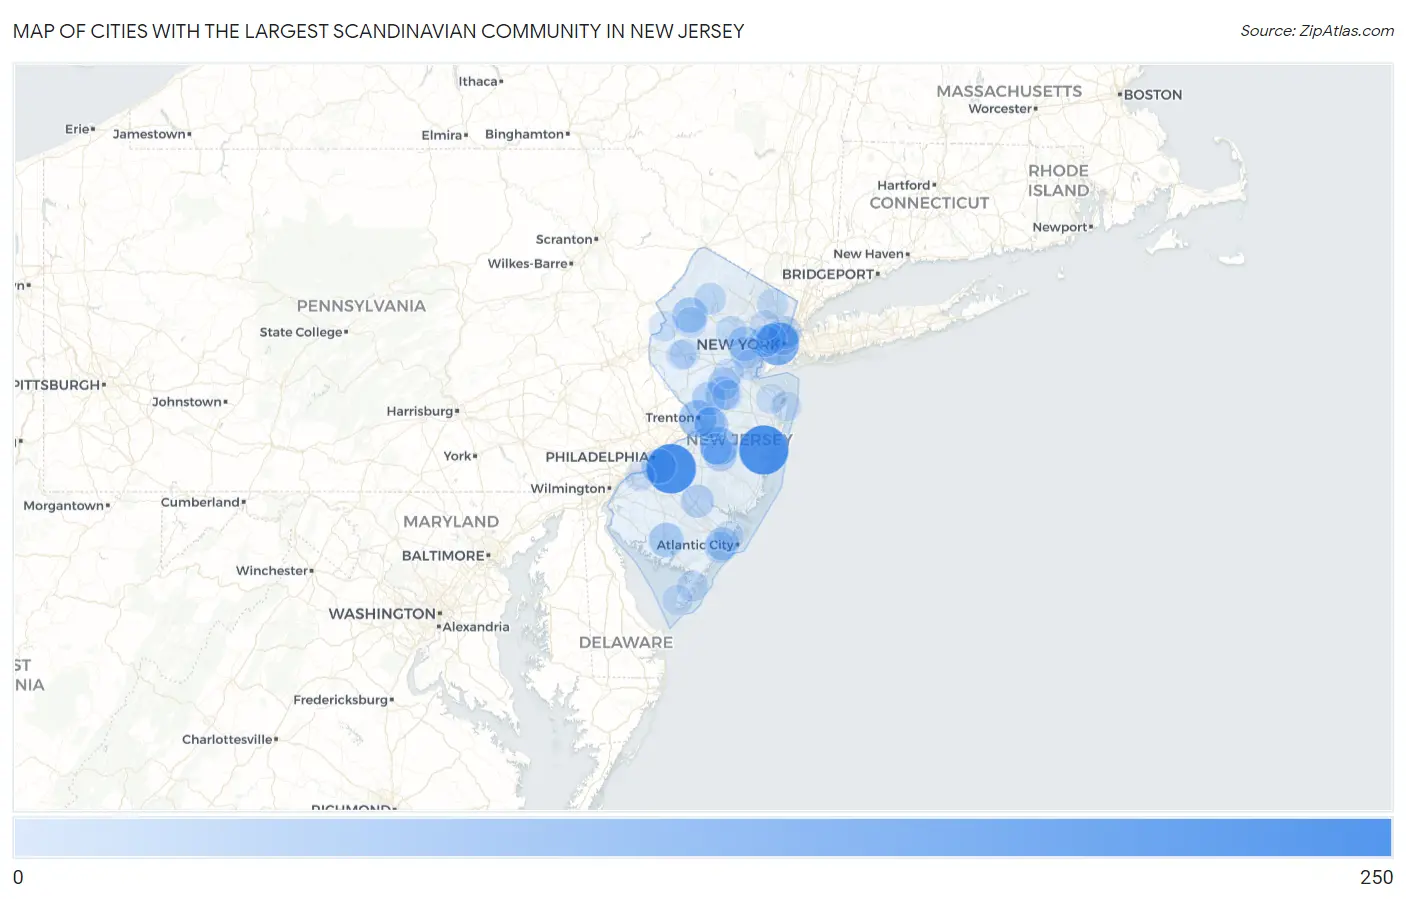
Map of Cities with the Largest Scandinavian Community in New Jersey
0
250
Cities with the Largest Scandinavian Community in New Jersey
| City | Scandinavian | vs State | vs National | |
| 1. | Ashland | 222 | 8,655(2.56%)#1 | 1,007,557(0.02%)#713 |
| 2. | Toms River | 219 | 8,655(2.53%)#2 | 1,007,557(0.02%)#724 |
| 3. | Jersey City | 153 | 8,655(1.77%)#3 | 1,007,557(0.02%)#1,056 |
| 4. | Audubon Borough | 141 | 8,655(1.63%)#4 | 1,007,557(0.01%)#1,159 |
| 5. | Mcguire Afb | 101 | 8,655(1.17%)#5 | 1,007,557(0.01%)#1,546 |
| 6. | Trenton | 91 | 8,655(1.05%)#6 | 1,007,557(0.01%)#1,706 |
| 7. | Haddonfield Borough | 89 | 8,655(1.03%)#7 | 1,007,557(0.01%)#1,745 |
| 8. | Hillsdale Borough | 84 | 8,655(0.97%)#8 | 1,007,557(0.01%)#1,842 |
| 9. | Highland Park Borough | 83 | 8,655(0.96%)#9 | 1,007,557(0.01%)#1,859 |
| 10. | Ocean View | 75 | 8,655(0.87%)#10 | 1,007,557(0.01%)#2,010 |
| 11. | Red Bank Borough | 70 | 8,655(0.81%)#11 | 1,007,557(0.01%)#2,110 |
| 12. | Panther Valley | 69 | 8,655(0.80%)#12 | 1,007,557(0.01%)#2,146 |
| 13. | Franklin Lakes Borough | 68 | 8,655(0.79%)#13 | 1,007,557(0.01%)#2,163 |
| 14. | Millville | 65 | 8,655(0.75%)#14 | 1,007,557(0.01%)#2,235 |
| 15. | Gloucester City | 65 | 8,655(0.75%)#15 | 1,007,557(0.01%)#2,239 |
| 16. | Clayton Borough | 64 | 8,655(0.74%)#16 | 1,007,557(0.01%)#2,284 |
| 17. | Groveville | 63 | 8,655(0.73%)#17 | 1,007,557(0.01%)#2,320 |
| 18. | Summit | 60 | 8,655(0.69%)#18 | 1,007,557(0.01%)#2,387 |
| 19. | Monmouth Junction | 58 | 8,655(0.67%)#19 | 1,007,557(0.01%)#2,463 |
| 20. | Preakness | 57 | 8,655(0.66%)#20 | 1,007,557(0.01%)#2,496 |
| 21. | Fair Haven Borough | 57 | 8,655(0.66%)#21 | 1,007,557(0.01%)#2,513 |
| 22. | Gillette | 56 | 8,655(0.65%)#22 | 1,007,557(0.01%)#2,556 |
| 23. | Beachwood Borough | 55 | 8,655(0.64%)#23 | 1,007,557(0.01%)#2,568 |
| 24. | Princeton | 51 | 8,655(0.59%)#24 | 1,007,557(0.01%)#2,701 |
| 25. | Metuchen Borough | 50 | 8,655(0.58%)#25 | 1,007,557(0.00%)#2,742 |
| 26. | Northfield | 49 | 8,655(0.57%)#26 | 1,007,557(0.00%)#2,788 |
| 27. | Oceanport Borough | 48 | 8,655(0.55%)#27 | 1,007,557(0.00%)#2,833 |
| 28. | West New York | 47 | 8,655(0.54%)#28 | 1,007,557(0.00%)#2,848 |
| 29. | Browns Mills | 47 | 8,655(0.54%)#29 | 1,007,557(0.00%)#2,869 |
| 30. | Hammonton | 46 | 8,655(0.53%)#30 | 1,007,557(0.00%)#2,907 |
| 31. | Tinton Falls Borough | 45 | 8,655(0.52%)#31 | 1,007,557(0.00%)#2,948 |
| 32. | Lincoln Park Borough | 45 | 8,655(0.52%)#32 | 1,007,557(0.00%)#2,956 |
| 33. | Hoboken | 43 | 8,655(0.50%)#33 | 1,007,557(0.00%)#3,015 |
| 34. | South Bound Brook Borough | 43 | 8,655(0.50%)#34 | 1,007,557(0.00%)#3,044 |
| 35. | Westfield | 41 | 8,655(0.47%)#35 | 1,007,557(0.00%)#3,106 |
| 36. | South Plainfield Borough | 41 | 8,655(0.47%)#36 | 1,007,557(0.00%)#3,110 |
| 37. | Keansburg Borough | 40 | 8,655(0.46%)#37 | 1,007,557(0.00%)#3,173 |
| 38. | Franklin Park | 39 | 8,655(0.45%)#38 | 1,007,557(0.00%)#3,220 |
| 39. | Cliffside Park Borough | 36 | 8,655(0.42%)#39 | 1,007,557(0.00%)#3,404 |
| 40. | Franklinville | 36 | 8,655(0.42%)#40 | 1,007,557(0.00%)#3,448 |
| 41. | Newark | 35 | 8,655(0.40%)#41 | 1,007,557(0.00%)#3,455 |
| 42. | Madison Borough | 34 | 8,655(0.39%)#42 | 1,007,557(0.00%)#3,527 |
| 43. | Lake Mohawk | 34 | 8,655(0.39%)#43 | 1,007,557(0.00%)#3,538 |
| 44. | High Bridge Borough | 34 | 8,655(0.39%)#44 | 1,007,557(0.00%)#3,562 |
| 45. | Netcong Borough | 34 | 8,655(0.39%)#45 | 1,007,557(0.00%)#3,565 |
| 46. | Atlantic Highlands Borough | 33 | 8,655(0.38%)#46 | 1,007,557(0.00%)#3,618 |
| 47. | North Caldwell Borough | 32 | 8,655(0.37%)#47 | 1,007,557(0.00%)#3,671 |
| 48. | Linwood | 31 | 8,655(0.36%)#48 | 1,007,557(0.00%)#3,752 |
| 49. | Fort Dix | 30 | 8,655(0.35%)#49 | 1,007,557(0.00%)#3,821 |
| 50. | Westmont | 29 | 8,655(0.34%)#50 | 1,007,557(0.00%)#3,894 |
| 51. | Point Pleasant Borough | 28 | 8,655(0.32%)#51 | 1,007,557(0.00%)#3,973 |
| 52. | Sicklerville | 27 | 8,655(0.31%)#52 | 1,007,557(0.00%)#4,050 |
| 53. | Ridgewood | 27 | 8,655(0.31%)#53 | 1,007,557(0.00%)#4,061 |
| 54. | Oakland Borough | 27 | 8,655(0.31%)#54 | 1,007,557(0.00%)#4,077 |
| 55. | Hackettstown | 27 | 8,655(0.31%)#55 | 1,007,557(0.00%)#4,086 |
| 56. | Yardville | 27 | 8,655(0.31%)#56 | 1,007,557(0.00%)#4,091 |
| 57. | Cape May Court House | 27 | 8,655(0.31%)#57 | 1,007,557(0.00%)#4,097 |
| 58. | Morristown | 26 | 8,655(0.30%)#58 | 1,007,557(0.00%)#4,159 |
| 59. | Whippany | 26 | 8,655(0.30%)#59 | 1,007,557(0.00%)#4,176 |
| 60. | Waldwick Borough | 25 | 8,655(0.29%)#60 | 1,007,557(0.00%)#4,260 |
| 61. | Union Beach Borough | 25 | 8,655(0.29%)#61 | 1,007,557(0.00%)#4,278 |
| 62. | Franklin Borough | 25 | 8,655(0.29%)#62 | 1,007,557(0.00%)#4,284 |
| 63. | Marshallville | 25 | 8,655(0.29%)#63 | 1,007,557(0.00%)#4,330 |
| 64. | Carlstadt Borough | 24 | 8,655(0.28%)#64 | 1,007,557(0.00%)#4,378 |
| 65. | Paramus Borough | 23 | 8,655(0.27%)#65 | 1,007,557(0.00%)#4,448 |
| 66. | Iselin | 23 | 8,655(0.27%)#66 | 1,007,557(0.00%)#4,451 |
| 67. | Palermo | 23 | 8,655(0.27%)#67 | 1,007,557(0.00%)#4,507 |
| 68. | Collingswood Borough | 22 | 8,655(0.25%)#68 | 1,007,557(0.00%)#4,561 |
| 69. | Washington Borough | 22 | 8,655(0.25%)#69 | 1,007,557(0.00%)#4,578 |
| 70. | Somerset | 21 | 8,655(0.24%)#70 | 1,007,557(0.00%)#4,657 |
| 71. | Ramsey Borough | 21 | 8,655(0.24%)#71 | 1,007,557(0.00%)#4,674 |
| 72. | Middlesex Borough | 21 | 8,655(0.24%)#72 | 1,007,557(0.00%)#4,675 |
| 73. | Upper Saddle River Borough | 21 | 8,655(0.24%)#73 | 1,007,557(0.00%)#4,697 |
| 74. | Medford Lakes Borough | 21 | 8,655(0.24%)#74 | 1,007,557(0.00%)#4,716 |
| 75. | North Cape May | 21 | 8,655(0.24%)#75 | 1,007,557(0.00%)#4,724 |
| 76. | Pine Beach Borough | 21 | 8,655(0.24%)#76 | 1,007,557(0.00%)#4,739 |
| 77. | West Park | 21 | 8,655(0.24%)#77 | 1,007,557(0.00%)#4,760 |
| 78. | The Hills | 20 | 8,655(0.23%)#78 | 1,007,557(0.00%)#4,796 |
| 79. | Basking Ridge | 20 | 8,655(0.23%)#79 | 1,007,557(0.00%)#4,806 |
| 80. | Mendham Borough | 20 | 8,655(0.23%)#80 | 1,007,557(0.00%)#4,823 |
| 81. | Belvidere | 20 | 8,655(0.23%)#81 | 1,007,557(0.00%)#4,849 |
| 82. | Annandale | 20 | 8,655(0.23%)#82 | 1,007,557(0.00%)#4,859 |
| 83. | Absecon | 19 | 8,655(0.22%)#83 | 1,007,557(0.00%)#4,942 |
| 84. | Dayton | 19 | 8,655(0.22%)#84 | 1,007,557(0.00%)#4,945 |
| 85. | Atco | 19 | 8,655(0.22%)#85 | 1,007,557(0.00%)#4,948 |
| 86. | Gibbstown | 19 | 8,655(0.22%)#86 | 1,007,557(0.00%)#4,983 |
| 87. | Long Branch | 18 | 8,655(0.21%)#87 | 1,007,557(0.00%)#5,043 |
| 88. | Dumont Borough | 18 | 8,655(0.21%)#88 | 1,007,557(0.00%)#5,059 |
| 89. | Brookdale | 18 | 8,655(0.21%)#89 | 1,007,557(0.00%)#5,072 |
| 90. | Matawan Borough | 18 | 8,655(0.21%)#90 | 1,007,557(0.00%)#5,076 |
| 91. | Haddon Heights Borough | 18 | 8,655(0.21%)#91 | 1,007,557(0.00%)#5,082 |
| 92. | Emerson Borough | 18 | 8,655(0.21%)#92 | 1,007,557(0.00%)#5,084 |
| 93. | Lincroft | 18 | 8,655(0.21%)#93 | 1,007,557(0.00%)#5,086 |
| 94. | Rockaway Borough | 18 | 8,655(0.21%)#94 | 1,007,557(0.00%)#5,087 |
| 95. | Kearny | 17 | 8,655(0.20%)#95 | 1,007,557(0.00%)#5,194 |
| 96. | Carteret Borough | 17 | 8,655(0.20%)#96 | 1,007,557(0.00%)#5,201 |
| 97. | Freehold Borough | 17 | 8,655(0.20%)#97 | 1,007,557(0.00%)#5,226 |
| 98. | Clinton | 17 | 8,655(0.20%)#98 | 1,007,557(0.00%)#5,292 |
| 99. | Ship Bottom Borough | 17 | 8,655(0.20%)#99 | 1,007,557(0.00%)#5,332 |
| 100. | Berlin Borough | 16 | 8,655(0.18%)#100 | 1,007,557(0.00%)#5,408 |
Common Questions
What are the Top 10 Cities with the Largest Scandinavian Community in New Jersey?
Top 10 Cities with the Largest Scandinavian Community in New Jersey are:
#1
222
#2
219
#3
153
#4
101
#5
91
#6
69
#7
65
#8
65
#9
63
#10
60
What city has the Largest Scandinavian Community in New Jersey?
Ashland has the Largest Scandinavian Community in New Jersey with 222.
What is the Total Scandinavian Population in the State of New Jersey?
Total Scandinavian Population in New Jersey is 8,655.
What is the Total Scandinavian Population in the United States?
Total Scandinavian Population in the United States is 1,007,557.