Cities with the Highest Poverty Level Among Married Couples in New Jersey
RELATED REPORTS & OPTIONS
Highest Poverty | Married Couple
New Jersey
Compare Cities
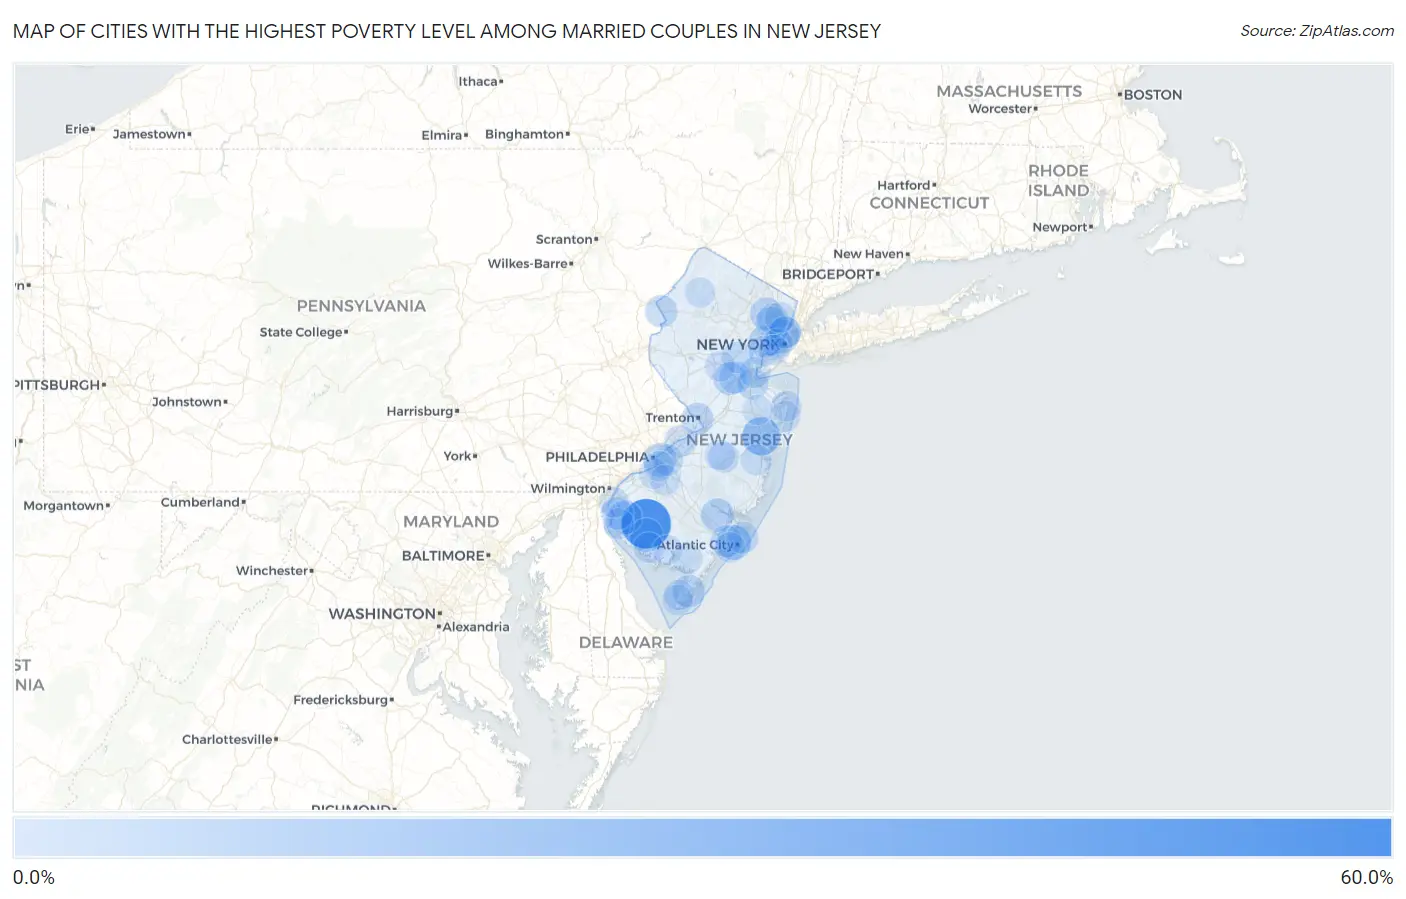
Map of Cities with the Highest Poverty Level Among Married Couples in New Jersey
0.0%
60.0%
Cities with the Highest Poverty Level Among Married Couples in New Jersey
| City | Married Couples Poverty | vs State | vs National | |
| 1. | Seabrook Farms | 51.0% | 3.4%(+47.6)#1 | 4.5%(+46.5)#369 |
| 2. | Harrisonville | 34.8% | 3.4%(+31.4)#2 | 4.5%(+30.4)#809 |
| 3. | Dividing Creek | 28.8% | 3.4%(+25.4)#3 | 4.5%(+24.4)#1,093 |
| 4. | Seaside Heights Borough | 25.6% | 3.4%(+22.2)#4 | 4.5%(+21.2)#1,373 |
| 5. | Lakewood | 24.1% | 3.4%(+20.7)#5 | 4.5%(+19.7)#1,537 |
| 6. | Wharton Borough | 21.0% | 3.4%(+17.6)#6 | 4.5%(+16.6)#1,904 |
| 7. | Lindenwold Borough | 20.9% | 3.4%(+17.4)#7 | 4.5%(+16.4)#1,916 |
| 8. | Arrowhead Lake | 19.2% | 3.4%(+15.8)#8 | 4.5%(+14.8)#2,178 |
| 9. | Dunellen Borough | 18.5% | 3.4%(+15.0)#9 | 4.5%(+14.0)#2,312 |
| 10. | Atlantic City | 16.4% | 3.4%(+13.0)#10 | 4.5%(+11.9)#2,751 |
| 11. | Keasbey | 15.4% | 3.4%(+12.0)#11 | 4.5%(+10.9)#2,989 |
| 12. | Clearbrook | 14.7% | 3.4%(+11.2)#12 | 4.5%(+10.2)#3,186 |
| 13. | West Park | 14.5% | 3.4%(+11.1)#13 | 4.5%(+10.0)#3,228 |
| 14. | Quinton | 14.3% | 3.4%(+10.9)#14 | 4.5%(+9.82)#3,290 |
| 15. | Bridgeton | 13.7% | 3.4%(+10.3)#15 | 4.5%(+9.25)#3,483 |
| 16. | Camden | 13.2% | 3.4%(+9.75)#16 | 4.5%(+8.72)#3,668 |
| 17. | Sunset Lake | 13.1% | 3.4%(+9.71)#17 | 4.5%(+8.68)#3,688 |
| 18. | Victory Gardens Borough | 13.0% | 3.4%(+9.55)#18 | 4.5%(+8.52)#3,761 |
| 19. | Egg Harbor City | 12.6% | 3.4%(+9.15)#19 | 4.5%(+8.12)#3,897 |
| 20. | Union City | 12.4% | 3.4%(+8.92)#20 | 4.5%(+7.89)#4,014 |
| 21. | English Creek | 11.8% | 3.4%(+8.37)#21 | 4.5%(+7.34)#4,257 |
| 22. | Crosswicks | 11.8% | 3.4%(+8.37)#22 | 4.5%(+7.34)#4,258 |
| 23. | Voorhees | 11.7% | 3.4%(+8.24)#23 | 4.5%(+7.21)#4,328 |
| 24. | Paterson | 11.1% | 3.4%(+7.71)#24 | 4.5%(+6.68)#4,547 |
| 25. | Burleigh | 11.0% | 3.4%(+7.57)#25 | 4.5%(+6.54)#4,649 |
| 26. | Union | 11.0% | 3.4%(+7.54)#26 | 4.5%(+6.51)#4,667 |
| 27. | East Newark Borough | 10.8% | 3.4%(+7.40)#27 | 4.5%(+6.37)#4,746 |
| 28. | Newark | 10.6% | 3.4%(+7.21)#28 | 4.5%(+6.18)#4,851 |
| 29. | Dennisville | 10.4% | 3.4%(+6.93)#29 | 4.5%(+5.90)#5,037 |
| 30. | West New York | 10.3% | 3.4%(+6.87)#30 | 4.5%(+5.84)#5,069 |
| 31. | Columbia | 10.2% | 3.4%(+6.77)#31 | 4.5%(+5.74)#5,127 |
| 32. | New Brunswick | 10.2% | 3.4%(+6.75)#32 | 4.5%(+5.72)#5,135 |
| 33. | Salem | 10.0% | 3.4%(+6.55)#33 | 4.5%(+5.52)#5,290 |
| 34. | Trenton | 9.9% | 3.4%(+6.49)#34 | 4.5%(+5.46)#5,315 |
| 35. | Pleasantville | 9.5% | 3.4%(+6.10)#35 | 4.5%(+5.07)#5,549 |
| 36. | Beverly | 9.5% | 3.4%(+6.03)#36 | 4.5%(+4.99)#5,613 |
| 37. | Brigantine | 9.3% | 3.4%(+5.83)#37 | 4.5%(+4.80)#5,752 |
| 38. | Gillette | 9.3% | 3.4%(+5.83)#38 | 4.5%(+4.79)#5,753 |
| 39. | Woodlynne Borough | 9.2% | 3.4%(+5.79)#39 | 4.5%(+4.76)#5,780 |
| 40. | Fairview Borough | 8.9% | 3.4%(+5.52)#40 | 4.5%(+4.49)#6,010 |
| 41. | Passaic | 8.9% | 3.4%(+5.51)#41 | 4.5%(+4.48)#6,017 |
| 42. | New Vernon | 8.8% | 3.4%(+5.38)#42 | 4.5%(+4.34)#6,121 |
| 43. | Guttenberg | 8.8% | 3.4%(+5.36)#43 | 4.5%(+4.33)#6,124 |
| 44. | Plainfield | 8.8% | 3.4%(+5.35)#44 | 4.5%(+4.32)#6,140 |
| 45. | Middlesex Borough | 8.6% | 3.4%(+5.12)#45 | 4.5%(+4.09)#6,290 |
| 46. | Somerdale Borough | 8.4% | 3.4%(+4.95)#46 | 4.5%(+3.92)#6,407 |
| 47. | Madison Park | 8.3% | 3.4%(+4.90)#47 | 4.5%(+3.87)#6,490 |
| 48. | Renaissance At Monroe | 8.3% | 3.4%(+4.87)#48 | 4.5%(+3.84)#6,504 |
| 49. | Englishtown Borough | 8.3% | 3.4%(+4.84)#49 | 4.5%(+3.80)#6,529 |
| 50. | Newport | 8.0% | 3.4%(+4.53)#50 | 4.5%(+3.50)#6,780 |
| 51. | Flemington Borough | 7.9% | 3.4%(+4.50)#51 | 4.5%(+3.47)#6,808 |
| 52. | Perth Amboy | 7.8% | 3.4%(+4.38)#52 | 4.5%(+3.35)#6,920 |
| 53. | Golden Triangle | 7.7% | 3.4%(+4.30)#53 | 4.5%(+3.26)#6,999 |
| 54. | Hampton Borough | 7.7% | 3.4%(+4.29)#54 | 4.5%(+3.26)#7,002 |
| 55. | Woodbine Borough | 7.7% | 3.4%(+4.24)#55 | 4.5%(+3.20)#7,079 |
| 56. | Holiday Heights | 7.4% | 3.4%(+4.01)#56 | 4.5%(+2.98)#7,276 |
| 57. | Loch Arbour | 7.3% | 3.4%(+3.84)#57 | 4.5%(+2.81)#7,470 |
| 58. | Elmwood Park Borough | 7.2% | 3.4%(+3.80)#58 | 4.5%(+2.76)#7,505 |
| 59. | Stockton Borough | 7.2% | 3.4%(+3.79)#59 | 4.5%(+2.75)#7,517 |
| 60. | Regency At Monroe | 7.2% | 3.4%(+3.77)#60 | 4.5%(+2.73)#7,529 |
| 61. | Country Lake Estates | 7.1% | 3.4%(+3.66)#61 | 4.5%(+2.63)#7,660 |
| 62. | Chesilhurst Borough | 7.0% | 3.4%(+3.57)#62 | 4.5%(+2.54)#7,767 |
| 63. | Silver Lake Cdp Essex County | 7.0% | 3.4%(+3.57)#63 | 4.5%(+2.54)#7,772 |
| 64. | Hancocks Bridge | 7.0% | 3.4%(+3.55)#64 | 4.5%(+2.51)#7,797 |
| 65. | Long Branch | 6.9% | 3.4%(+3.49)#65 | 4.5%(+2.46)#7,850 |
| 66. | Little Ferry Borough | 6.9% | 3.4%(+3.46)#66 | 4.5%(+2.43)#7,900 |
| 67. | Haledon Borough | 6.8% | 3.4%(+3.36)#67 | 4.5%(+2.32)#7,998 |
| 68. | Elizabeth | 6.8% | 3.4%(+3.33)#68 | 4.5%(+2.30)#8,028 |
| 69. | Garfield | 6.7% | 3.4%(+3.30)#69 | 4.5%(+2.27)#8,059 |
| 70. | Finderne | 6.6% | 3.4%(+3.19)#70 | 4.5%(+2.16)#8,178 |
| 71. | Woodbury | 6.6% | 3.4%(+3.19)#71 | 4.5%(+2.15)#8,185 |
| 72. | Highland Park Borough | 6.6% | 3.4%(+3.17)#72 | 4.5%(+2.14)#8,198 |
| 73. | Cedarville | 6.6% | 3.4%(+3.16)#73 | 4.5%(+2.13)#8,212 |
| 74. | Jersey City | 6.6% | 3.4%(+3.16)#74 | 4.5%(+2.13)#8,216 |
| 75. | Connecticut Farms | 6.5% | 3.4%(+3.06)#75 | 4.5%(+2.03)#8,330 |
| 76. | Runnemede Borough | 6.5% | 3.4%(+3.05)#76 | 4.5%(+2.02)#8,351 |
| 77. | Penns Grove Borough | 6.5% | 3.4%(+3.05)#77 | 4.5%(+2.02)#8,355 |
| 78. | Red Bank Borough | 6.4% | 3.4%(+3.01)#78 | 4.5%(+1.97)#8,416 |
| 79. | North Cape May | 6.4% | 3.4%(+2.99)#79 | 4.5%(+1.95)#8,434 |
| 80. | Jobstown | 6.4% | 3.4%(+2.98)#80 | 4.5%(+1.95)#8,439 |
| 81. | Hackensack | 6.4% | 3.4%(+2.95)#81 | 4.5%(+1.92)#8,487 |
| 82. | Gouldtown | 6.4% | 3.4%(+2.94)#82 | 4.5%(+1.91)#8,508 |
| 83. | Carteret Borough | 6.4% | 3.4%(+2.92)#83 | 4.5%(+1.89)#8,523 |
| 84. | Pennsville | 6.3% | 3.4%(+2.92)#84 | 4.5%(+1.89)#8,532 |
| 85. | Ventnor City | 6.3% | 3.4%(+2.86)#85 | 4.5%(+1.83)#8,590 |
| 86. | Bayonne | 6.3% | 3.4%(+2.82)#86 | 4.5%(+1.79)#8,614 |
| 87. | Belleplain | 6.2% | 3.4%(+2.82)#87 | 4.5%(+1.79)#8,639 |
| 88. | Villas | 6.2% | 3.4%(+2.80)#88 | 4.5%(+1.77)#8,683 |
| 89. | Browns Mills | 6.2% | 3.4%(+2.80)#89 | 4.5%(+1.76)#8,692 |
| 90. | Newton | 6.2% | 3.4%(+2.73)#90 | 4.5%(+1.70)#8,760 |
| 91. | North Plainfield Borough | 6.1% | 3.4%(+2.71)#91 | 4.5%(+1.68)#8,798 |
| 92. | Blackwood | 6.1% | 3.4%(+2.64)#92 | 4.5%(+1.61)#8,869 |
| 93. | Keansburg Borough | 6.0% | 3.4%(+2.62)#93 | 4.5%(+1.58)#8,916 |
| 94. | Raritan Borough | 5.9% | 3.4%(+2.43)#94 | 4.5%(+1.39)#9,161 |
| 95. | Gloucester City | 5.8% | 3.4%(+2.40)#95 | 4.5%(+1.37)#9,188 |
| 96. | East Freehold | 5.8% | 3.4%(+2.38)#96 | 4.5%(+1.34)#9,228 |
| 97. | Laurel Lake | 5.7% | 3.4%(+2.26)#97 | 4.5%(+1.23)#9,401 |
| 98. | Palisades Park Borough | 5.7% | 3.4%(+2.25)#98 | 4.5%(+1.22)#9,415 |
| 99. | Point Pleasant Beach Borough | 5.6% | 3.4%(+2.15)#99 | 4.5%(+1.12)#9,535 |
| 100. | Bargaintown | 5.6% | 3.4%(+2.15)#100 | 4.5%(+1.11)#9,541 |
Common Questions
What are the Top 10 Cities with the Highest Poverty Level Among Married Couples in New Jersey?
Top 10 Cities with the Highest Poverty Level Among Married Couples in New Jersey are:
#1
51.0%
#2
24.1%
#3
16.4%
#4
14.3%
#5
13.7%
#6
13.2%
#7
12.6%
#8
12.4%
#9
11.7%
#10
11.1%
What city has the Highest Poverty Level Among Married Couples in New Jersey?
Seabrook Farms has the Highest Poverty Level Among Married Couples in New Jersey with 51.0%.
What is the Poverty Level Among Married Couples in the State of New Jersey?
Poverty Level Among Married Couples in New Jersey is 3.4%.
What is the Poverty Level Among Married Couples in the United States?
Poverty Level Among Married Couples in the United States is 4.5%.