Cities with the Highest Percentage of Immigrants from Pakistan in New Jersey
RELATED REPORTS & OPTIONS
Pakistan
New Jersey
Compare Cities
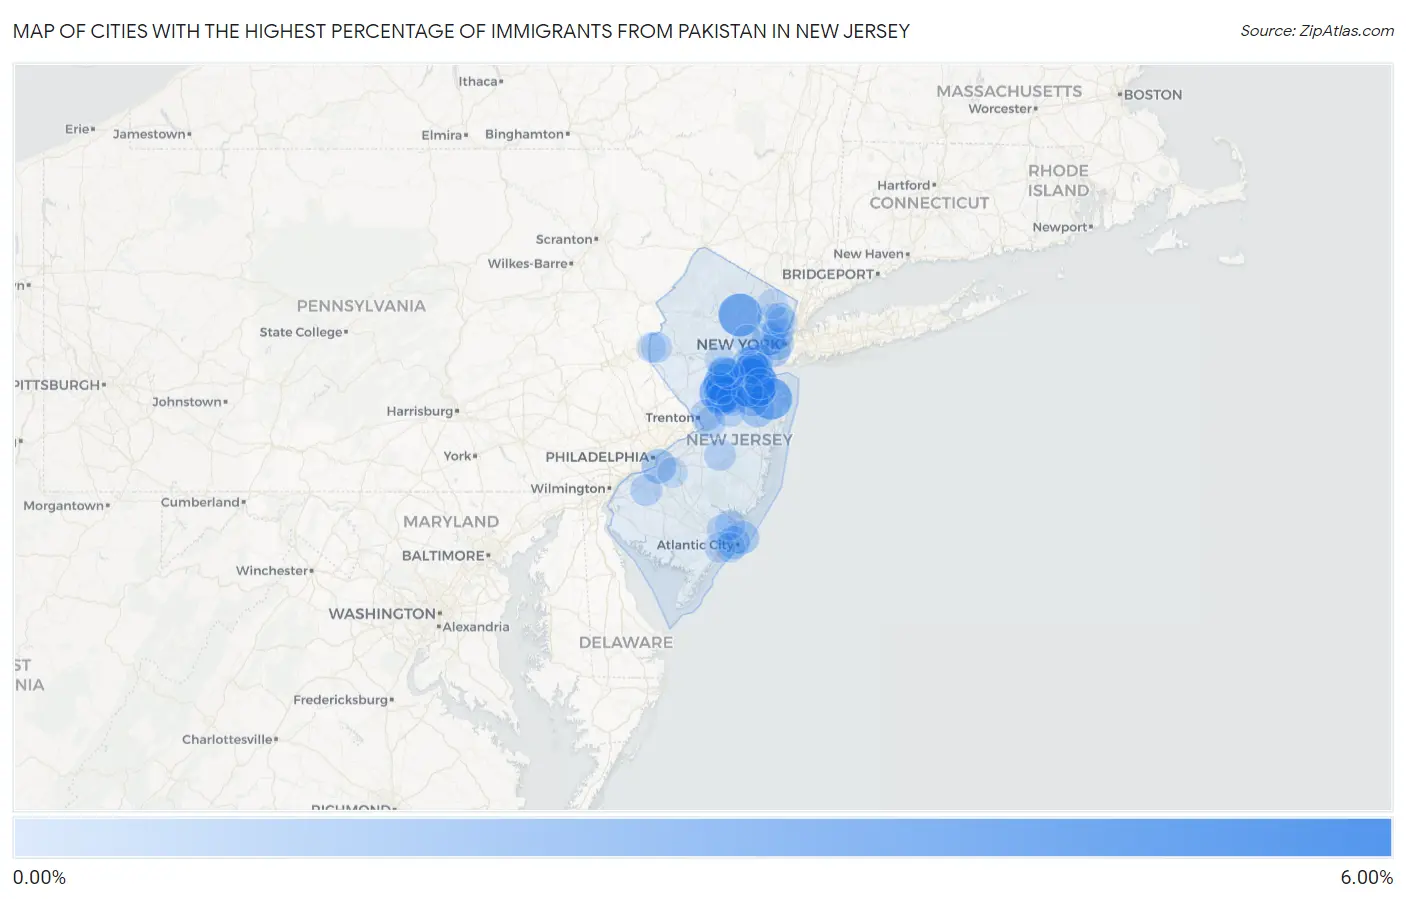
Map of Cities with the Highest Percentage of Immigrants from Pakistan in New Jersey
0.00%
6.00%
Cities with the Highest Percentage of Immigrants from Pakistan in New Jersey
| City | Pakistan | vs State | vs National | |
| 1. | Madison Park | 5.43% | 0.30%(+5.13)#-1 | 0.12%(+5.31)#0 |
| 2. | Deal Borough | 3.72% | 0.30%(+3.42)#0 | 0.12%(+3.60)#1 |
| 3. | Menlo Park Terrace | 3.69% | 0.30%(+3.39)#1 | 0.12%(+3.57)#2 |
| 4. | Boonton | 3.67% | 0.30%(+3.37)#2 | 0.12%(+3.55)#3 |
| 5. | Lincroft | 3.37% | 0.30%(+3.07)#3 | 0.12%(+3.25)#4 |
| 6. | Heathcote | 3.17% | 0.30%(+2.88)#4 | 0.12%(+3.06)#5 |
| 7. | Franklin Park | 2.93% | 0.30%(+2.64)#5 | 0.12%(+2.82)#6 |
| 8. | Lakehurst Borough | 2.90% | 0.30%(+2.60)#6 | 0.12%(+2.78)#7 |
| 9. | Bellmawr Borough | 2.72% | 0.30%(+2.43)#7 | 0.12%(+2.60)#8 |
| 10. | Hampton Borough | 2.63% | 0.30%(+2.33)#8 | 0.12%(+2.51)#9 |
| 11. | Carteret Borough | 2.58% | 0.30%(+2.28)#9 | 0.12%(+2.46)#10 |
| 12. | Westville Borough | 2.41% | 0.30%(+2.11)#10 | 0.12%(+2.29)#11 |
| 13. | Monmouth Junction | 2.15% | 0.30%(+1.86)#11 | 0.12%(+2.03)#12 |
| 14. | Middlebush | 2.09% | 0.30%(+1.79)#12 | 0.12%(+1.97)#13 |
| 15. | Northvale Borough | 1.89% | 0.30%(+1.59)#13 | 0.12%(+1.77)#14 |
| 16. | Dayton | 1.87% | 0.30%(+1.57)#14 | 0.12%(+1.75)#15 |
| 17. | Iselin | 1.85% | 0.30%(+1.55)#15 | 0.12%(+1.73)#16 |
| 18. | Avenel | 1.79% | 0.30%(+1.49)#16 | 0.12%(+1.67)#17 |
| 19. | Deans | 1.72% | 0.30%(+1.42)#17 | 0.12%(+1.60)#18 |
| 20. | Seaside Park Borough | 1.56% | 0.30%(+1.26)#18 | 0.12%(+1.44)#19 |
| 21. | Gloucester City | 1.49% | 0.30%(+1.19)#19 | 0.12%(+1.37)#20 |
| 22. | East Freehold | 1.40% | 0.30%(+1.10)#20 | 0.12%(+1.28)#21 |
| 23. | Edgewater Borough | 1.36% | 0.30%(+1.06)#21 | 0.12%(+1.24)#22 |
| 24. | Silver Lake Cdp Essex County | 1.36% | 0.30%(+1.06)#22 | 0.12%(+1.24)#23 |
| 25. | Sayreville Borough | 1.25% | 0.30%(+0.956)#23 | 0.12%(+1.14)#252 |
| 26. | Paramus Borough | 1.25% | 0.30%(+0.951)#24 | 0.12%(+1.13)#462 |
| 27. | Bayonne | 1.23% | 0.30%(+0.930)#25 | 0.12%(+1.11)#463 |
| 28. | Brigantine | 1.16% | 0.30%(+0.858)#26 | 0.12%(+1.04)#464 |
| 29. | Barrington Borough | 1.13% | 0.30%(+0.827)#27 | 0.12%(+1.01)#465 |
| 30. | Harrison | 1.11% | 0.30%(+0.815)#28 | 0.12%(+0.995)#466 |
| 31. | Atlantic City | 1.10% | 0.30%(+0.798)#29 | 0.12%(+0.978)#467 |
| 32. | Robertsville | 1.06% | 0.30%(+0.761)#30 | 0.12%(+0.941)#468 |
| 33. | Woodbridge | 1.04% | 0.30%(+0.739)#31 | 0.12%(+0.918)#469 |
| 34. | Jersey City | 1.04% | 0.30%(+0.739)#32 | 0.12%(+0.918)#592 |
| 35. | Fords | 1.03% | 0.30%(+0.728)#33 | 0.12%(+0.908)#593 |
| 36. | Harrington Park Borough | 0.99% | 0.30%(+0.696)#34 | 0.12%(+0.876)#594 |
| 37. | Mendham Borough | 0.97% | 0.30%(+0.668)#35 | 0.12%(+0.847)#595 |
| 38. | Parsippany | 0.90% | 0.30%(+0.605)#36 | 0.12%(+0.784)#596 |
| 39. | Vauxhall | 0.90% | 0.30%(+0.602)#37 | 0.12%(+0.781)#597 |
| 40. | Ten Mile Run | 0.89% | 0.30%(+0.594)#38 | 0.12%(+0.773)#598 |
| 41. | South Plainfield Borough | 0.87% | 0.30%(+0.567)#39 | 0.12%(+0.746)#599 |
| 42. | Ridgefield Borough | 0.85% | 0.30%(+0.557)#40 | 0.12%(+0.736)#600 |
| 43. | Palisades Park Borough | 0.84% | 0.30%(+0.542)#41 | 0.12%(+0.721)#601 |
| 44. | Princeton Meadows | 0.83% | 0.30%(+0.536)#42 | 0.12%(+0.715)#602 |
| 45. | Sewaren | 0.82% | 0.30%(+0.518)#43 | 0.12%(+0.697)#603 |
| 46. | Secaucus | 0.79% | 0.30%(+0.489)#44 | 0.12%(+0.668)#1,048 |
| 47. | Mullica Hill | 0.79% | 0.30%(+0.488)#45 | 0.12%(+0.667)#1,049 |
| 48. | Highland Park Borough | 0.78% | 0.30%(+0.482)#46 | 0.12%(+0.661)#1,050 |
| 49. | Lodi Borough | 0.75% | 0.30%(+0.453)#47 | 0.12%(+0.632)#1,051 |
| 50. | Mercerville | 0.73% | 0.30%(+0.433)#48 | 0.12%(+0.612)#1,052 |
| 51. | Browns Mills | 0.73% | 0.30%(+0.427)#49 | 0.12%(+0.607)#1,053 |
| 52. | Strathmore | 0.72% | 0.30%(+0.426)#50 | 0.12%(+0.605)#1,054 |
| 53. | Hillsborough | 0.72% | 0.30%(+0.424)#51 | 0.12%(+0.604)#1,055 |
| 54. | North Plainfield Borough | 0.71% | 0.30%(+0.411)#52 | 0.12%(+0.590)#1,056 |
| 55. | Rossmoor | 0.69% | 0.30%(+0.387)#53 | 0.12%(+0.566)#1,057 |
| 56. | Twin Rivers | 0.68% | 0.30%(+0.377)#54 | 0.12%(+0.556)#1,058 |
| 57. | Pemberton Borough | 0.67% | 0.30%(+0.374)#55 | 0.12%(+0.554)#1,059 |
| 58. | Keasbey | 0.66% | 0.30%(+0.358)#56 | 0.12%(+0.537)#1,060 |
| 59. | Pomona | 0.63% | 0.30%(+0.333)#57 | 0.12%(+0.512)#1,061 |
| 60. | Greenwich | 0.63% | 0.30%(+0.330)#58 | 0.12%(+0.509)#1,062 |
| 61. | Yardville | 0.62% | 0.30%(+0.326)#59 | 0.12%(+0.506)#1,063 |
| 62. | Kendall Park | 0.62% | 0.30%(+0.323)#60 | 0.12%(+0.502)#1,064 |
| 63. | Elmwood Park Borough | 0.58% | 0.30%(+0.285)#61 | 0.12%(+0.464)#1,065 |
| 64. | Spotswood Borough | 0.58% | 0.30%(+0.279)#62 | 0.12%(+0.459)#1,066 |
| 65. | Preakness | 0.57% | 0.30%(+0.272)#63 | 0.12%(+0.451)#1,067 |
| 66. | Lincoln Park Borough | 0.57% | 0.30%(+0.271)#64 | 0.12%(+0.451)#1,068 |
| 67. | Flanders | 0.57% | 0.30%(+0.269)#65 | 0.12%(+0.448)#1,069 |
| 68. | Troy Hills | 0.56% | 0.30%(+0.259)#66 | 0.12%(+0.438)#1,070 |
| 69. | Linwood | 0.55% | 0.30%(+0.248)#67 | 0.12%(+0.428)#1,071 |
| 70. | Old Bridge | 0.54% | 0.30%(+0.246)#68 | 0.12%(+0.426)#1,072 |
| 71. | Keansburg Borough | 0.54% | 0.30%(+0.245)#69 | 0.12%(+0.424)#1,073 |
| 72. | Lyons | 0.54% | 0.30%(+0.239)#70 | 0.12%(+0.418)#1,074 |
| 73. | Somerset | 0.53% | 0.30%(+0.234)#71 | 0.12%(+0.413)#1,075 |
| 74. | Cliffwood Beach | 0.53% | 0.30%(+0.234)#72 | 0.12%(+0.413)#1,076 |
| 75. | Middlesex Borough | 0.53% | 0.30%(+0.232)#73 | 0.12%(+0.411)#1,077 |
| 76. | Midland Park Borough | 0.53% | 0.30%(+0.229)#74 | 0.12%(+0.408)#1,078 |
| 77. | Watsessing | 0.51% | 0.30%(+0.207)#75 | 0.12%(+0.386)#1,079 |
| 78. | Bedminster | 0.51% | 0.30%(+0.207)#76 | 0.12%(+0.386)#1,080 |
| 79. | Stanhope Borough | 0.48% | 0.30%(+0.183)#77 | 0.12%(+0.362)#1,081 |
| 80. | Garfield | 0.48% | 0.30%(+0.179)#78 | 0.12%(+0.358)#1,082 |
| 81. | Smithville | 0.46% | 0.30%(+0.162)#79 | 0.12%(+0.341)#1,083 |
| 82. | Ridgefield Park | 0.45% | 0.30%(+0.150)#80 | 0.12%(+0.329)#1,084 |
| 83. | Short Hills | 0.44% | 0.30%(+0.145)#81 | 0.12%(+0.324)#1,085 |
| 84. | Moonachie Borough | 0.42% | 0.30%(+0.122)#82 | 0.12%(+0.301)#1,086 |
| 85. | Bergenfield Borough | 0.40% | 0.30%(+0.106)#83 | 0.12%(+0.285)#1,087 |
| 86. | Metuchen Borough | 0.40% | 0.30%(+0.103)#84 | 0.12%(+0.282)#1,088 |
| 87. | Franklin Center | 0.39% | 0.30%(+0.096)#85 | 0.12%(+0.275)#1,089 |
| 88. | Echelon | 0.39% | 0.30%(+0.093)#86 | 0.12%(+0.272)#1,090 |
| 89. | River Edge Borough | 0.39% | 0.30%(+0.093)#87 | 0.12%(+0.272)#1,091 |
| 90. | Little Ferry Borough | 0.37% | 0.30%(+0.076)#88 | 0.12%(+0.255)#1,092 |
| 91. | Martinsville | 0.37% | 0.30%(+0.074)#89 | 0.12%(+0.253)#1,093 |
| 92. | Brooklawn Borough | 0.37% | 0.30%(+0.071)#90 | 0.12%(+0.251)#1,094 |
| 93. | Ridgewood | 0.36% | 0.30%(+0.067)#91 | 0.12%(+0.246)#1,095 |
| 94. | Ventnor City | 0.36% | 0.30%(+0.057)#92 | 0.12%(+0.236)#1,096 |
| 95. | Englewood Cliffs Borough | 0.36% | 0.30%(+0.057)#93 | 0.12%(+0.236)#1,097 |
| 96. | Hackensack | 0.35% | 0.30%(+0.056)#94 | 0.12%(+0.235)#1,098 |
| 97. | Allendale Borough | 0.34% | 0.30%(+0.039)#95 | 0.12%(+0.218)#1,099 |
| 98. | Phillipsburg | 0.33% | 0.30%(+0.031)#96 | 0.12%(+0.210)#1,100 |
| 99. | The College Of New Jersey | 0.33% | 0.30%(+0.027)#97 | 0.12%(+0.207)#1,101 |
| 100. | Raritan Borough | 0.31% | 0.30%(+0.015)#98 | 0.12%(+0.194)#1,102 |
Common Questions
What are the Top 10 Cities with the Highest Percentage of Immigrants from Pakistan in New Jersey?
Top 10 Cities with the Highest Percentage of Immigrants from Pakistan in New Jersey are:
#1
5.43%
#2
3.67%
#3
3.37%
#4
3.17%
#5
2.93%
#6
2.15%
#7
2.09%
#8
1.87%
#9
1.85%
#10
1.79%
What city has the Highest Percentage of Immigrants from Pakistan in New Jersey?
Madison Park has the Highest Percentage of Immigrants from Pakistan in New Jersey with 5.43%.
What is the Percentage of Immigrants from Pakistan in the State of New Jersey?
Percentage of Immigrants from Pakistan in New Jersey is 0.30%.
What is the Percentage of Immigrants from Pakistan in the United States?
Percentage of Immigrants from Pakistan in the United States is 0.12%.