Franklin Center, NJ Map & Demographics
Franklin Center Map
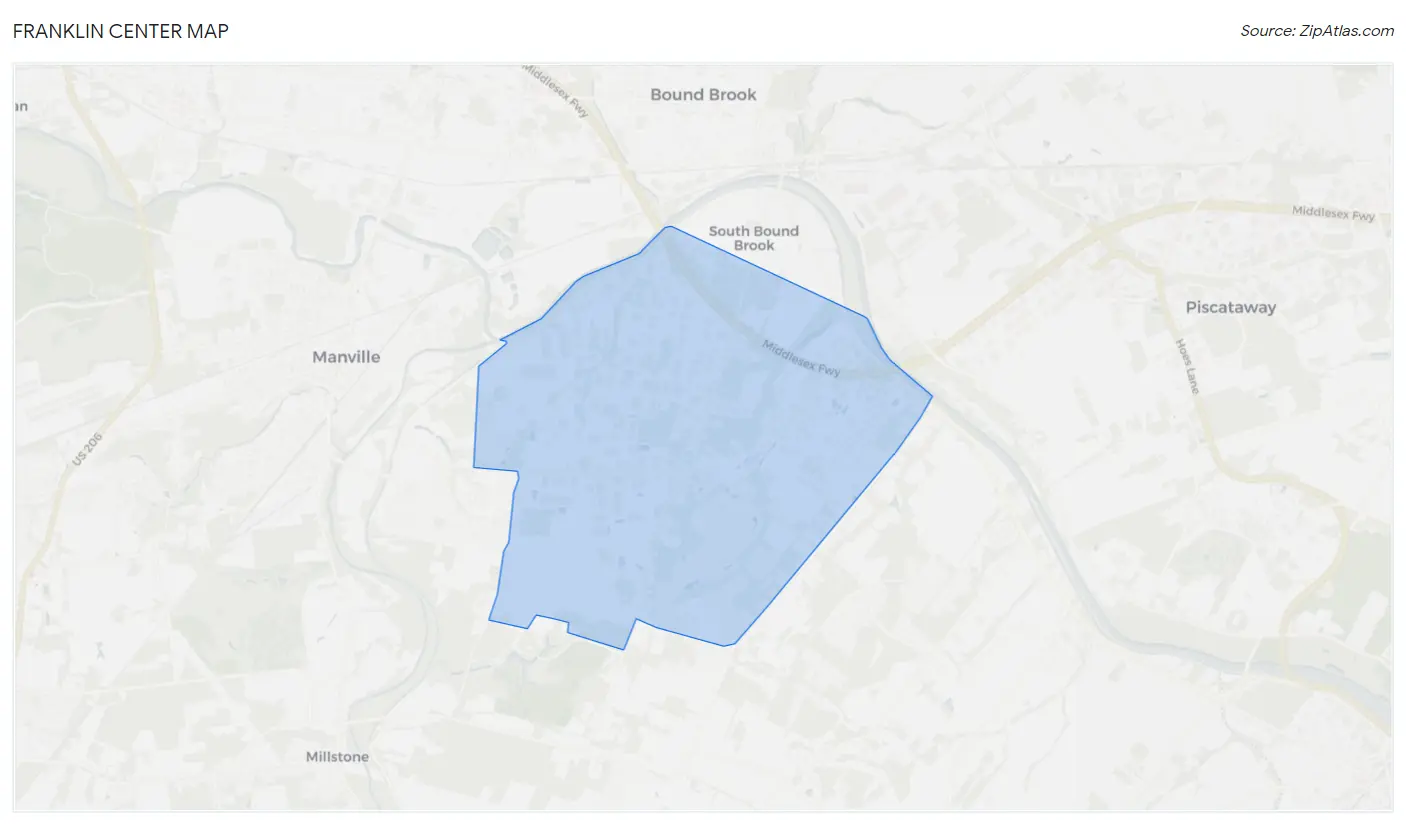
Franklin Center Overview
$72,874
PER CAPITA INCOME
$171,420
AVG FAMILY INCOME
$132,787
AVG HOUSEHOLD INCOME
13.4%
WAGE / INCOME GAP [ % ]
86.6¢/ $1
WAGE / INCOME GAP [ $ ]
0.41
INEQUALITY / GINI INDEX
5,583
TOTAL POPULATION
2,866
MALE POPULATION
2,717
FEMALE POPULATION
105.48
MALES / 100 FEMALES
94.80
FEMALES / 100 MALES
57.5
MEDIAN AGE
2.8
AVG FAMILY SIZE
2.2
AVG HOUSEHOLD SIZE
2,791
LABOR FORCE [ PEOPLE ]
58.2%
PERCENT IN LABOR FORCE
7.6%
UNEMPLOYMENT RATE
Income in Franklin Center
Income Overview in Franklin Center
Per Capita Income in Franklin Center is $72,874, while median incomes of families and households are $171,420 and $132,787 respectively.
| Characteristic | Number | Measure |
| Per Capita Income | 5,583 | $72,874 |
| Median Family Income | 1,486 | $171,420 |
| Mean Family Income | 1,486 | $189,221 |
| Median Household Income | 2,456 | $132,787 |
| Mean Household Income | 2,456 | $155,239 |
| Income Deficit | 1,486 | $0 |
| Wage / Income Gap (%) | 5,583 | 13.42% |
| Wage / Income Gap ($) | 5,583 | 86.58¢ per $1 |
| Gini / Inequality Index | 5,583 | 0.41 |
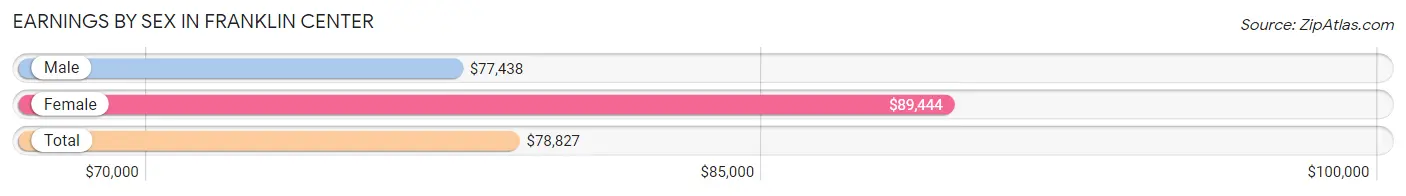
Earnings by Sex in Franklin Center
Average Earnings in Franklin Center are $78,827, $77,438 for men and $89,444 for women, a difference of 13.4%.
| Sex | Number | Average Earnings |
| Male | 1,690 (58.8%) | $77,438 |
| Female | 1,182 (41.2%) | $89,444 |
| Total | 2,872 (100.0%) | $78,827 |
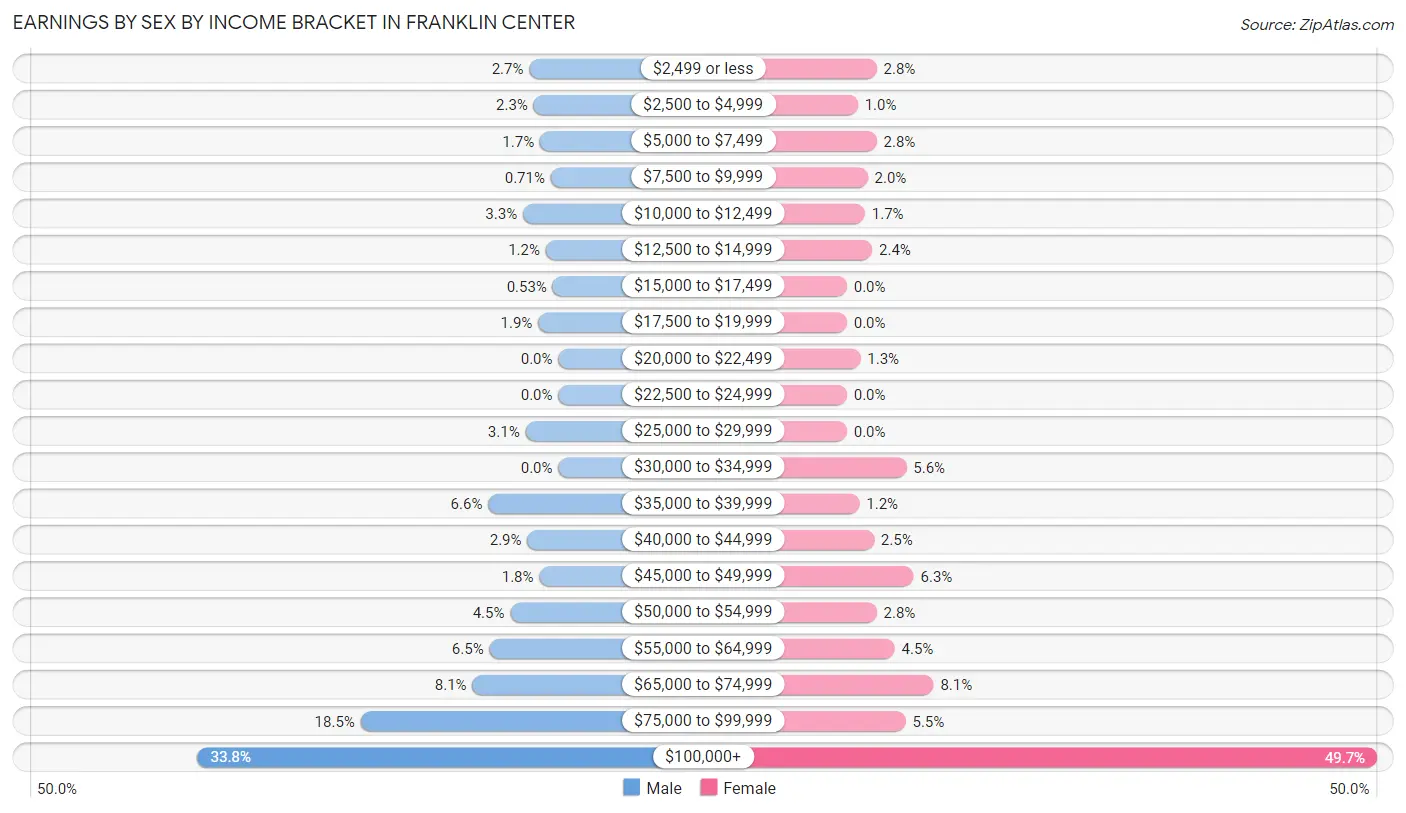
Earnings by Sex by Income Bracket in Franklin Center
The most common earnings brackets in Franklin Center are $100,000+ for men (571 | 33.8%) and $100,000+ for women (587 | 49.7%).
| Income | Male | Female |
| $2,499 or less | 46 (2.7%) | 33 (2.8%) |
| $2,500 to $4,999 | 39 (2.3%) | 12 (1.0%) |
| $5,000 to $7,499 | 29 (1.7%) | 33 (2.8%) |
| $7,500 to $9,999 | 12 (0.7%) | 23 (1.9%) |
| $10,000 to $12,499 | 56 (3.3%) | 20 (1.7%) |
| $12,500 to $14,999 | 20 (1.2%) | 28 (2.4%) |
| $15,000 to $17,499 | 9 (0.5%) | 0 (0.0%) |
| $17,500 to $19,999 | 32 (1.9%) | 0 (0.0%) |
| $20,000 to $22,499 | 0 (0.0%) | 15 (1.3%) |
| $22,500 to $24,999 | 0 (0.0%) | 0 (0.0%) |
| $25,000 to $29,999 | 52 (3.1%) | 0 (0.0%) |
| $30,000 to $34,999 | 0 (0.0%) | 66 (5.6%) |
| $35,000 to $39,999 | 111 (6.6%) | 14 (1.2%) |
| $40,000 to $44,999 | 49 (2.9%) | 30 (2.5%) |
| $45,000 to $49,999 | 30 (1.8%) | 74 (6.3%) |
| $50,000 to $54,999 | 76 (4.5%) | 33 (2.8%) |
| $55,000 to $64,999 | 109 (6.5%) | 53 (4.5%) |
| $65,000 to $74,999 | 136 (8.1%) | 96 (8.1%) |
| $75,000 to $99,999 | 313 (18.5%) | 65 (5.5%) |
| $100,000+ | 571 (33.8%) | 587 (49.7%) |
| Total | 1,690 (100.0%) | 1,182 (100.0%) |
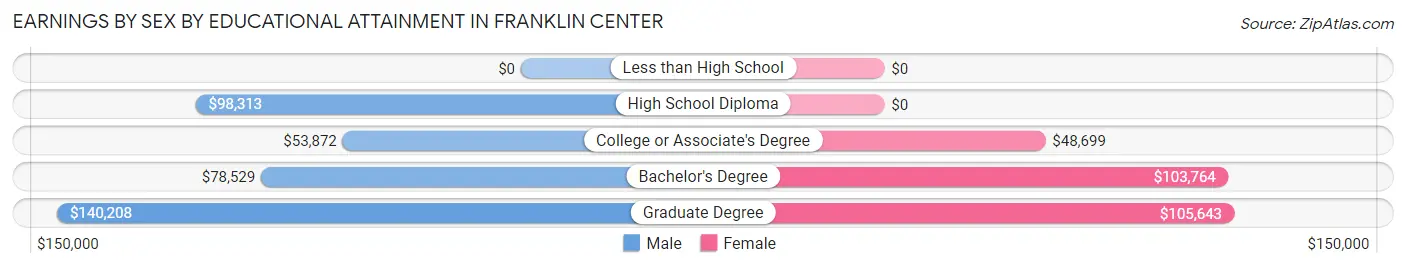
Earnings by Sex by Educational Attainment in Franklin Center
Average earnings in Franklin Center are $78,440 for men and $100,875 for women, a difference of 22.2%. Men with an educational attainment of graduate degree enjoy the highest average annual earnings of $140,208, while those with college or associate's degree education earn the least with $53,872. Women with an educational attainment of graduate degree earn the most with the average annual earnings of $105,643, while those with college or associate's degree education have the smallest earnings of $48,699.
| Educational Attainment | Male Income | Female Income |
| Less than High School | - | - |
| High School Diploma | $98,313 | $0 |
| College or Associate's Degree | $53,872 | $48,699 |
| Bachelor's Degree | $78,529 | $103,764 |
| Graduate Degree | $140,208 | $105,643 |
| Total | $78,440 | $100,875 |
Family Income in Franklin Center
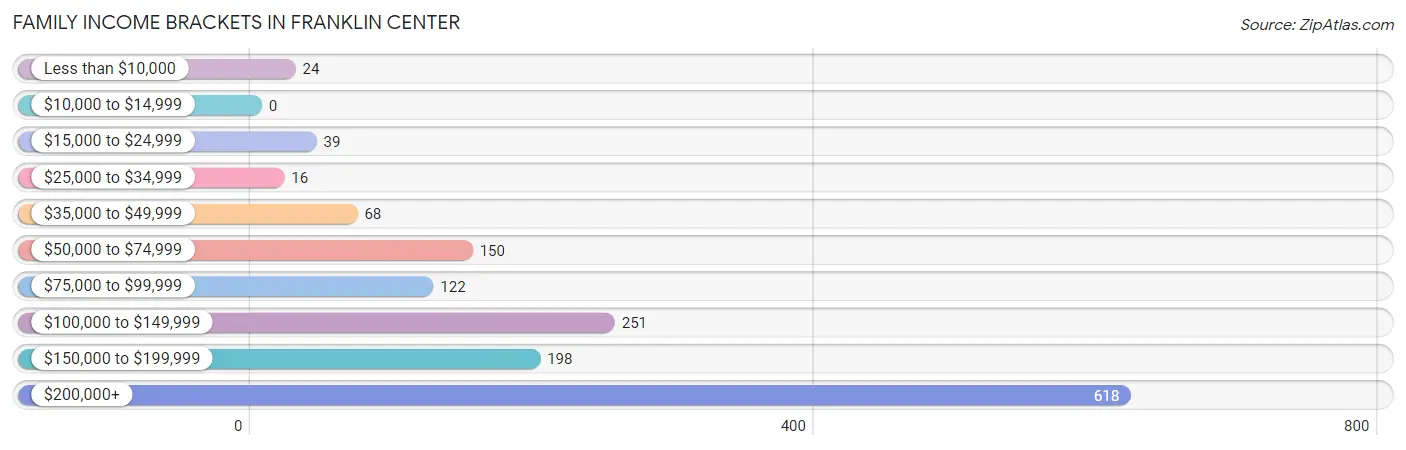
Family Income Brackets in Franklin Center
According to the Franklin Center family income data, there are 618 families falling into the $200,000+ income range, which is the most common income bracket and makes up 41.6% of all families.
| Income Bracket | # Families | % Families |
| Less than $10,000 | 24 | 1.6% |
| $10,000 to $14,999 | 0 | 0.0% |
| $15,000 to $24,999 | 39 | 2.6% |
| $25,000 to $34,999 | 16 | 1.1% |
| $35,000 to $49,999 | 68 | 4.6% |
| $50,000 to $74,999 | 150 | 10.1% |
| $75,000 to $99,999 | 122 | 8.2% |
| $100,000 to $149,999 | 251 | 16.9% |
| $150,000 to $199,999 | 198 | 13.3% |
| $200,000+ | 618 | 41.6% |
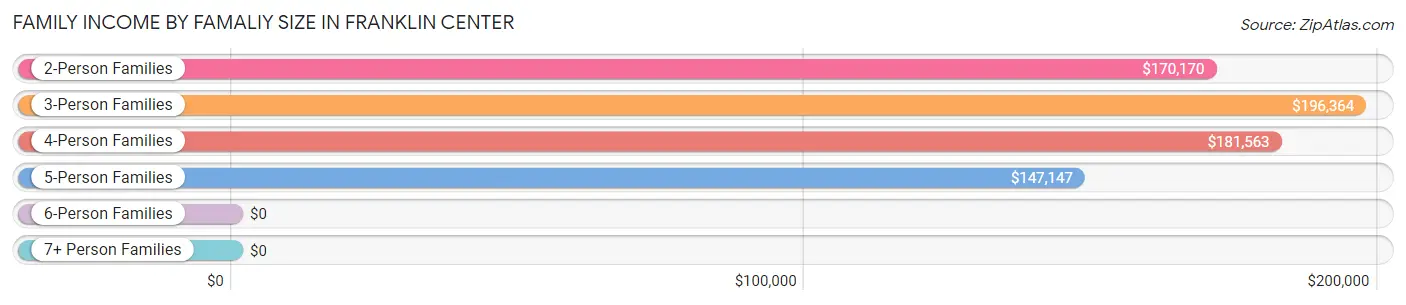
Family Income by Famaliy Size in Franklin Center
3-person families (318 | 21.4%) account for the highest median family income in Franklin Center with $196,364 per family, while 2-person families (928 | 62.5%) have the highest median income of $85,085 per family member.
| Income Bracket | # Families | Median Income |
| 2-Person Families | 928 (62.5%) | $170,170 |
| 3-Person Families | 318 (21.4%) | $196,364 |
| 4-Person Families | 98 (6.6%) | $181,563 |
| 5-Person Families | 75 (5.1%) | $147,147 |
| 6-Person Families | 67 (4.5%) | $0 |
| 7+ Person Families | 0 (0.0%) | $0 |
| Total | 1,486 (100.0%) | $171,420 |
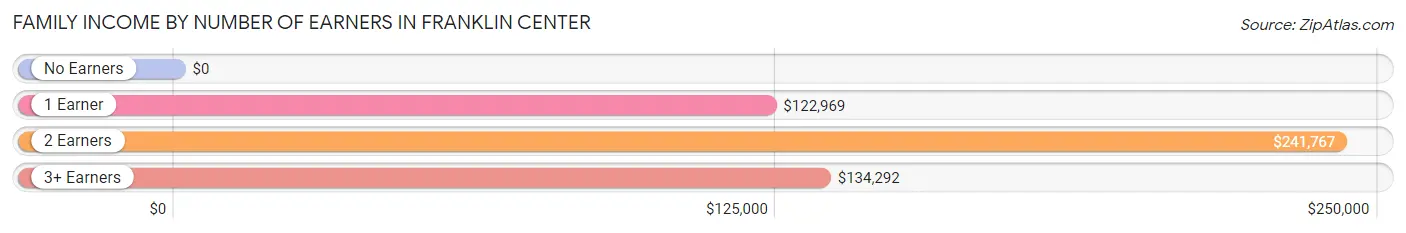
Family Income by Number of Earners in Franklin Center
| Number of Earners | # Families | Median Income |
| No Earners | 417 (28.1%) | $0 |
| 1 Earner | 317 (21.3%) | $122,969 |
| 2 Earners | 580 (39.0%) | $241,767 |
| 3+ Earners | 172 (11.6%) | $134,292 |
| Total | 1,486 (100.0%) | $171,420 |
Household Income in Franklin Center
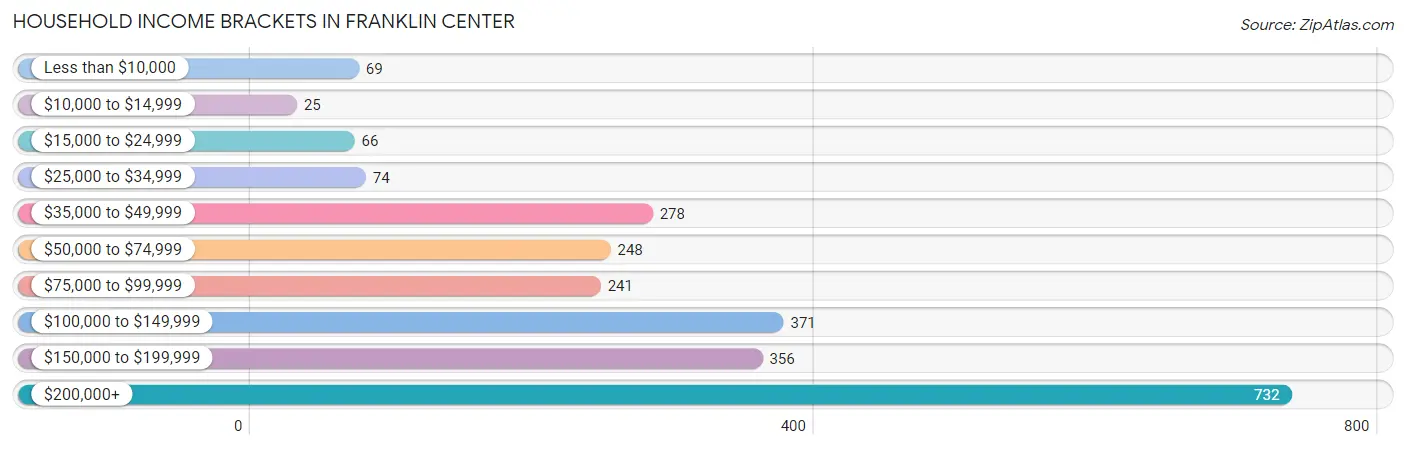
Household Income Brackets in Franklin Center
With 732 households falling in the category, the $200,000+ income range is the most frequent in Franklin Center, accounting for 29.8% of all households. In contrast, only 25 households (1.0%) fall into the $10,000 to $14,999 income bracket, making it the least populous group.
| Income Bracket | # Households | % Households |
| Less than $10,000 | 69 | 2.8% |
| $10,000 to $14,999 | 25 | 1.0% |
| $15,000 to $24,999 | 66 | 2.7% |
| $25,000 to $34,999 | 74 | 3.0% |
| $35,000 to $49,999 | 278 | 11.3% |
| $50,000 to $74,999 | 248 | 10.1% |
| $75,000 to $99,999 | 241 | 9.8% |
| $100,000 to $149,999 | 371 | 15.1% |
| $150,000 to $199,999 | 356 | 14.5% |
| $200,000+ | 732 | 29.8% |
Household Income by Householder Age in Franklin Center
The median household income in Franklin Center is $132,787, with the highest median household income of $221,583 found in the 45 to 64 years age bracket for the primary householder. A total of 639 households (26.0%) fall into this category. Meanwhile, the 15 to 24 years age bracket for the primary householder has the lowest median household income of $0, with 44 households (1.8%) in this group.
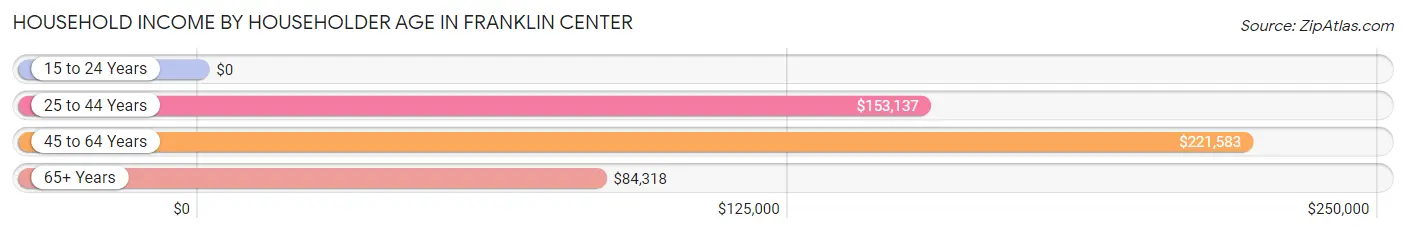
| Income Bracket | # Households | Median Income |
| 15 to 24 Years | 44 (1.8%) | $0 |
| 25 to 44 Years | 577 (23.5%) | $153,137 |
| 45 to 64 Years | 639 (26.0%) | $221,583 |
| 65+ Years | 1,196 (48.7%) | $84,318 |
| Total | 2,456 (100.0%) | $132,787 |
Poverty in Franklin Center
Income Below Poverty by Sex and Age in Franklin Center
With 3.3% poverty level for males and 5.0% for females among the residents of Franklin Center, 35 to 44 year old males and 5 year old females are the most vulnerable to poverty, with 24 males (8.5%) and 24 females (43.6%) in their respective age groups living below the poverty level.
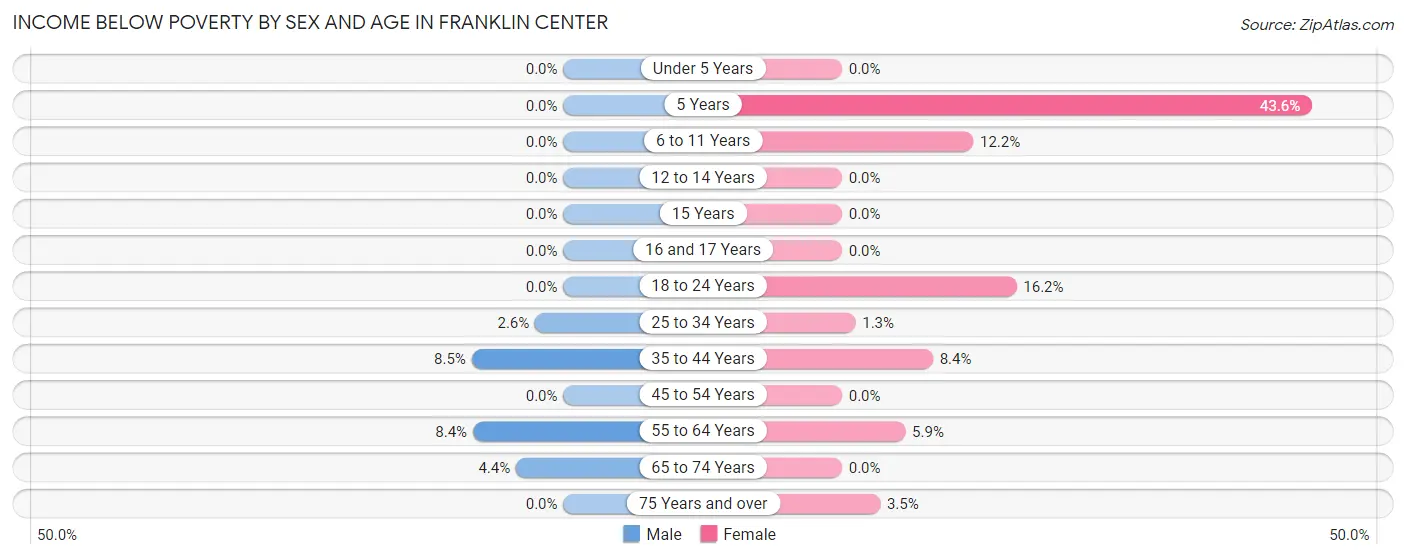
| Age Bracket | Male | Female |
| Under 5 Years | 0 (0.0%) | 0 (0.0%) |
| 5 Years | 0 (0.0%) | 24 (43.6%) |
| 6 to 11 Years | 0 (0.0%) | 24 (12.2%) |
| 12 to 14 Years | 0 (0.0%) | 0 (0.0%) |
| 15 Years | 0 (0.0%) | 0 (0.0%) |
| 16 and 17 Years | 0 (0.0%) | 0 (0.0%) |
| 18 to 24 Years | 0 (0.0%) | 23 (16.2%) |
| 25 to 34 Years | 10 (2.6%) | 2 (1.3%) |
| 35 to 44 Years | 24 (8.5%) | 26 (8.4%) |
| 45 to 54 Years | 0 (0.0%) | 0 (0.0%) |
| 55 to 64 Years | 35 (8.4%) | 18 (5.9%) |
| 65 to 74 Years | 25 (4.4%) | 0 (0.0%) |
| 75 Years and over | 0 (0.0%) | 18 (3.5%) |
| Total | 94 (3.3%) | 135 (5.0%) |
Income Above Poverty by Sex and Age in Franklin Center
According to the poverty statistics in Franklin Center, males aged under 5 years and females aged under 5 years are the age groups that are most secure financially, with 100.0% of males and 100.0% of females in these age groups living above the poverty line.
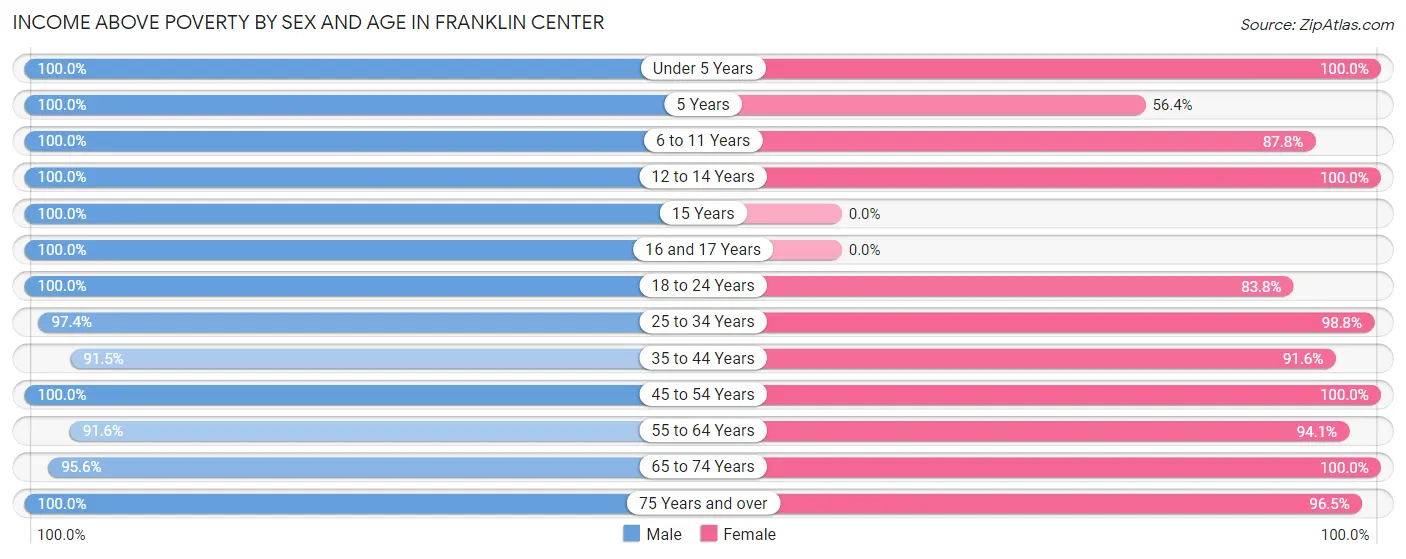
| Age Bracket | Male | Female |
| Under 5 Years | 143 (100.0%) | 44 (100.0%) |
| 5 Years | 47 (100.0%) | 31 (56.4%) |
| 6 to 11 Years | 156 (100.0%) | 173 (87.8%) |
| 12 to 14 Years | 75 (100.0%) | 22 (100.0%) |
| 15 Years | 44 (100.0%) | 0 (0.0%) |
| 16 and 17 Years | 46 (100.0%) | 0 (0.0%) |
| 18 to 24 Years | 53 (100.0%) | 119 (83.8%) |
| 25 to 34 Years | 371 (97.4%) | 158 (98.8%) |
| 35 to 44 Years | 258 (91.5%) | 282 (91.6%) |
| 45 to 54 Years | 322 (100.0%) | 161 (100.0%) |
| 55 to 64 Years | 382 (91.6%) | 288 (94.1%) |
| 65 to 74 Years | 544 (95.6%) | 789 (100.0%) |
| 75 Years and over | 327 (100.0%) | 490 (96.5%) |
| Total | 2,768 (96.7%) | 2,557 (95.0%) |
Income Below Poverty Among Married-Couple Families in Franklin Center
The poverty statistics for married-couple families in Franklin Center show that 1.7% or 24 of the total 1,397 families live below the poverty line. Families with 1 or 2 children have the highest poverty rate of 7.4%, comprising of 24 families. On the other hand, families with no children have the lowest poverty rate of 0.0%, which includes 0 families.
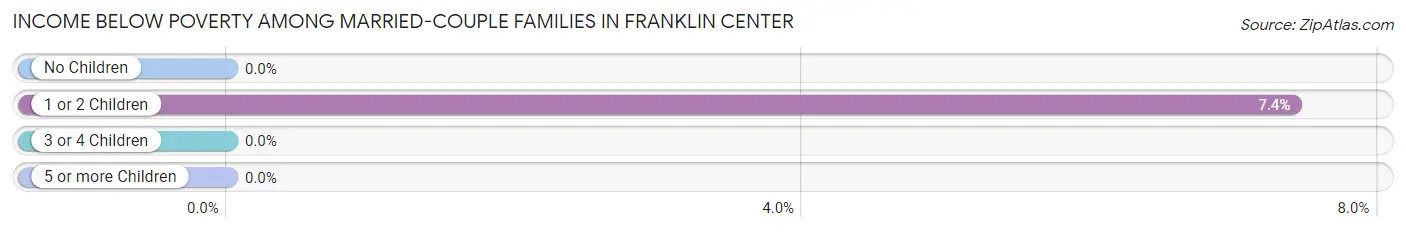
| Children | Above Poverty | Below Poverty |
| No Children | 1,011 (100.0%) | 0 (0.0%) |
| 1 or 2 Children | 300 (92.6%) | 24 (7.4%) |
| 3 or 4 Children | 62 (100.0%) | 0 (0.0%) |
| 5 or more Children | 0 (0.0%) | 0 (0.0%) |
| Total | 1,373 (98.3%) | 24 (1.7%) |
Income Below Poverty Among Single-Parent Households in Franklin Center
| Children | Single Father | Single Mother |
| No Children | 0 (0.0%) | 0 (0.0%) |
| 1 or 2 Children | 0 (0.0%) | 0 (0.0%) |
| 3 or 4 Children | 0 (0.0%) | 0 (0.0%) |
| 5 or more Children | 0 (0.0%) | 0 (0.0%) |
| Total | 0 (0.0%) | 0 (0.0%) |
Income Below Poverty Among Married-Couple vs Single-Parent Households in Franklin Center
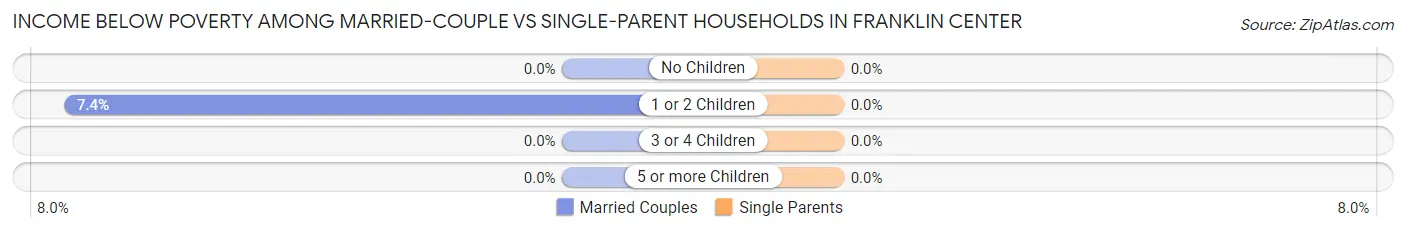
| Children | Married-Couple Families | Single-Parent Households |
| No Children | 0 (0.0%) | 0 (0.0%) |
| 1 or 2 Children | 24 (7.4%) | 0 (0.0%) |
| 3 or 4 Children | 0 (0.0%) | 0 (0.0%) |
| 5 or more Children | 0 (0.0%) | 0 (0.0%) |
| Total | 24 (1.7%) | 0 (0.0%) |
Race in Franklin Center
The most populous races in Franklin Center are White / Caucasian (3,043 | 54.5%), Asian (1,603 | 28.7%), and Hispanic or Latino (679 | 12.2%).
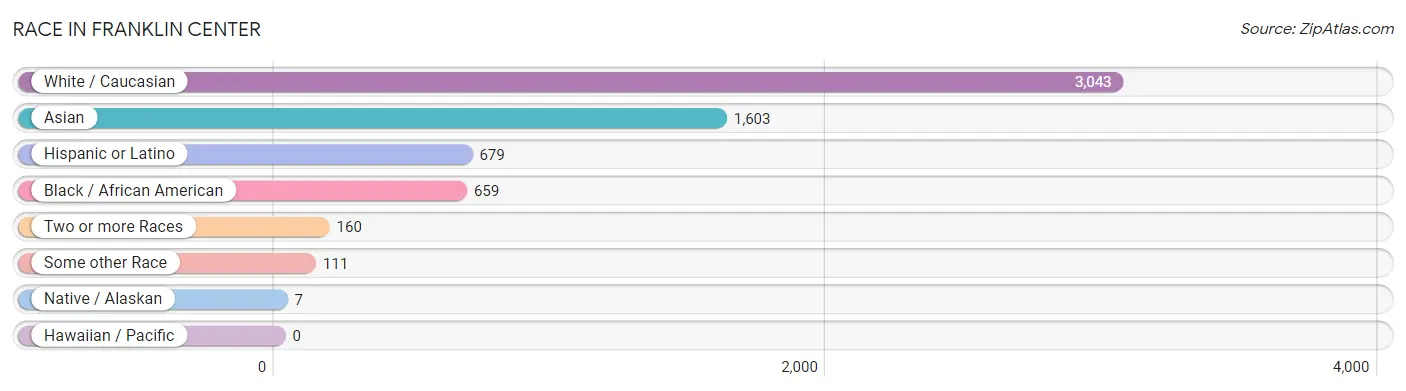
| Race | # Population | % Population |
| Asian | 1,603 | 28.7% |
| Black / African American | 659 | 11.8% |
| Hawaiian / Pacific | 0 | 0.0% |
| Hispanic or Latino | 679 | 12.2% |
| Native / Alaskan | 7 | 0.1% |
| White / Caucasian | 3,043 | 54.5% |
| Two or more Races | 160 | 2.9% |
| Some other Race | 111 | 2.0% |
| Total | 5,583 | 100.0% |
Ancestry in Franklin Center
The most populous ancestries reported in Franklin Center are Thai (859 | 15.4%), Polish (628 | 11.3%), Russian (530 | 9.5%), Irish (471 | 8.4%), and Italian (421 | 7.5%), together accounting for 52.1% of all Franklin Center residents.
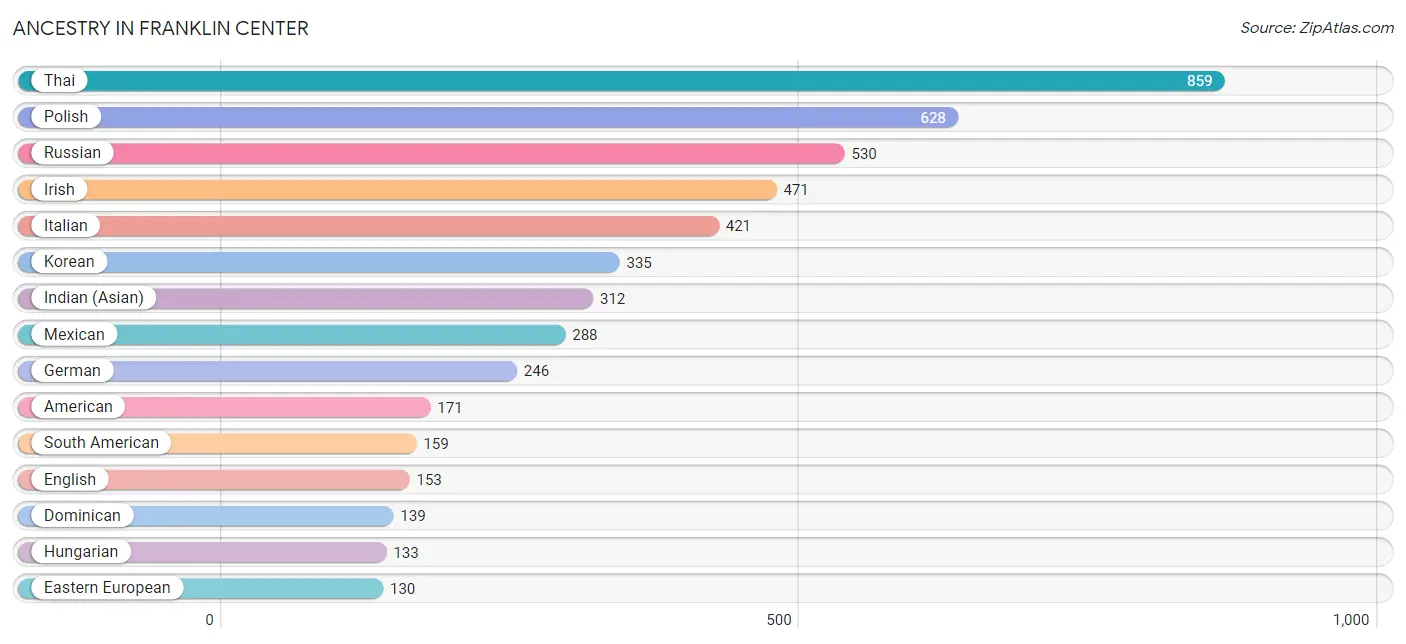
| Ancestry | # Population | % Population |
| African | 64 | 1.1% |
| American | 171 | 3.1% |
| Arab | 54 | 1.0% |
| Austrian | 44 | 0.8% |
| British | 18 | 0.3% |
| Burmese | 57 | 1.0% |
| Canadian | 18 | 0.3% |
| Central American Indian | 22 | 0.4% |
| Chickasaw | 7 | 0.1% |
| Chilean | 40 | 0.7% |
| Colombian | 66 | 1.2% |
| Cuban | 43 | 0.8% |
| Czechoslovakian | 11 | 0.2% |
| Dominican | 139 | 2.5% |
| Eastern European | 130 | 2.3% |
| Egyptian | 39 | 0.7% |
| English | 153 | 2.7% |
| European | 19 | 0.3% |
| Filipino | 18 | 0.3% |
| French Canadian | 24 | 0.4% |
| German | 246 | 4.4% |
| Greek | 18 | 0.3% |
| Haitian | 21 | 0.4% |
| Hungarian | 133 | 2.4% |
| Indian (Asian) | 312 | 5.6% |
| Irish | 471 | 8.4% |
| Italian | 421 | 7.5% |
| Jamaican | 84 | 1.5% |
| Korean | 335 | 6.0% |
| Latvian | 37 | 0.7% |
| Mexican | 288 | 5.2% |
| Norwegian | 11 | 0.2% |
| Peruvian | 53 | 0.9% |
| Polish | 628 | 11.3% |
| Puerto Rican | 47 | 0.8% |
| Romanian | 18 | 0.3% |
| Russian | 530 | 9.5% |
| Slavic | 25 | 0.4% |
| Slovak | 27 | 0.5% |
| South American | 159 | 2.9% |
| Subsaharan African | 64 | 1.1% |
| Swedish | 22 | 0.4% |
| Swiss | 16 | 0.3% |
| Thai | 859 | 15.4% |
| Ukrainian | 23 | 0.4% | View All 45 Rows |
Immigrants in Franklin Center
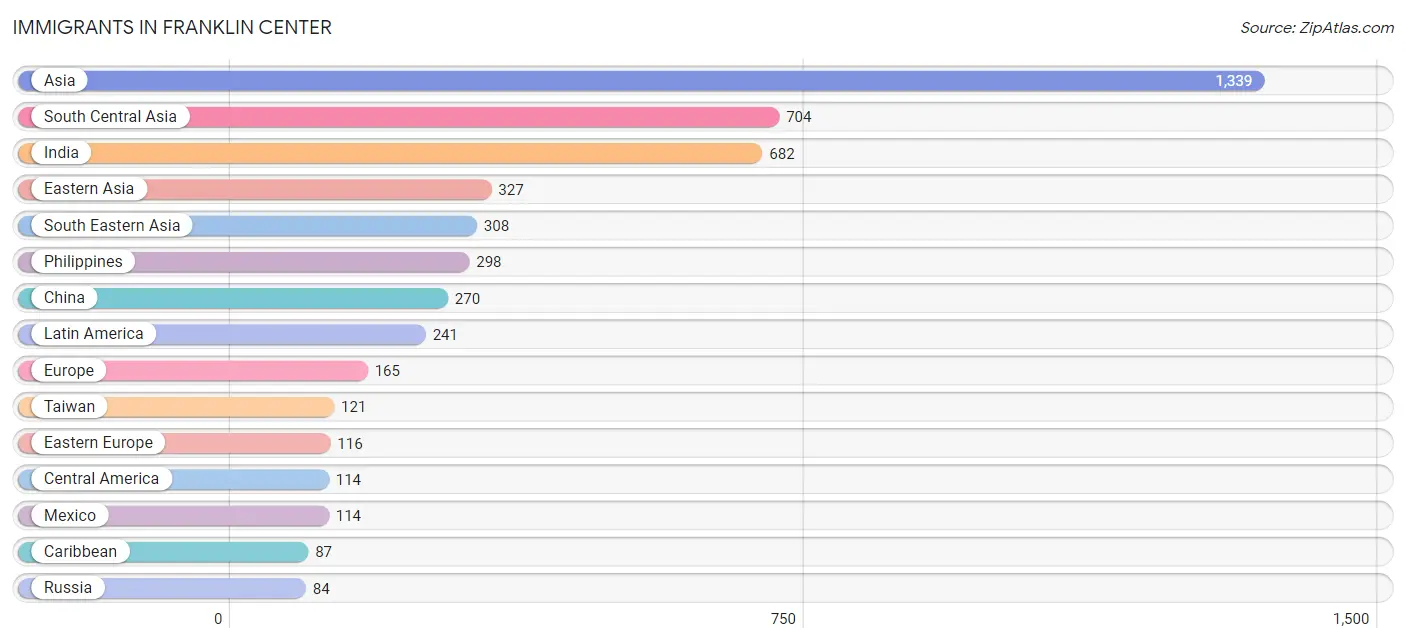
The most numerous immigrant groups reported in Franklin Center came from Asia (1,339 | 24.0%), South Central Asia (704 | 12.6%), India (682 | 12.2%), Eastern Asia (327 | 5.9%), and South Eastern Asia (308 | 5.5%), together accounting for 60.2% of all Franklin Center residents.
| Immigration Origin | # Population | % Population |
| Africa | 37 | 0.7% |
| Asia | 1,339 | 24.0% |
| Canada | 18 | 0.3% |
| Caribbean | 87 | 1.6% |
| Central America | 114 | 2.0% |
| Chile | 40 | 0.7% |
| China | 270 | 4.8% |
| Croatia | 13 | 0.2% |
| Cuba | 43 | 0.8% |
| Eastern Asia | 327 | 5.9% |
| Eastern Europe | 116 | 2.1% |
| Egypt | 26 | 0.5% |
| Europe | 165 | 3.0% |
| Germany | 16 | 0.3% |
| Haiti | 21 | 0.4% |
| Hong Kong | 37 | 0.7% |
| Hungary | 18 | 0.3% |
| India | 682 | 12.2% |
| Ireland | 18 | 0.3% |
| Italy | 15 | 0.3% |
| Jamaica | 23 | 0.4% |
| Korea | 57 | 1.0% |
| Latin America | 241 | 4.3% |
| Mexico | 114 | 2.0% |
| Northern Africa | 26 | 0.5% |
| Northern Europe | 18 | 0.3% |
| Pakistan | 22 | 0.4% |
| Philippines | 298 | 5.3% |
| Poland | 1 | 0.0% |
| Russia | 84 | 1.5% |
| Sierra Leone | 11 | 0.2% |
| South America | 40 | 0.7% |
| South Central Asia | 704 | 12.6% |
| South Eastern Asia | 308 | 5.5% |
| Southern Europe | 15 | 0.3% |
| Taiwan | 121 | 2.2% |
| Vietnam | 10 | 0.2% |
| Western Africa | 11 | 0.2% |
| Western Europe | 16 | 0.3% | View All 39 Rows |
Sex and Age in Franklin Center
Sex and Age in Franklin Center
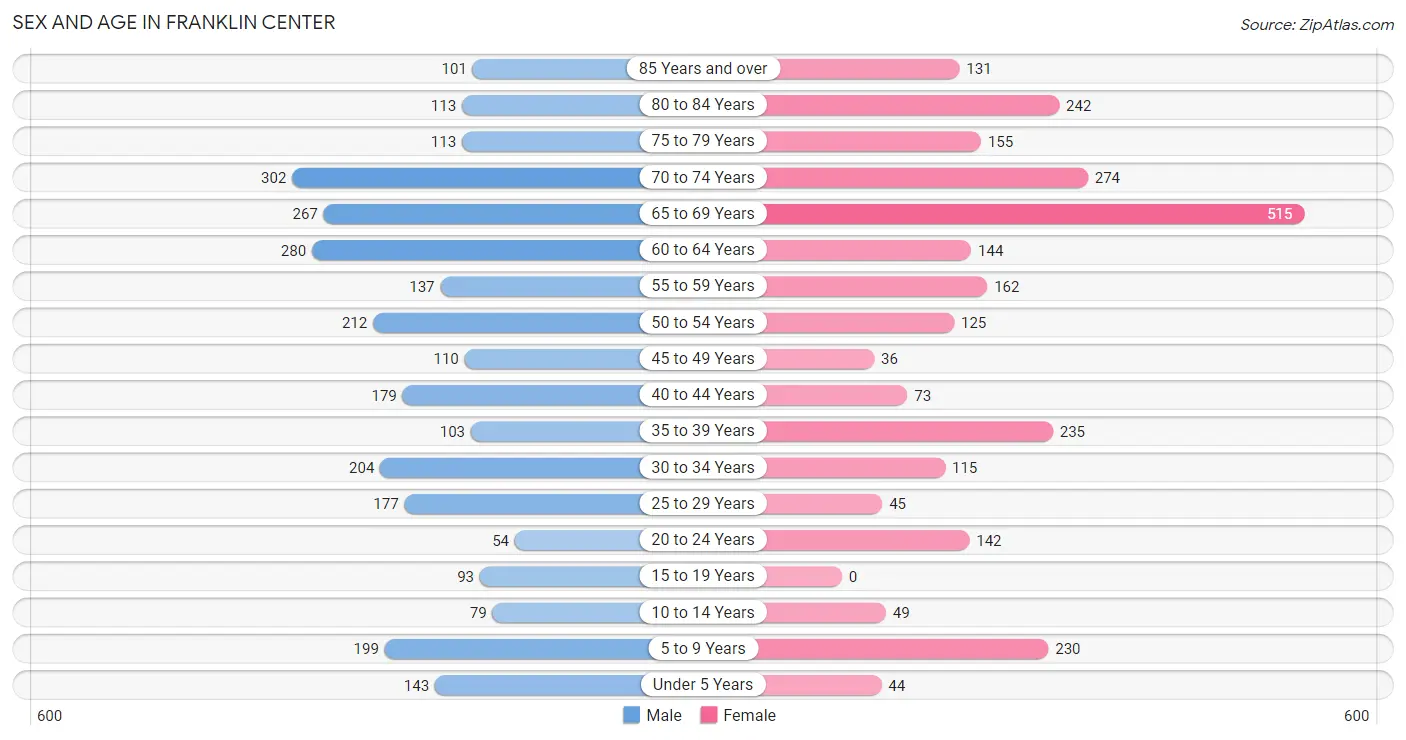
The most populous age groups in Franklin Center are 70 to 74 Years (302 | 10.5%) for men and 65 to 69 Years (515 | 19.0%) for women.
| Age Bracket | Male | Female |
| Under 5 Years | 143 (5.0%) | 44 (1.6%) |
| 5 to 9 Years | 199 (6.9%) | 230 (8.5%) |
| 10 to 14 Years | 79 (2.8%) | 49 (1.8%) |
| 15 to 19 Years | 93 (3.2%) | 0 (0.0%) |
| 20 to 24 Years | 54 (1.9%) | 142 (5.2%) |
| 25 to 29 Years | 177 (6.2%) | 45 (1.7%) |
| 30 to 34 Years | 204 (7.1%) | 115 (4.2%) |
| 35 to 39 Years | 103 (3.6%) | 235 (8.6%) |
| 40 to 44 Years | 179 (6.2%) | 73 (2.7%) |
| 45 to 49 Years | 110 (3.8%) | 36 (1.3%) |
| 50 to 54 Years | 212 (7.4%) | 125 (4.6%) |
| 55 to 59 Years | 137 (4.8%) | 162 (6.0%) |
| 60 to 64 Years | 280 (9.8%) | 144 (5.3%) |
| 65 to 69 Years | 267 (9.3%) | 515 (19.0%) |
| 70 to 74 Years | 302 (10.5%) | 274 (10.1%) |
| 75 to 79 Years | 113 (3.9%) | 155 (5.7%) |
| 80 to 84 Years | 113 (3.9%) | 242 (8.9%) |
| 85 Years and over | 101 (3.5%) | 131 (4.8%) |
| Total | 2,866 (100.0%) | 2,717 (100.0%) |
Families and Households in Franklin Center
Median Family Size in Franklin Center
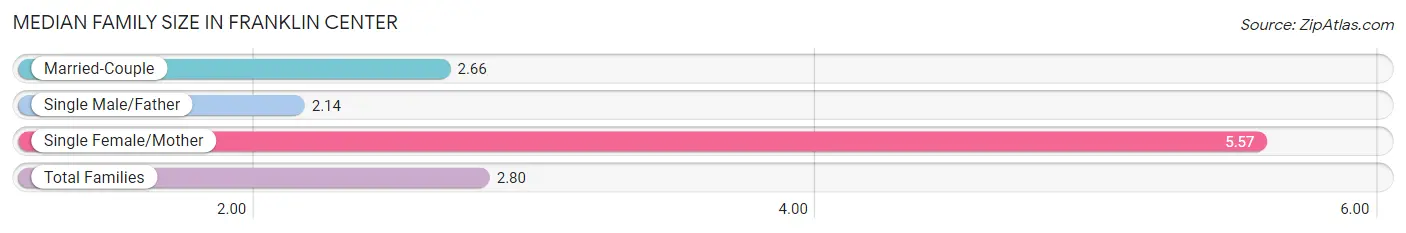
The median family size in Franklin Center is 2.80 persons per family, with single female/mother families (75 | 5.1%) accounting for the largest median family size of 5.57 persons per family. On the other hand, single male/father families (14 | 0.9%) represent the smallest median family size with 2.14 persons per family.
| Family Type | # Families | Family Size |
| Married-Couple | 1,397 (94.0%) | 2.66 |
| Single Male/Father | 14 (0.9%) | 2.14 |
| Single Female/Mother | 75 (5.1%) | 5.57 |
| Total Families | 1,486 (100.0%) | 2.80 |
Median Household Size in Franklin Center
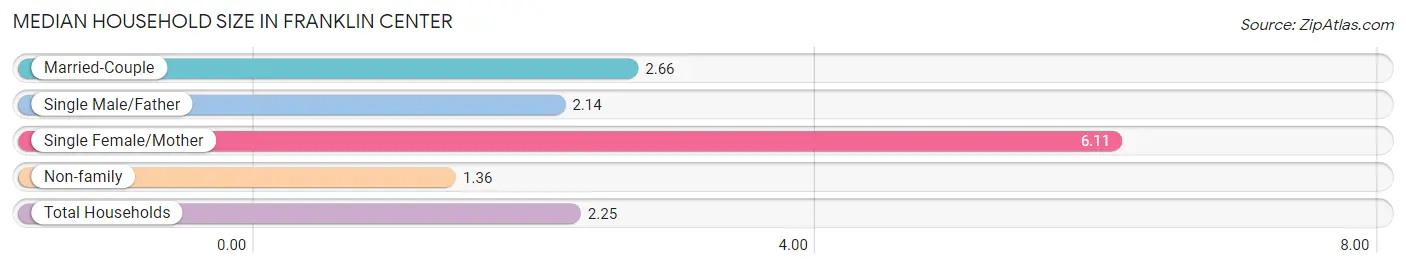
The median household size in Franklin Center is 2.25 persons per household, with single female/mother households (75 | 3.0%) accounting for the largest median household size of 6.11 persons per household. non-family households (970 | 39.5%) represent the smallest median household size with 1.36 persons per household.
| Household Type | # Households | Household Size |
| Married-Couple | 1,397 (56.9%) | 2.66 |
| Single Male/Father | 14 (0.6%) | 2.14 |
| Single Female/Mother | 75 (3.0%) | 6.11 |
| Non-family | 970 (39.5%) | 1.36 |
| Total Households | 2,456 (100.0%) | 2.25 |
Household Size by Marriage Status in Franklin Center
Out of a total of 2,456 households in Franklin Center, 1,486 (60.5%) are family households, while 970 (39.5%) are nonfamily households. The most numerous type of family households are 2-person households, comprising 928, and the most common type of nonfamily households are 1-person households, comprising 683.
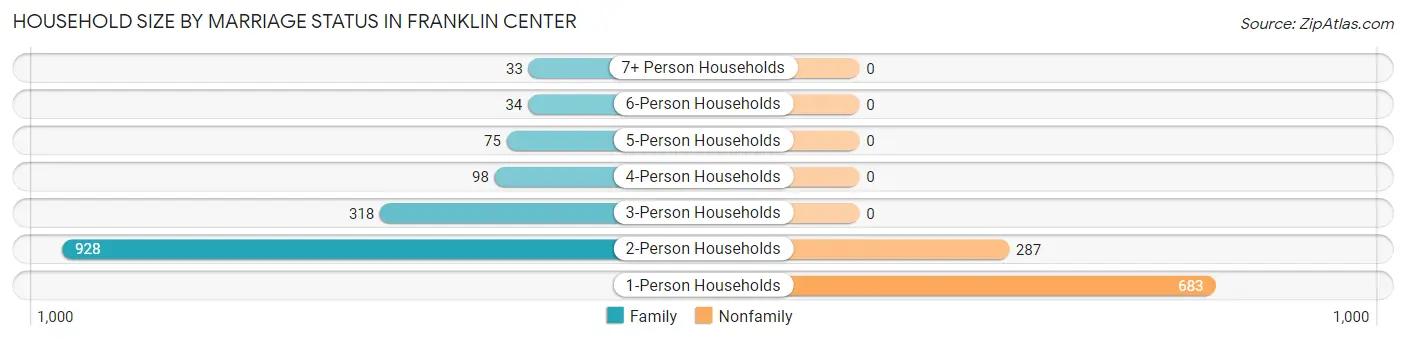
| Household Size | Family Households | Nonfamily Households |
| 1-Person Households | - | 683 (27.8%) |
| 2-Person Households | 928 (37.8%) | 287 (11.7%) |
| 3-Person Households | 318 (13.0%) | 0 (0.0%) |
| 4-Person Households | 98 (4.0%) | 0 (0.0%) |
| 5-Person Households | 75 (3.0%) | 0 (0.0%) |
| 6-Person Households | 34 (1.4%) | 0 (0.0%) |
| 7+ Person Households | 33 (1.3%) | 0 (0.0%) |
| Total | 1,486 (60.5%) | 970 (39.5%) |
Female Fertility in Franklin Center
Fertility by Age in Franklin Center
Average fertility rate in Franklin Center is 100.0 births per 1,000 women. Women in the age bracket of 20 to 34 years have the highest fertility rate with 132.0 births per 1,000 women. Women in the age bracket of 20 to 34 years acount for 61.5% of all women with births.
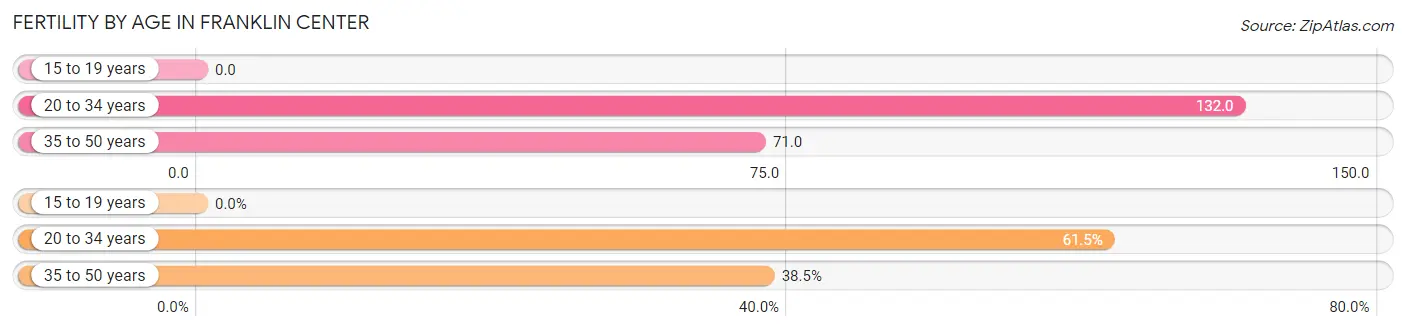
| Age Bracket | Women with Births | Births / 1,000 Women |
| 15 to 19 years | 0 (0.0%) | 0.0 |
| 20 to 34 years | 40 (61.5%) | 132.0 |
| 35 to 50 years | 25 (38.5%) | 71.0 |
| Total | 65 (100.0%) | 100.0 |
Fertility by Age by Marriage Status in Franklin Center
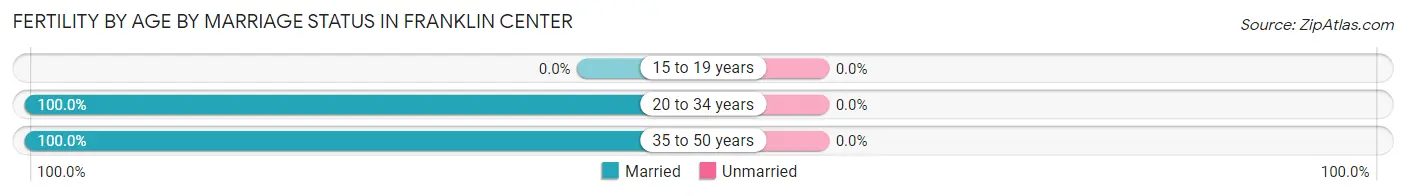
| Age Bracket | Married | Unmarried |
| 15 to 19 years | 0 (0.0%) | 0 (0.0%) |
| 20 to 34 years | 40 (100.0%) | 0 (0.0%) |
| 35 to 50 years | 25 (100.0%) | 0 (0.0%) |
| Total | 65 (100.0%) | 0 (0.0%) |
Fertility by Education in Franklin Center
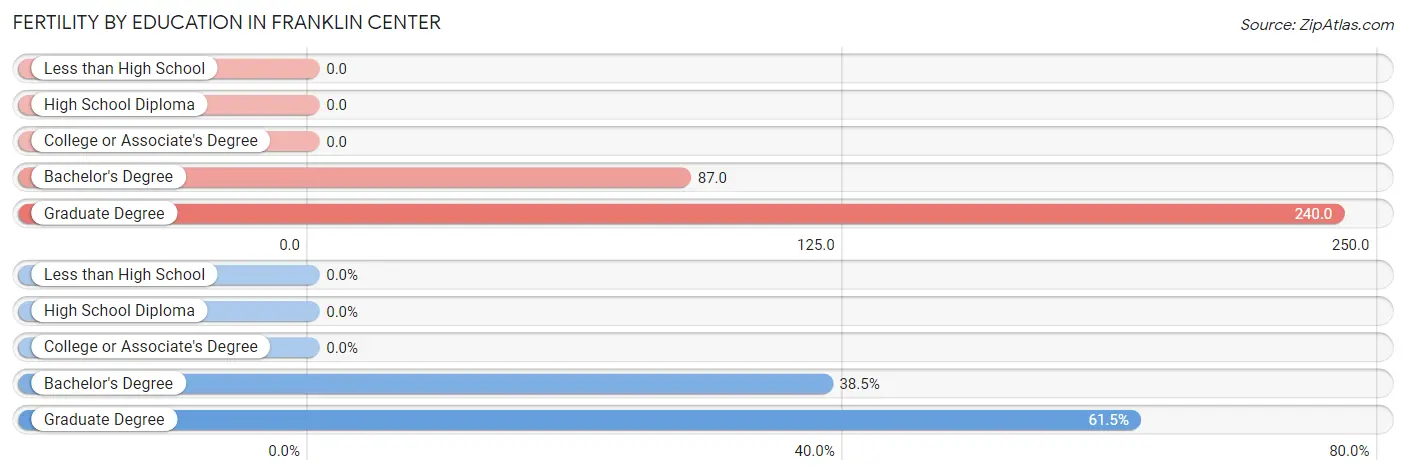
| Educational Attainment | Women with Births | Births / 1,000 Women |
| Less than High School | 0 (0.0%) | 0.0 |
| High School Diploma | 0 (0.0%) | 0.0 |
| College or Associate's Degree | 0 (0.0%) | 0.0 |
| Bachelor's Degree | 25 (38.5%) | 87.0 |
| Graduate Degree | 40 (61.5%) | 240.0 |
| Total | 65 (100.0%) | 100.0 |
Fertility by Education by Marriage Status in Franklin Center
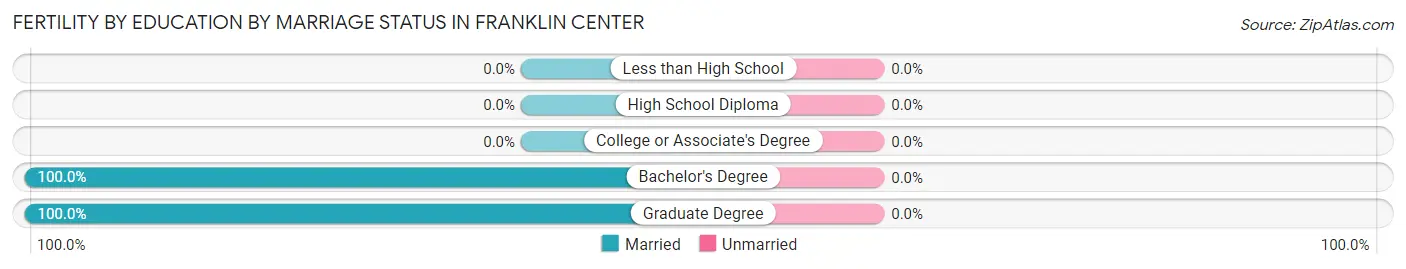
| Educational Attainment | Married | Unmarried |
| Less than High School | 0 (0.0%) | 0 (0.0%) |
| High School Diploma | 0 (0.0%) | 0 (0.0%) |
| College or Associate's Degree | 0 (0.0%) | 0 (0.0%) |
| Bachelor's Degree | 25 (100.0%) | 0 (0.0%) |
| Graduate Degree | 40 (100.0%) | 0 (0.0%) |
| Total | 65 (100.0%) | 0 (0.0%) |
Employment Characteristics in Franklin Center
Employment by Class of Employer in Franklin Center
Among the 2,563 employed individuals in Franklin Center, private company employees (1,966 | 76.7%), local government employees (249 | 9.7%), and self-employed (incorporated) (127 | 5.0%) make up the most common classes of employment.
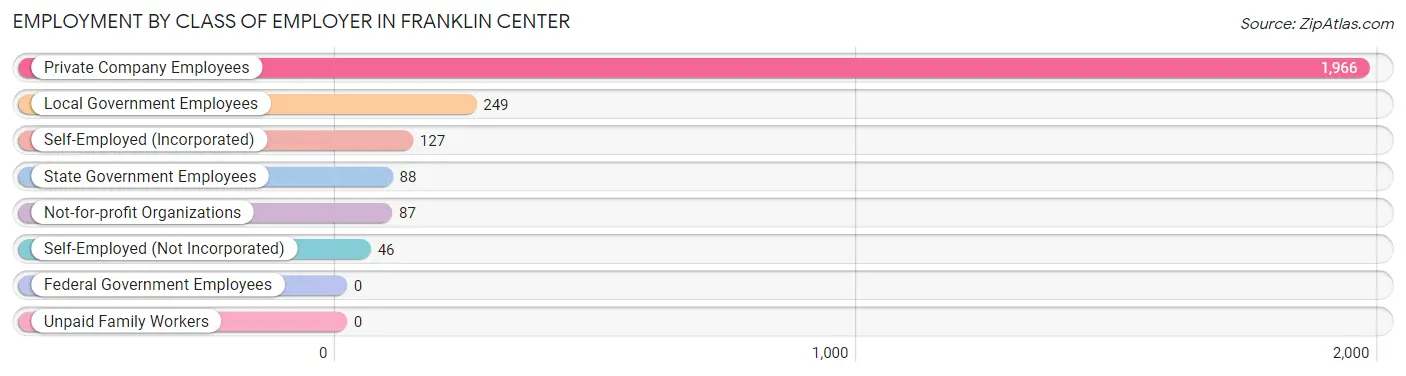
| Employer Class | # Employees | % Employees |
| Private Company Employees | 1,966 | 76.7% |
| Self-Employed (Incorporated) | 127 | 5.0% |
| Self-Employed (Not Incorporated) | 46 | 1.8% |
| Not-for-profit Organizations | 87 | 3.4% |
| Local Government Employees | 249 | 9.7% |
| State Government Employees | 88 | 3.4% |
| Federal Government Employees | 0 | 0.0% |
| Unpaid Family Workers | 0 | 0.0% |
| Total | 2,563 | 100.0% |
Employment Status by Age in Franklin Center
According to the labor force statistics for Franklin Center, out of the total population over 16 years of age (4,795), 58.2% or 2,791 individuals are in the labor force, with 7.6% or 212 of them unemployed. The age group with the highest labor force participation rate is 30 to 34 years, with 100.0% or 319 individuals in the labor force. Within the labor force, the 65 to 74 years age range has the highest percentage of unemployed individuals, with 31.4% or 163 of them being unemployed.
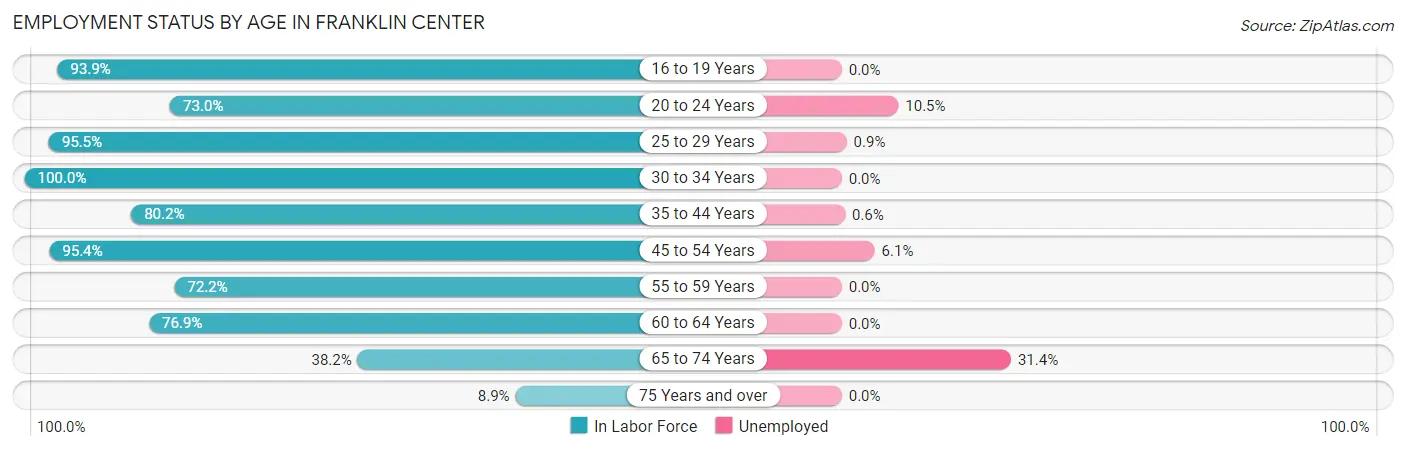
| Age Bracket | In Labor Force | Unemployed |
| 16 to 19 Years | 46 (93.9%) | 0 (0.0%) |
| 20 to 24 Years | 143 (73.0%) | 15 (10.5%) |
| 25 to 29 Years | 212 (95.5%) | 2 (0.9%) |
| 30 to 34 Years | 319 (100.0%) | 0 (0.0%) |
| 35 to 44 Years | 473 (80.2%) | 3 (0.6%) |
| 45 to 54 Years | 461 (95.4%) | 28 (6.1%) |
| 55 to 59 Years | 216 (72.2%) | 0 (0.0%) |
| 60 to 64 Years | 326 (76.9%) | 0 (0.0%) |
| 65 to 74 Years | 519 (38.2%) | 163 (31.4%) |
| 75 Years and over | 76 (8.9%) | 0 (0.0%) |
| Total | 2,791 (58.2%) | 212 (7.6%) |
Employment Status by Educational Attainment in Franklin Center
According to labor force statistics for Franklin Center, 85.9% of individuals (2,007) out of the total population between 25 and 64 years of age (2,337) are in the labor force, with 1.6% or 32 of them being unemployed. The group with the highest labor force participation rate are those with the educational attainment of college / associate degree, with 91.5% or 292 individuals in the labor force. Within the labor force, individuals with high school diploma education have the highest percentage of unemployment, with 7.5% or 17 of them being unemployed.
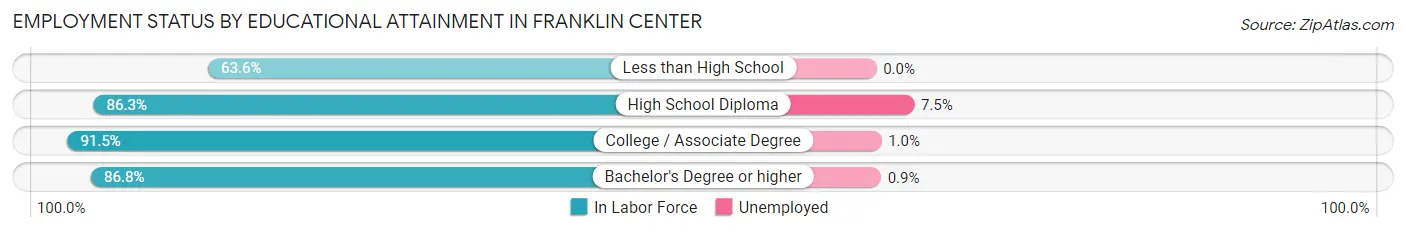
| Educational Attainment | In Labor Force | Unemployed |
| Less than High School | 96 (63.6%) | 0 (0.0%) |
| High School Diploma | 227 (86.3%) | 20 (7.5%) |
| College / Associate Degree | 292 (91.5%) | 3 (1.0%) |
| Bachelor's Degree or higher | 1,392 (86.8%) | 14 (0.9%) |
| Total | 2,007 (85.9%) | 37 (1.6%) |
Employment Occupations by Sex in Franklin Center
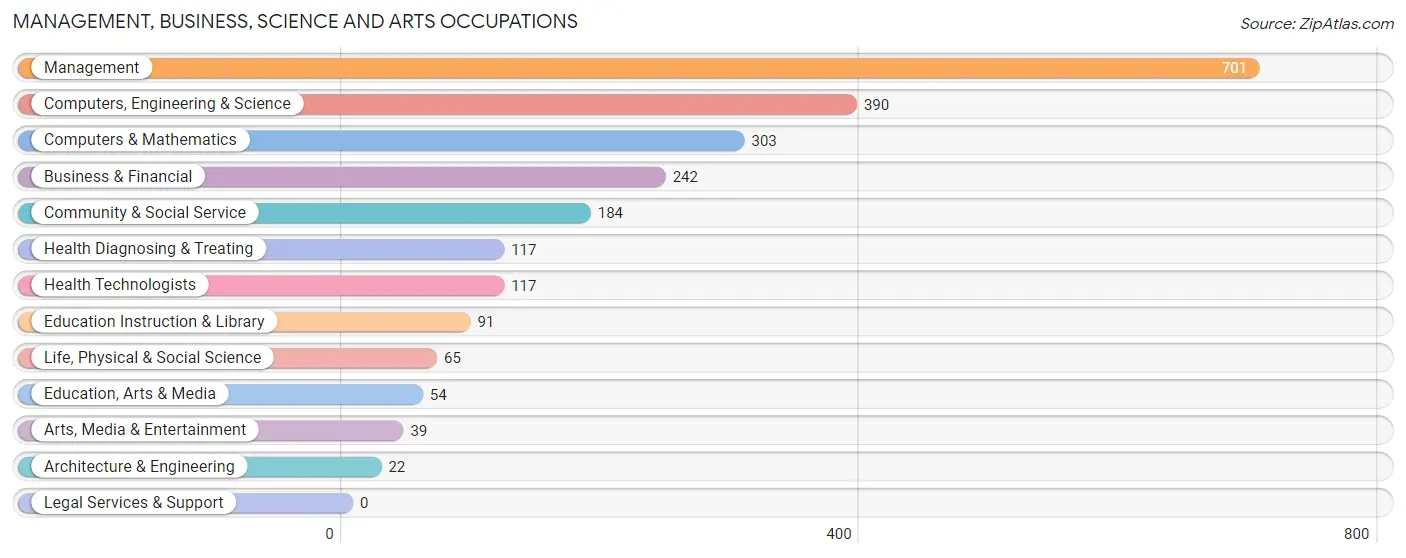
Management, Business, Science and Arts Occupations
The most common Management, Business, Science and Arts occupations in Franklin Center are Management (701 | 27.2%), Computers, Engineering & Science (390 | 15.1%), Computers & Mathematics (303 | 11.7%), Business & Financial (242 | 9.4%), and Community & Social Service (184 | 7.1%).
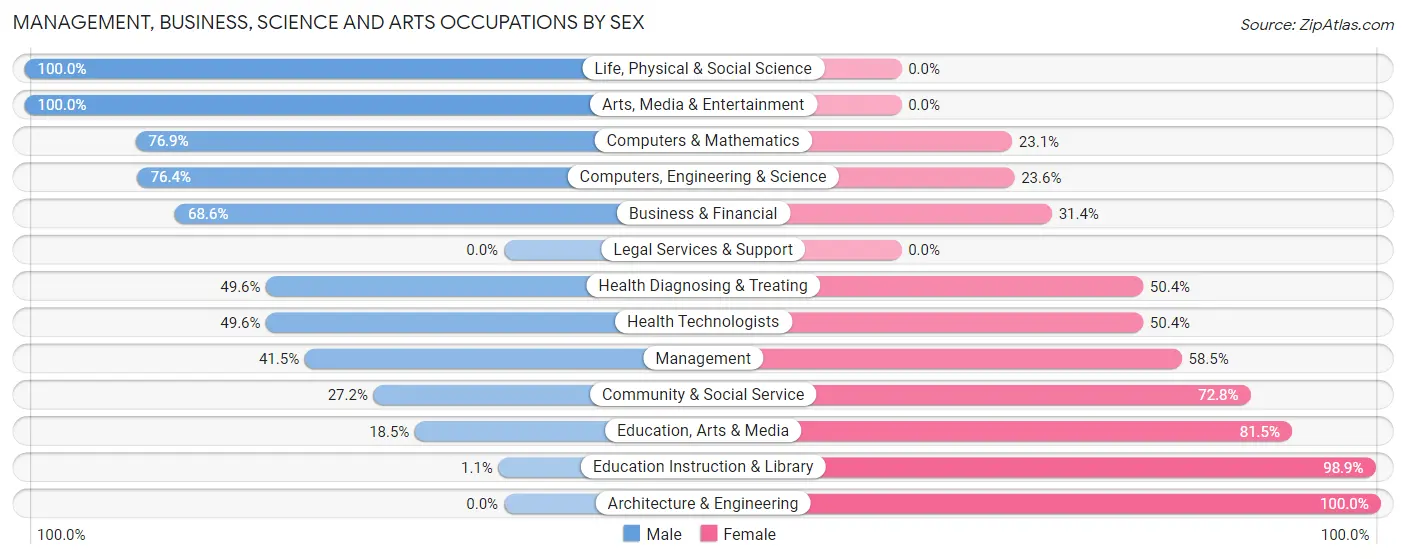
Management, Business, Science and Arts Occupations by Sex
Within the Management, Business, Science and Arts occupations in Franklin Center, the most male-oriented occupations are Life, Physical & Social Science (100.0%), Arts, Media & Entertainment (100.0%), and Computers & Mathematics (76.9%), while the most female-oriented occupations are Architecture & Engineering (100.0%), Education Instruction & Library (98.9%), and Education, Arts & Media (81.5%).
| Occupation | Male | Female |
| Management | 291 (41.5%) | 410 (58.5%) |
| Business & Financial | 166 (68.6%) | 76 (31.4%) |
| Computers, Engineering & Science | 298 (76.4%) | 92 (23.6%) |
| Computers & Mathematics | 233 (76.9%) | 70 (23.1%) |
| Architecture & Engineering | 0 (0.0%) | 22 (100.0%) |
| Life, Physical & Social Science | 65 (100.0%) | 0 (0.0%) |
| Community & Social Service | 50 (27.2%) | 134 (72.8%) |
| Education, Arts & Media | 10 (18.5%) | 44 (81.5%) |
| Legal Services & Support | 0 (0.0%) | 0 (0.0%) |
| Education Instruction & Library | 1 (1.1%) | 90 (98.9%) |
| Arts, Media & Entertainment | 39 (100.0%) | 0 (0.0%) |
| Health Diagnosing & Treating | 58 (49.6%) | 59 (50.4%) |
| Health Technologists | 58 (49.6%) | 59 (50.4%) |
| Total (Category) | 863 (52.8%) | 771 (47.2%) |
| Total (Overall) | 1,561 (60.5%) | 1,019 (39.5%) |
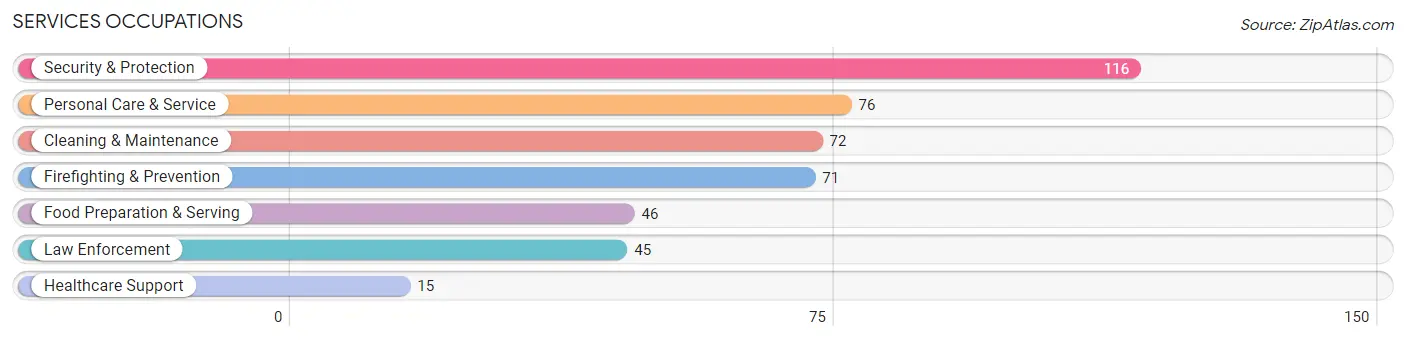
Services Occupations
The most common Services occupations in Franklin Center are Security & Protection (116 | 4.5%), Personal Care & Service (76 | 2.9%), Cleaning & Maintenance (72 | 2.8%), Firefighting & Prevention (71 | 2.8%), and Food Preparation & Serving (46 | 1.8%).
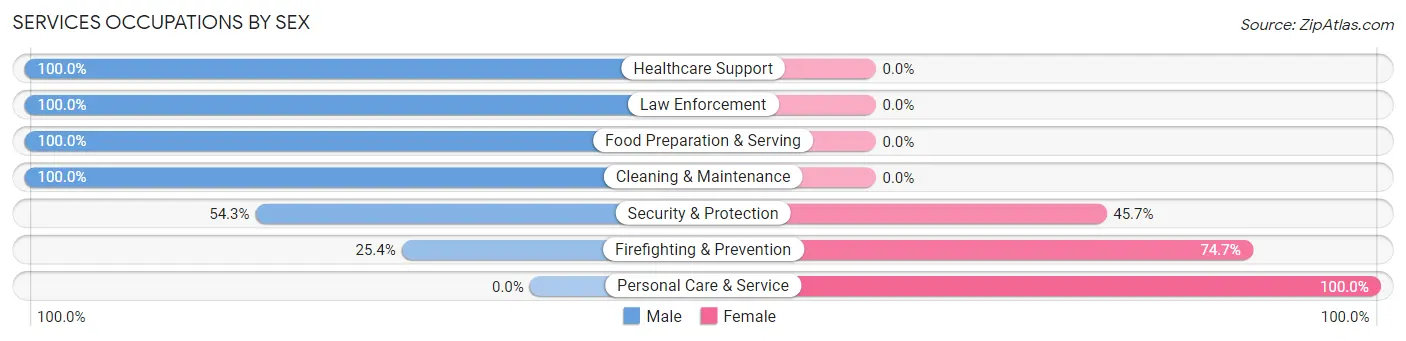
Services Occupations by Sex
Within the Services occupations in Franklin Center, the most male-oriented occupations are Healthcare Support (100.0%), Law Enforcement (100.0%), and Food Preparation & Serving (100.0%), while the most female-oriented occupations are Personal Care & Service (100.0%), Firefighting & Prevention (74.7%), and Security & Protection (45.7%).
| Occupation | Male | Female |
| Healthcare Support | 15 (100.0%) | 0 (0.0%) |
| Security & Protection | 63 (54.3%) | 53 (45.7%) |
| Firefighting & Prevention | 18 (25.4%) | 53 (74.7%) |
| Law Enforcement | 45 (100.0%) | 0 (0.0%) |
| Food Preparation & Serving | 46 (100.0%) | 0 (0.0%) |
| Cleaning & Maintenance | 72 (100.0%) | 0 (0.0%) |
| Personal Care & Service | 0 (0.0%) | 76 (100.0%) |
| Total (Category) | 196 (60.3%) | 129 (39.7%) |
| Total (Overall) | 1,561 (60.5%) | 1,019 (39.5%) |
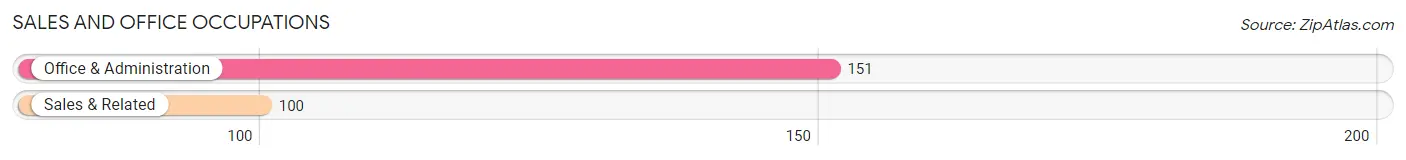
Sales and Office Occupations
The most common Sales and Office occupations in Franklin Center are Office & Administration (151 | 5.9%), and Sales & Related (100 | 3.9%).
Sales and Office Occupations by Sex
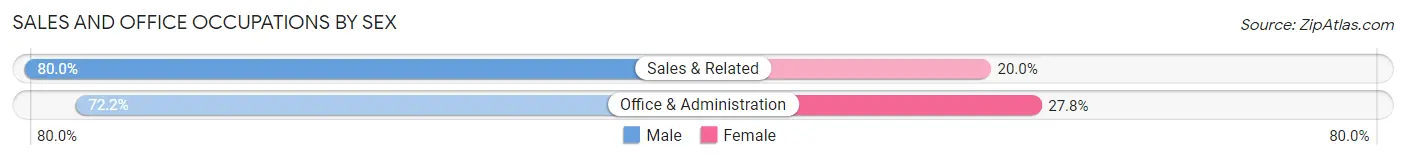
| Occupation | Male | Female |
| Sales & Related | 80 (80.0%) | 20 (20.0%) |
| Office & Administration | 109 (72.2%) | 42 (27.8%) |
| Total (Category) | 189 (75.3%) | 62 (24.7%) |
| Total (Overall) | 1,561 (60.5%) | 1,019 (39.5%) |
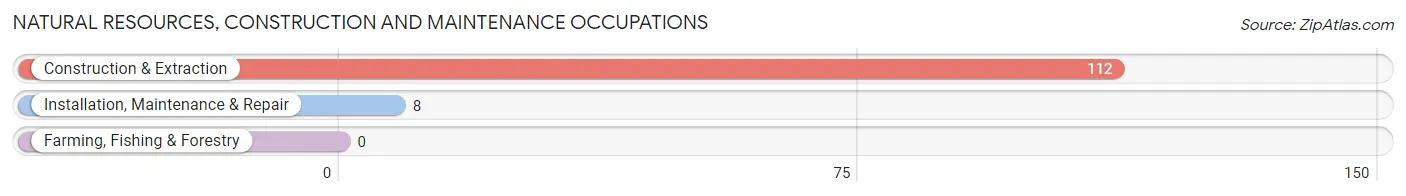
Natural Resources, Construction and Maintenance Occupations
The most common Natural Resources, Construction and Maintenance occupations in Franklin Center are Construction & Extraction (112 | 4.3%), and Installation, Maintenance & Repair (8 | 0.3%).
Natural Resources, Construction and Maintenance Occupations by Sex
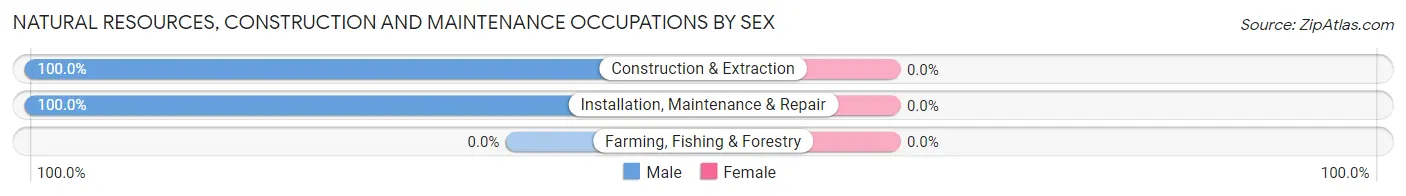
| Occupation | Male | Female |
| Farming, Fishing & Forestry | 0 (0.0%) | 0 (0.0%) |
| Construction & Extraction | 112 (100.0%) | 0 (0.0%) |
| Installation, Maintenance & Repair | 8 (100.0%) | 0 (0.0%) |
| Total (Category) | 120 (100.0%) | 0 (0.0%) |
| Total (Overall) | 1,561 (60.5%) | 1,019 (39.5%) |
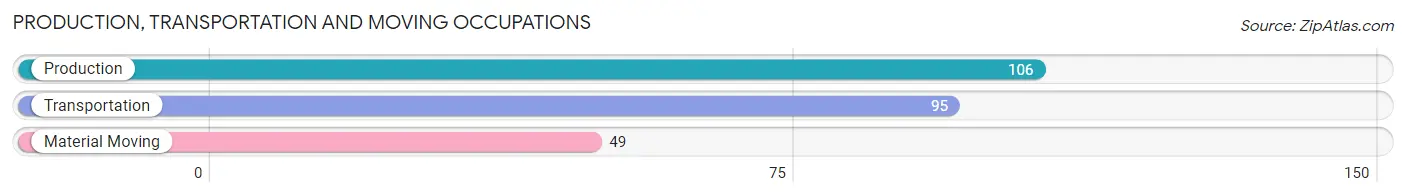
Production, Transportation and Moving Occupations
The most common Production, Transportation and Moving occupations in Franklin Center are Production (106 | 4.1%), Transportation (95 | 3.7%), and Material Moving (49 | 1.9%).
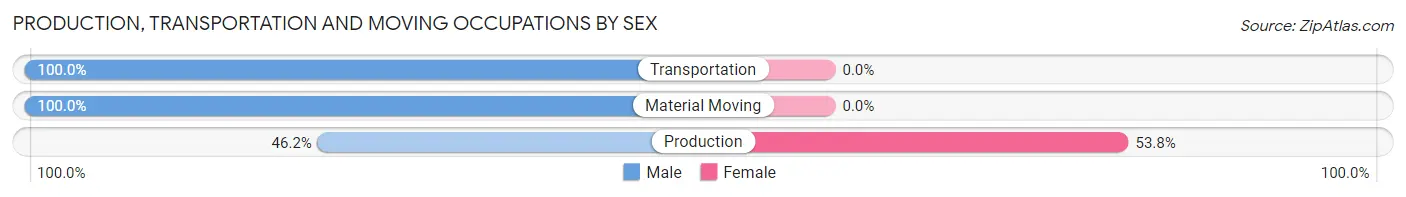
Production, Transportation and Moving Occupations by Sex
| Occupation | Male | Female |
| Production | 49 (46.2%) | 57 (53.8%) |
| Transportation | 95 (100.0%) | 0 (0.0%) |
| Material Moving | 49 (100.0%) | 0 (0.0%) |
| Total (Category) | 193 (77.2%) | 57 (22.8%) |
| Total (Overall) | 1,561 (60.5%) | 1,019 (39.5%) |
Employment Industries by Sex in Franklin Center
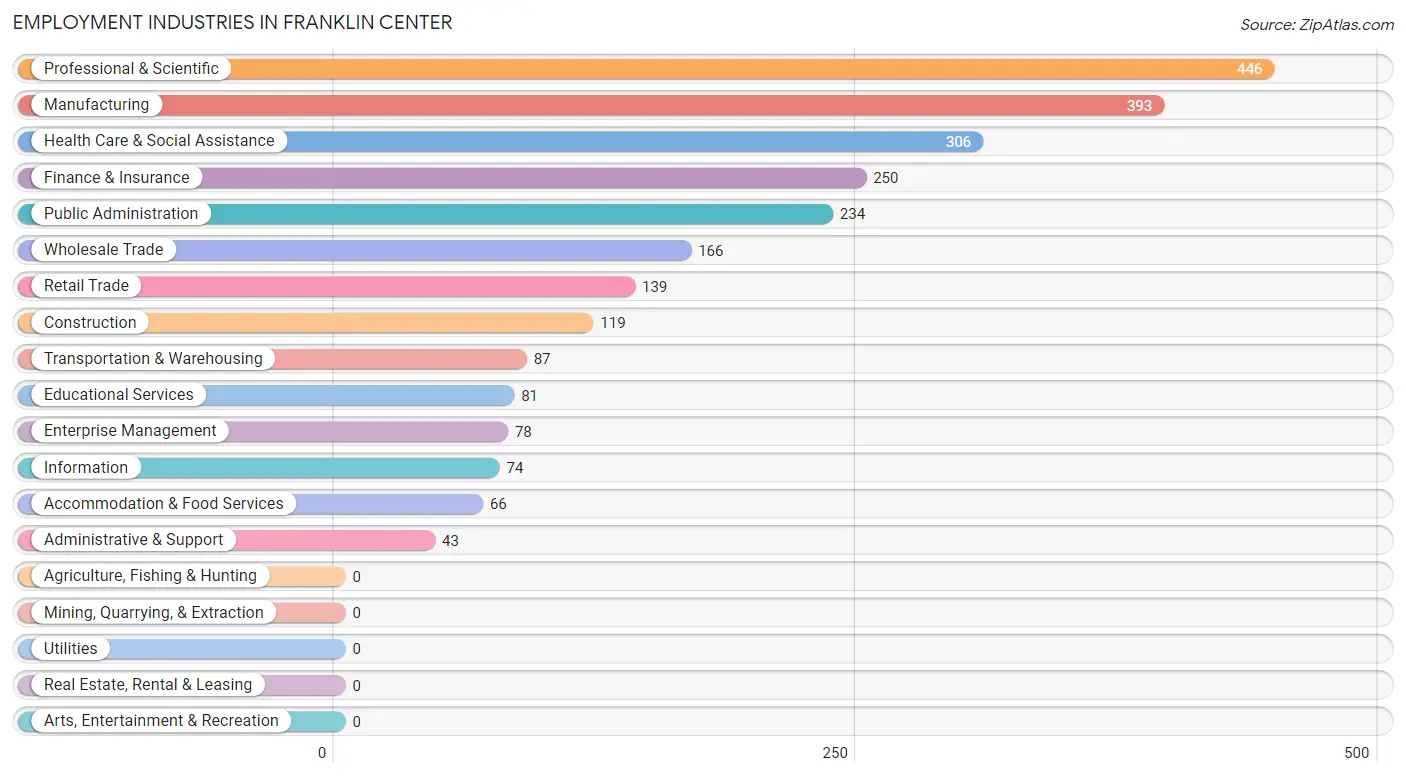
Employment Industries in Franklin Center
The major employment industries in Franklin Center include Professional & Scientific (446 | 17.3%), Manufacturing (393 | 15.2%), Health Care & Social Assistance (306 | 11.9%), Finance & Insurance (250 | 9.7%), and Public Administration (234 | 9.1%).
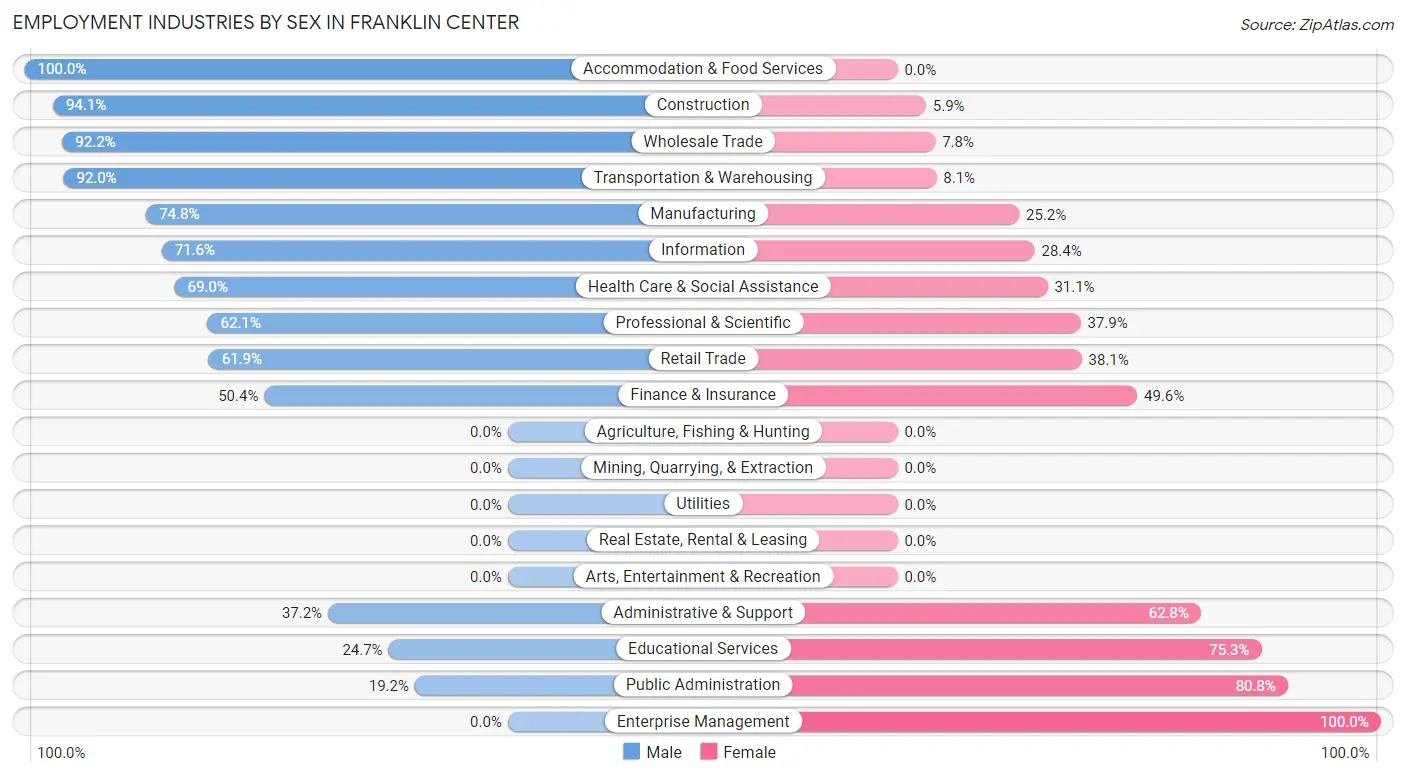
Employment Industries by Sex in Franklin Center
The Franklin Center industries that see more men than women are Accommodation & Food Services (100.0%), Construction (94.1%), and Wholesale Trade (92.2%), whereas the industries that tend to have a higher number of women are Enterprise Management (100.0%), Public Administration (80.8%), and Educational Services (75.3%).
| Industry | Male | Female |
| Agriculture, Fishing & Hunting | 0 (0.0%) | 0 (0.0%) |
| Mining, Quarrying, & Extraction | 0 (0.0%) | 0 (0.0%) |
| Construction | 112 (94.1%) | 7 (5.9%) |
| Manufacturing | 294 (74.8%) | 99 (25.2%) |
| Wholesale Trade | 153 (92.2%) | 13 (7.8%) |
| Retail Trade | 86 (61.9%) | 53 (38.1%) |
| Transportation & Warehousing | 80 (91.9%) | 7 (8.1%) |
| Utilities | 0 (0.0%) | 0 (0.0%) |
| Information | 53 (71.6%) | 21 (28.4%) |
| Finance & Insurance | 126 (50.4%) | 124 (49.6%) |
| Real Estate, Rental & Leasing | 0 (0.0%) | 0 (0.0%) |
| Professional & Scientific | 277 (62.1%) | 169 (37.9%) |
| Enterprise Management | 0 (0.0%) | 78 (100.0%) |
| Administrative & Support | 16 (37.2%) | 27 (62.8%) |
| Educational Services | 20 (24.7%) | 61 (75.3%) |
| Health Care & Social Assistance | 211 (69.0%) | 95 (31.0%) |
| Arts, Entertainment & Recreation | 0 (0.0%) | 0 (0.0%) |
| Accommodation & Food Services | 66 (100.0%) | 0 (0.0%) |
| Public Administration | 45 (19.2%) | 189 (80.8%) |
| Total | 1,561 (60.5%) | 1,019 (39.5%) |
Education in Franklin Center
School Enrollment in Franklin Center
The most common levels of schooling among the 792 students in Franklin Center are elementary school (320 | 40.4%), middle school (128 | 16.2%), and high school (90 | 11.4%).
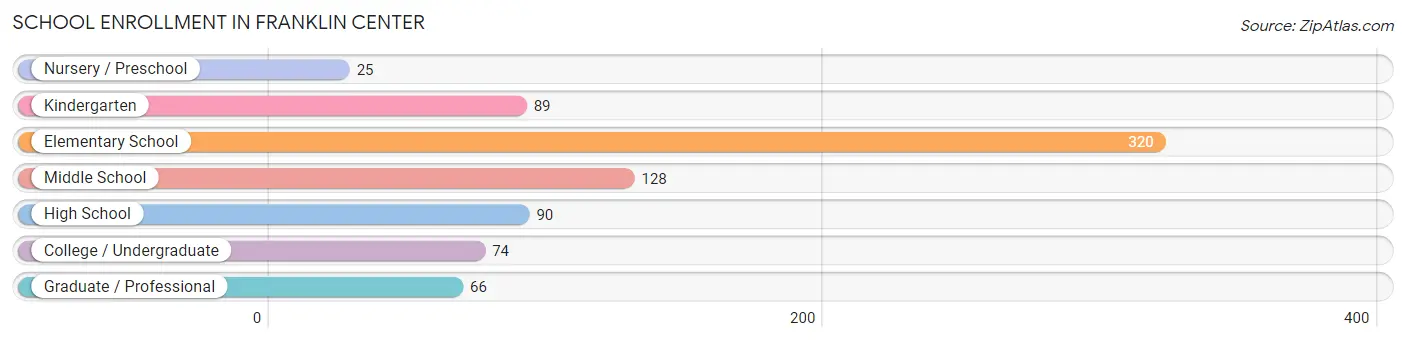
| School Level | # Students | % Students |
| Nursery / Preschool | 25 | 3.2% |
| Kindergarten | 89 | 11.2% |
| Elementary School | 320 | 40.4% |
| Middle School | 128 | 16.2% |
| High School | 90 | 11.4% |
| College / Undergraduate | 74 | 9.3% |
| Graduate / Professional | 66 | 8.3% |
| Total | 792 | 100.0% |
School Enrollment by Age by Funding Source in Franklin Center
Out of a total of 792 students who are enrolled in schools in Franklin Center, 172 (21.7%) attend a private institution, while the remaining 620 (78.3%) are enrolled in public schools. The age group of 18 to 19 year olds has the highest likelihood of being enrolled in private schools, with 2 (66.7% in the age bracket) enrolled. Conversely, the age group of 3 to 4 year olds has the lowest likelihood of being enrolled in a private school, with 25 (100.0% in the age bracket) attending a public institution.
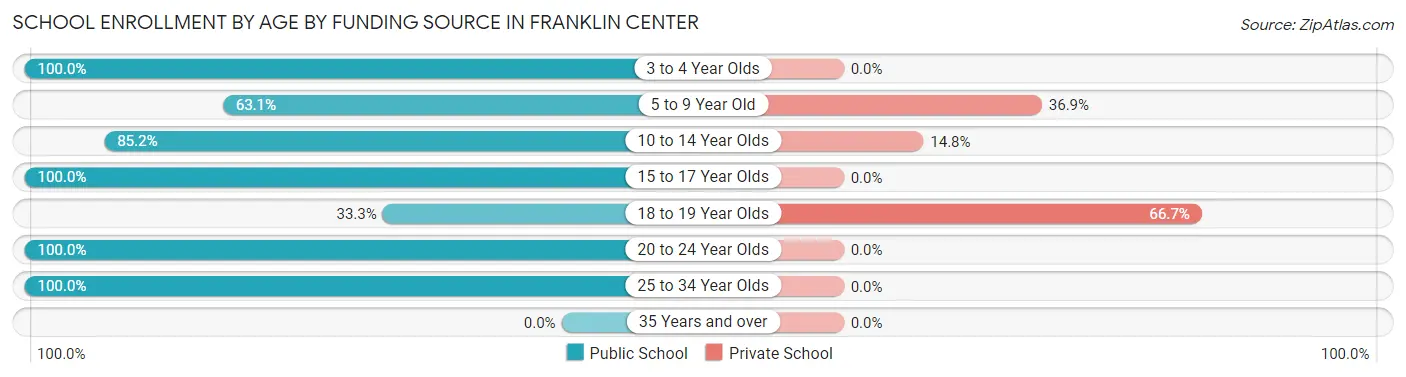
| Age Bracket | Public School | Private School |
| 3 to 4 Year Olds | 25 (100.0%) | 0 (0.0%) |
| 5 to 9 Year Old | 258 (63.1%) | 151 (36.9%) |
| 10 to 14 Year Olds | 109 (85.2%) | 19 (14.8%) |
| 15 to 17 Year Olds | 90 (100.0%) | 0 (0.0%) |
| 18 to 19 Year Olds | 1 (33.3%) | 2 (66.7%) |
| 20 to 24 Year Olds | 71 (100.0%) | 0 (0.0%) |
| 25 to 34 Year Olds | 66 (100.0%) | 0 (0.0%) |
| 35 Years and over | 0 (0.0%) | 0 (0.0%) |
| Total | 620 (78.3%) | 172 (21.7%) |
Educational Attainment by Field of Study in Franklin Center
Business (960 | 28.4%), science & technology (384 | 11.4%), social sciences (321 | 9.5%), computers & mathematics (314 | 9.3%), and education (298 | 8.8%) are the most common fields of study among 3,384 individuals in Franklin Center who have obtained a bachelor's degree or higher.
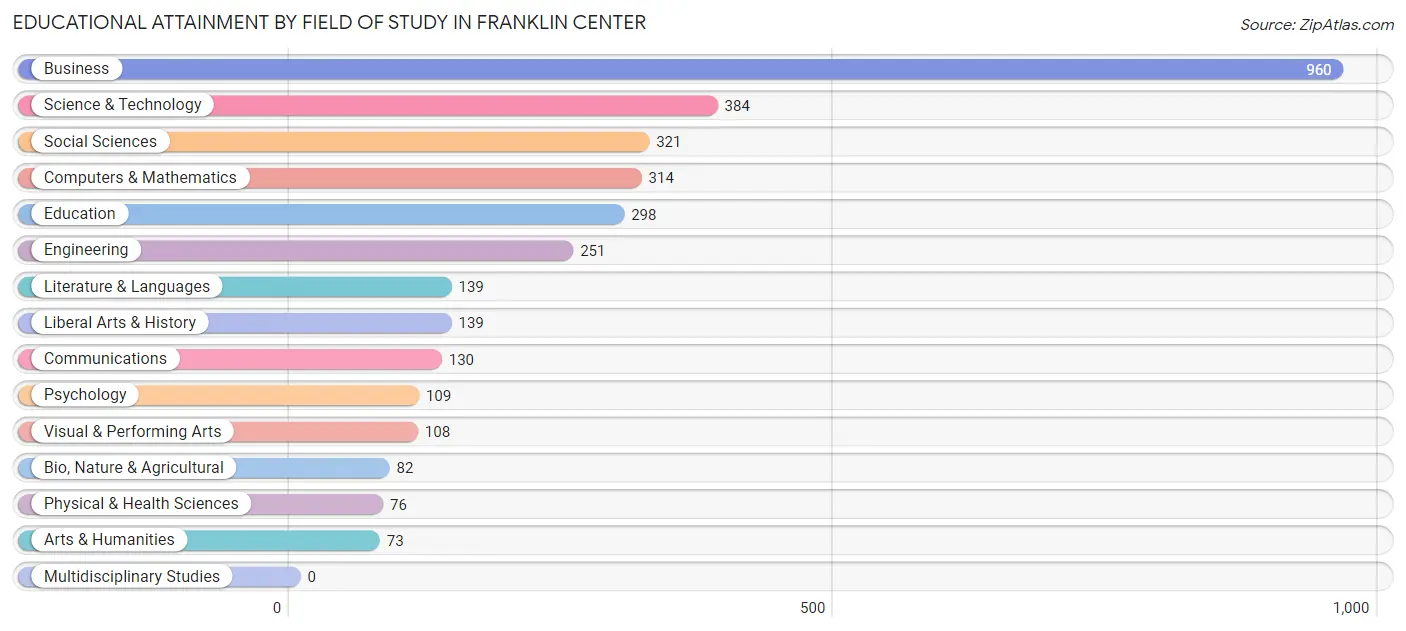
| Field of Study | # Graduates | % Graduates |
| Computers & Mathematics | 314 | 9.3% |
| Bio, Nature & Agricultural | 82 | 2.4% |
| Physical & Health Sciences | 76 | 2.2% |
| Psychology | 109 | 3.2% |
| Social Sciences | 321 | 9.5% |
| Engineering | 251 | 7.4% |
| Multidisciplinary Studies | 0 | 0.0% |
| Science & Technology | 384 | 11.4% |
| Business | 960 | 28.4% |
| Education | 298 | 8.8% |
| Literature & Languages | 139 | 4.1% |
| Liberal Arts & History | 139 | 4.1% |
| Visual & Performing Arts | 108 | 3.2% |
| Communications | 130 | 3.8% |
| Arts & Humanities | 73 | 2.2% |
| Total | 3,384 | 100.0% |
Transportation & Commute in Franklin Center
Vehicle Availability by Sex in Franklin Center
The most prevalent vehicle ownership categories in Franklin Center are males with 2 vehicles (883, accounting for 57.3%) and females with 2 vehicles (616, making up 86.7%).
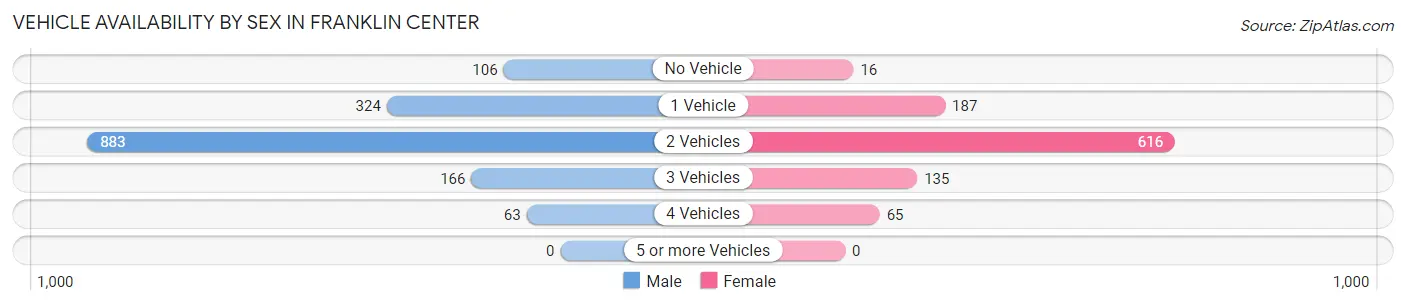
| Vehicles Available | Male | Female |
| No Vehicle | 106 (6.9%) | 16 (1.6%) |
| 1 Vehicle | 324 (21.0%) | 187 (18.3%) |
| 2 Vehicles | 883 (57.3%) | 616 (60.5%) |
| 3 Vehicles | 166 (10.8%) | 135 (13.3%) |
| 4 Vehicles | 63 (4.1%) | 65 (6.4%) |
| 5 or more Vehicles | 0 (0.0%) | 0 (0.0%) |
| Total | 1,542 (100.0%) | 1,019 (100.0%) |
Commute Time in Franklin Center
The most frequently occuring commute durations in Franklin Center are 45 to 59 minutes (372 commuters, 20.6%), 5 to 9 minutes (241 commuters, 13.3%), and 15 to 19 minutes (198 commuters, 11.0%).
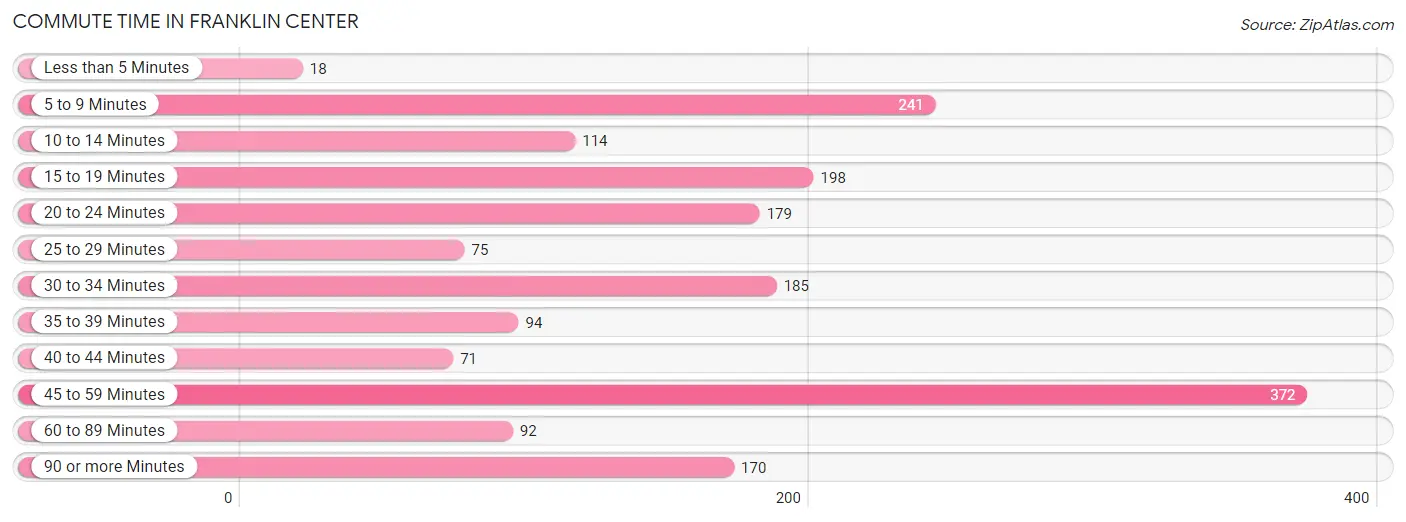
| Commute Time | # Commuters | % Commuters |
| Less than 5 Minutes | 18 | 1.0% |
| 5 to 9 Minutes | 241 | 13.3% |
| 10 to 14 Minutes | 114 | 6.3% |
| 15 to 19 Minutes | 198 | 11.0% |
| 20 to 24 Minutes | 179 | 9.9% |
| 25 to 29 Minutes | 75 | 4.2% |
| 30 to 34 Minutes | 185 | 10.2% |
| 35 to 39 Minutes | 94 | 5.2% |
| 40 to 44 Minutes | 71 | 3.9% |
| 45 to 59 Minutes | 372 | 20.6% |
| 60 to 89 Minutes | 92 | 5.1% |
| 90 or more Minutes | 170 | 9.4% |
Commute Time by Sex in Franklin Center
The most common commute times in Franklin Center are 45 to 59 minutes (268 commuters, 23.3%) for males and 15 to 19 minutes (113 commuters, 17.2%) for females.
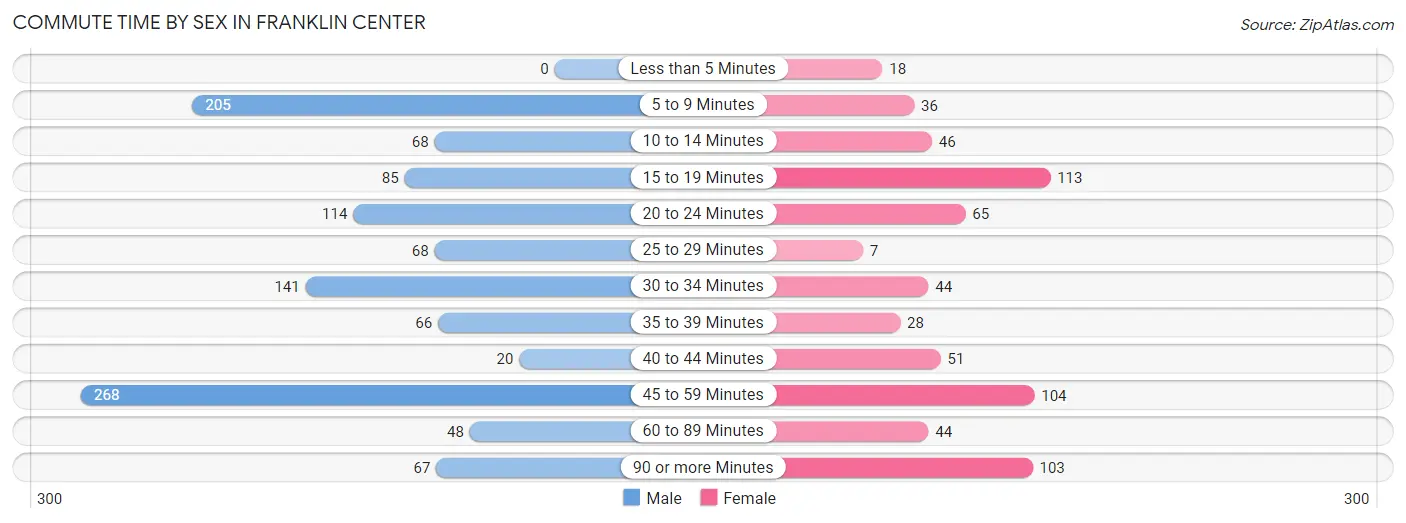
| Commute Time | Male | Female |
| Less than 5 Minutes | 0 (0.0%) | 18 (2.7%) |
| 5 to 9 Minutes | 205 (17.8%) | 36 (5.5%) |
| 10 to 14 Minutes | 68 (5.9%) | 46 (7.0%) |
| 15 to 19 Minutes | 85 (7.4%) | 113 (17.2%) |
| 20 to 24 Minutes | 114 (9.9%) | 65 (9.9%) |
| 25 to 29 Minutes | 68 (5.9%) | 7 (1.1%) |
| 30 to 34 Minutes | 141 (12.3%) | 44 (6.7%) |
| 35 to 39 Minutes | 66 (5.7%) | 28 (4.3%) |
| 40 to 44 Minutes | 20 (1.7%) | 51 (7.7%) |
| 45 to 59 Minutes | 268 (23.3%) | 104 (15.8%) |
| 60 to 89 Minutes | 48 (4.2%) | 44 (6.7%) |
| 90 or more Minutes | 67 (5.8%) | 103 (15.6%) |
Time of Departure to Work by Sex in Franklin Center
The most frequent times of departure to work in Franklin Center are 7:30 AM to 7:59 AM (214, 18.6%) for males and 7:00 AM to 7:29 AM (216, 32.8%) for females.
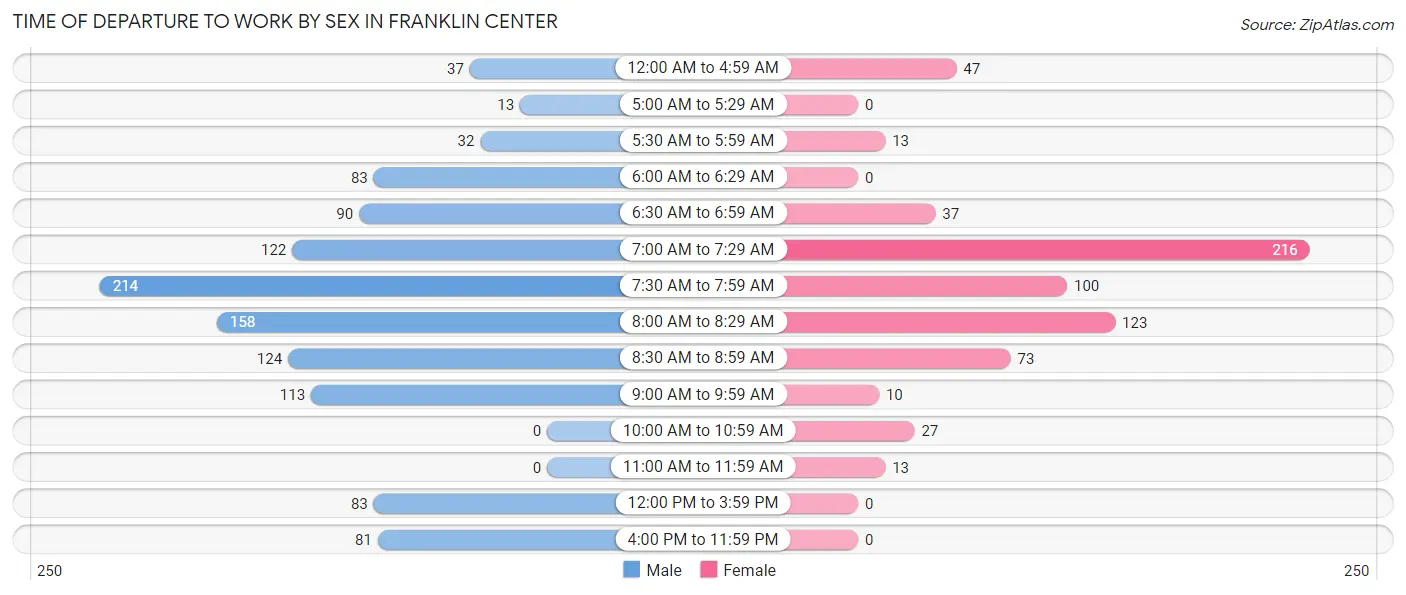
| Time of Departure | Male | Female |
| 12:00 AM to 4:59 AM | 37 (3.2%) | 47 (7.1%) |
| 5:00 AM to 5:29 AM | 13 (1.1%) | 0 (0.0%) |
| 5:30 AM to 5:59 AM | 32 (2.8%) | 13 (2.0%) |
| 6:00 AM to 6:29 AM | 83 (7.2%) | 0 (0.0%) |
| 6:30 AM to 6:59 AM | 90 (7.8%) | 37 (5.6%) |
| 7:00 AM to 7:29 AM | 122 (10.6%) | 216 (32.8%) |
| 7:30 AM to 7:59 AM | 214 (18.6%) | 100 (15.2%) |
| 8:00 AM to 8:29 AM | 158 (13.7%) | 123 (18.7%) |
| 8:30 AM to 8:59 AM | 124 (10.8%) | 73 (11.1%) |
| 9:00 AM to 9:59 AM | 113 (9.8%) | 10 (1.5%) |
| 10:00 AM to 10:59 AM | 0 (0.0%) | 27 (4.1%) |
| 11:00 AM to 11:59 AM | 0 (0.0%) | 13 (2.0%) |
| 12:00 PM to 3:59 PM | 83 (7.2%) | 0 (0.0%) |
| 4:00 PM to 11:59 PM | 81 (7.0%) | 0 (0.0%) |
| Total | 1,150 (100.0%) | 659 (100.0%) |
Housing Occupancy in Franklin Center
Occupancy by Ownership in Franklin Center
Of the total 2,456 dwellings in Franklin Center, owner-occupied units account for 1,724 (70.2%), while renter-occupied units make up 732 (29.8%).
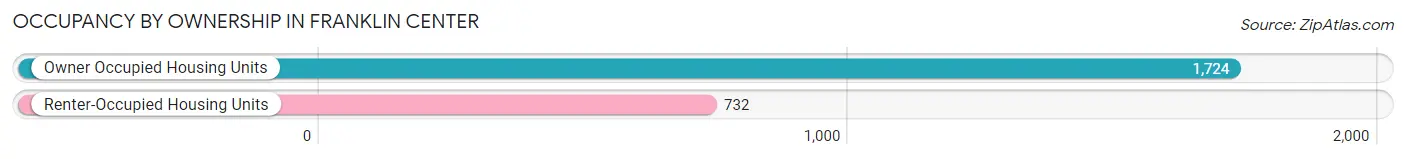
| Occupancy | # Housing Units | % Housing Units |
| Owner Occupied Housing Units | 1,724 | 70.2% |
| Renter-Occupied Housing Units | 732 | 29.8% |
| Total Occupied Housing Units | 2,456 | 100.0% |
Occupancy by Household Size in Franklin Center
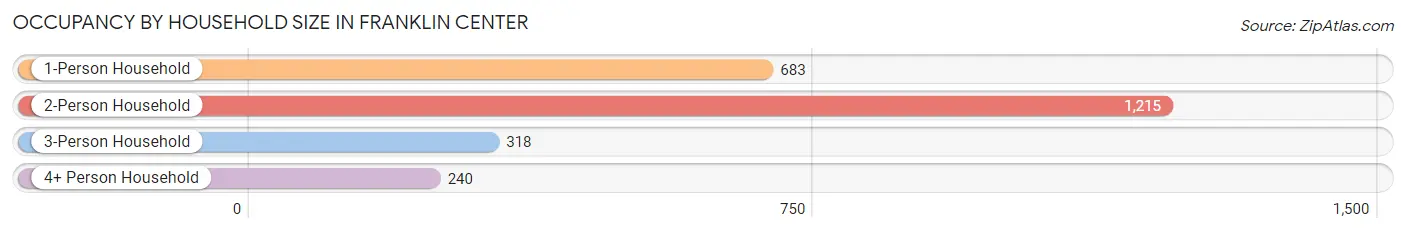
| Household Size | # Housing Units | % Housing Units |
| 1-Person Household | 683 | 27.8% |
| 2-Person Household | 1,215 | 49.5% |
| 3-Person Household | 318 | 13.0% |
| 4+ Person Household | 240 | 9.8% |
| Total Housing Units | 2,456 | 100.0% |
Occupancy by Ownership by Household Size in Franklin Center
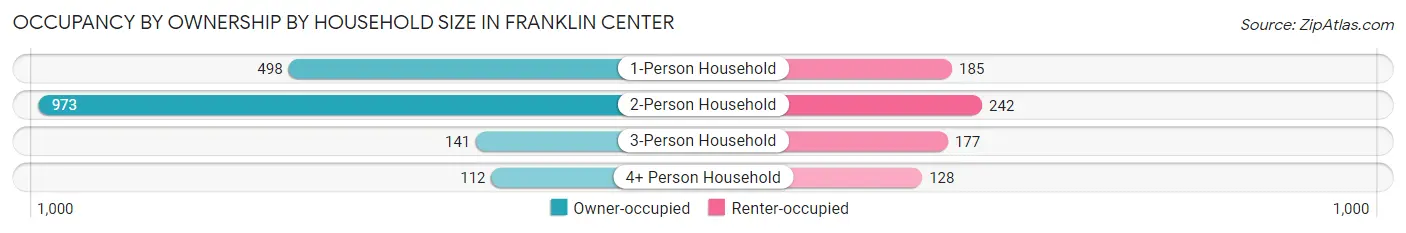
| Household Size | Owner-occupied | Renter-occupied |
| 1-Person Household | 498 (72.9%) | 185 (27.1%) |
| 2-Person Household | 973 (80.1%) | 242 (19.9%) |
| 3-Person Household | 141 (44.3%) | 177 (55.7%) |
| 4+ Person Household | 112 (46.7%) | 128 (53.3%) |
| Total Housing Units | 1,724 (70.2%) | 732 (29.8%) |
Occupancy by Educational Attainment in Franklin Center
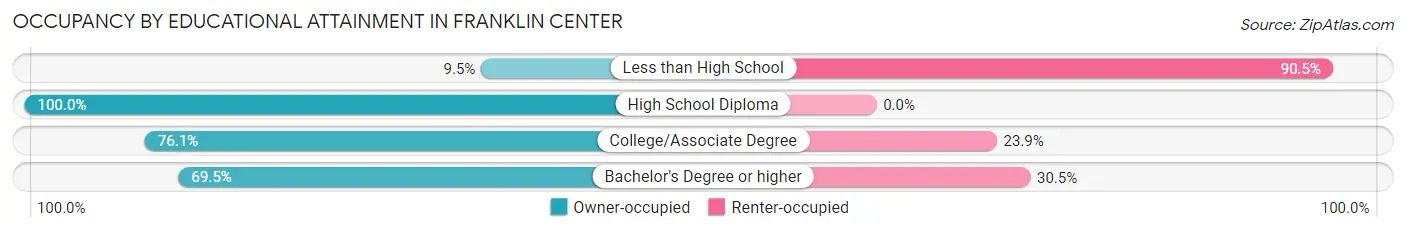
| Household Size | Owner-occupied | Renter-occupied |
| Less than High School | 9 (9.5%) | 86 (90.5%) |
| High School Diploma | 162 (100.0%) | 0 (0.0%) |
| College/Associate Degree | 284 (76.1%) | 89 (23.9%) |
| Bachelor's Degree or higher | 1,269 (69.5%) | 557 (30.5%) |
Occupancy by Age of Householder in Franklin Center
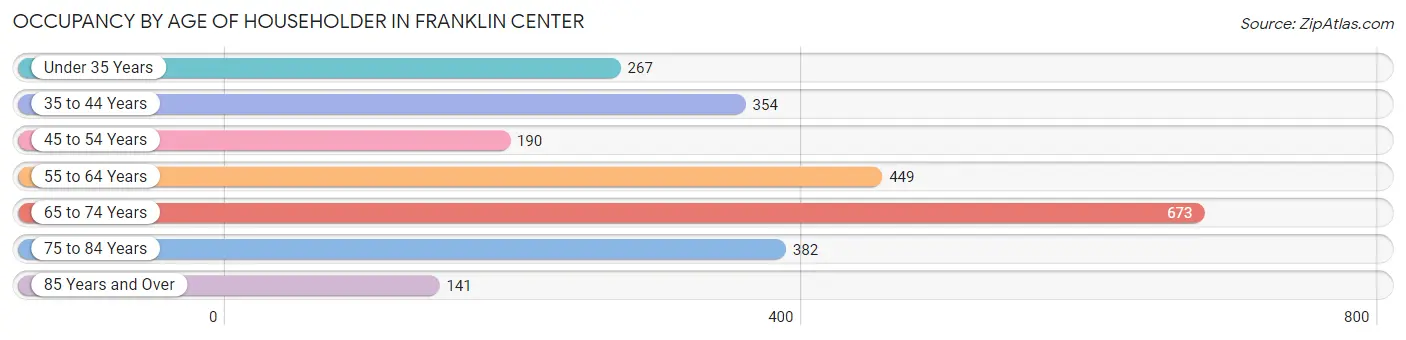
| Age Bracket | # Households | % Households |
| Under 35 Years | 267 | 10.9% |
| 35 to 44 Years | 354 | 14.4% |
| 45 to 54 Years | 190 | 7.7% |
| 55 to 64 Years | 449 | 18.3% |
| 65 to 74 Years | 673 | 27.4% |
| 75 to 84 Years | 382 | 15.5% |
| 85 Years and Over | 141 | 5.7% |
| Total | 2,456 | 100.0% |
Housing Finances in Franklin Center
Median Income by Occupancy in Franklin Center
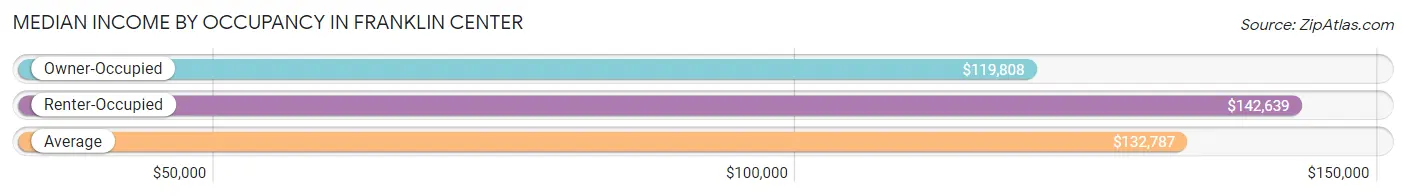
| Occupancy Type | # Households | Median Income |
| Owner-Occupied | 1,724 (70.2%) | $119,808 |
| Renter-Occupied | 732 (29.8%) | $142,639 |
| Average | 2,456 (100.0%) | $132,787 |
Occupancy by Householder Income Bracket in Franklin Center
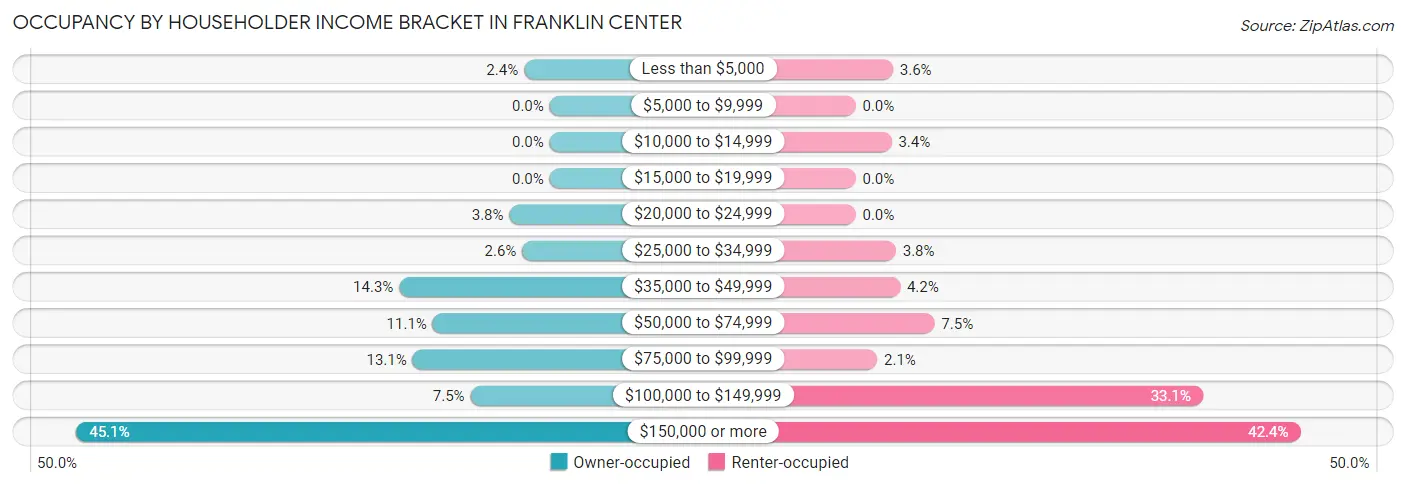
| Income Bracket | Owner-occupied | Renter-occupied |
| Less than $5,000 | 42 (2.4%) | 26 (3.5%) |
| $5,000 to $9,999 | 0 (0.0%) | 0 (0.0%) |
| $10,000 to $14,999 | 0 (0.0%) | 25 (3.4%) |
| $15,000 to $19,999 | 0 (0.0%) | 0 (0.0%) |
| $20,000 to $24,999 | 66 (3.8%) | 0 (0.0%) |
| $25,000 to $34,999 | 45 (2.6%) | 28 (3.8%) |
| $35,000 to $49,999 | 247 (14.3%) | 31 (4.2%) |
| $50,000 to $74,999 | 192 (11.1%) | 55 (7.5%) |
| $75,000 to $99,999 | 225 (13.1%) | 15 (2.1%) |
| $100,000 to $149,999 | 130 (7.5%) | 242 (33.1%) |
| $150,000 or more | 777 (45.1%) | 310 (42.3%) |
| Total | 1,724 (100.0%) | 732 (100.0%) |
Monthly Housing Cost Tiers in Franklin Center
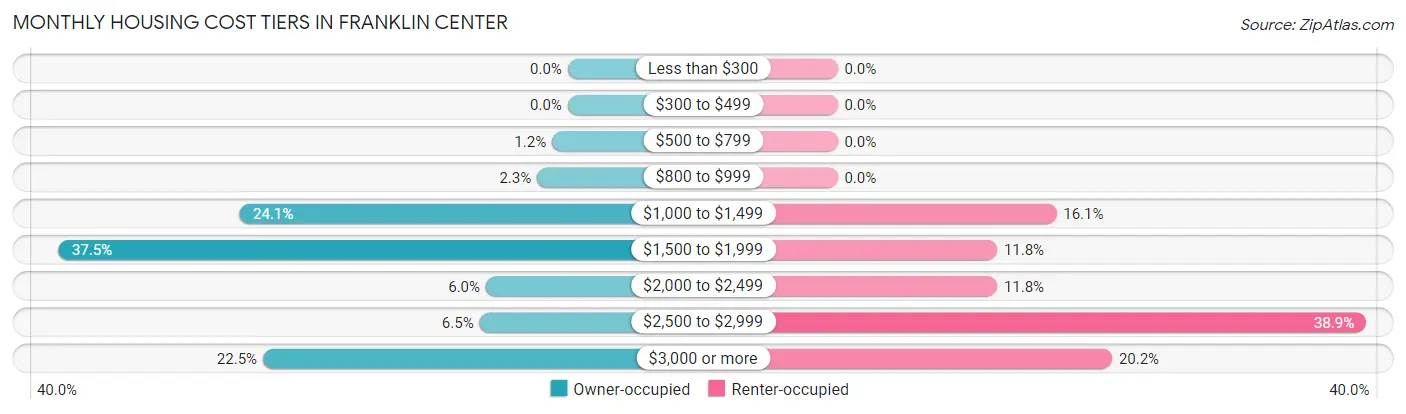
| Monthly Cost | Owner-occupied | Renter-occupied |
| Less than $300 | 0 (0.0%) | 0 (0.0%) |
| $300 to $499 | 0 (0.0%) | 0 (0.0%) |
| $500 to $799 | 20 (1.2%) | 0 (0.0%) |
| $800 to $999 | 39 (2.3%) | 0 (0.0%) |
| $1,000 to $1,499 | 416 (24.1%) | 118 (16.1%) |
| $1,500 to $1,999 | 646 (37.5%) | 86 (11.7%) |
| $2,000 to $2,499 | 104 (6.0%) | 86 (11.7%) |
| $2,500 to $2,999 | 112 (6.5%) | 285 (38.9%) |
| $3,000 or more | 387 (22.5%) | 148 (20.2%) |
| Total | 1,724 (100.0%) | 732 (100.0%) |
Physical Housing Characteristics in Franklin Center
Housing Structures in Franklin Center
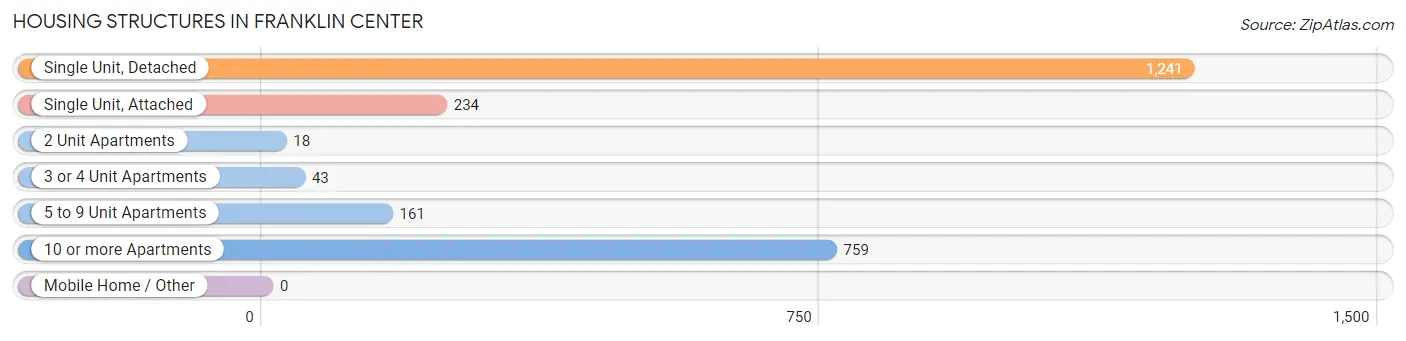
| Structure Type | # Housing Units | % Housing Units |
| Single Unit, Detached | 1,241 | 50.5% |
| Single Unit, Attached | 234 | 9.5% |
| 2 Unit Apartments | 18 | 0.7% |
| 3 or 4 Unit Apartments | 43 | 1.8% |
| 5 to 9 Unit Apartments | 161 | 6.6% |
| 10 or more Apartments | 759 | 30.9% |
| Mobile Home / Other | 0 | 0.0% |
| Total | 2,456 | 100.0% |
Housing Structures by Occupancy in Franklin Center
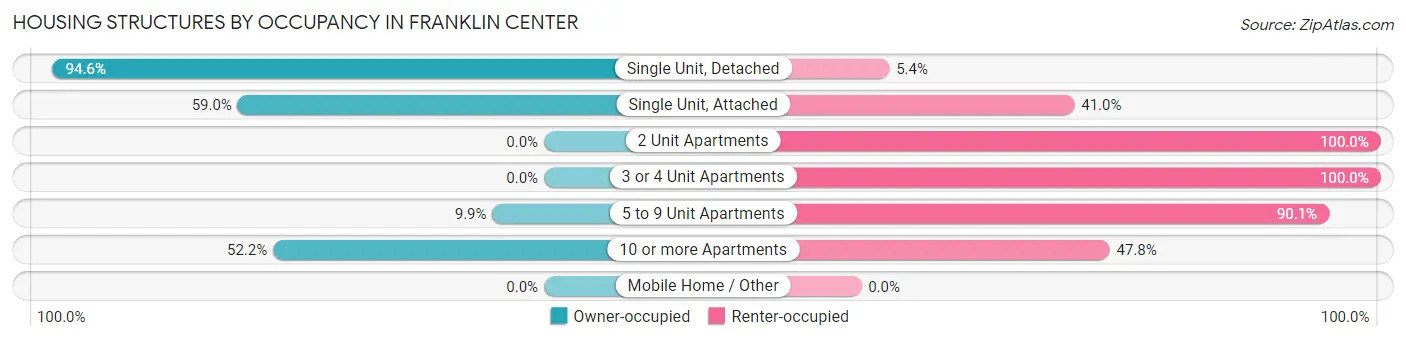
| Structure Type | Owner-occupied | Renter-occupied |
| Single Unit, Detached | 1,174 (94.6%) | 67 (5.4%) |
| Single Unit, Attached | 138 (59.0%) | 96 (41.0%) |
| 2 Unit Apartments | 0 (0.0%) | 18 (100.0%) |
| 3 or 4 Unit Apartments | 0 (0.0%) | 43 (100.0%) |
| 5 to 9 Unit Apartments | 16 (9.9%) | 145 (90.1%) |
| 10 or more Apartments | 396 (52.2%) | 363 (47.8%) |
| Mobile Home / Other | 0 (0.0%) | 0 (0.0%) |
| Total | 1,724 (70.2%) | 732 (29.8%) |
Housing Structures by Number of Rooms in Franklin Center
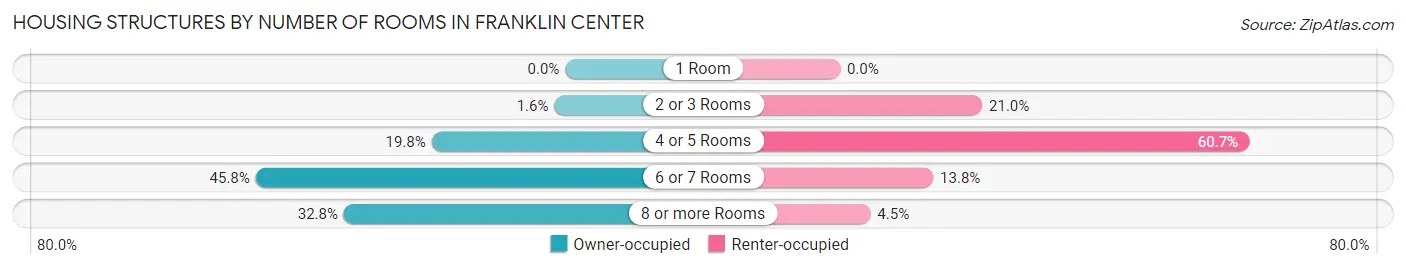
| Number of Rooms | Owner-occupied | Renter-occupied |
| 1 Room | 0 (0.0%) | 0 (0.0%) |
| 2 or 3 Rooms | 28 (1.6%) | 154 (21.0%) |
| 4 or 5 Rooms | 341 (19.8%) | 444 (60.7%) |
| 6 or 7 Rooms | 790 (45.8%) | 101 (13.8%) |
| 8 or more Rooms | 565 (32.8%) | 33 (4.5%) |
| Total | 1,724 (100.0%) | 732 (100.0%) |
Housing Structure by Heating Type in Franklin Center
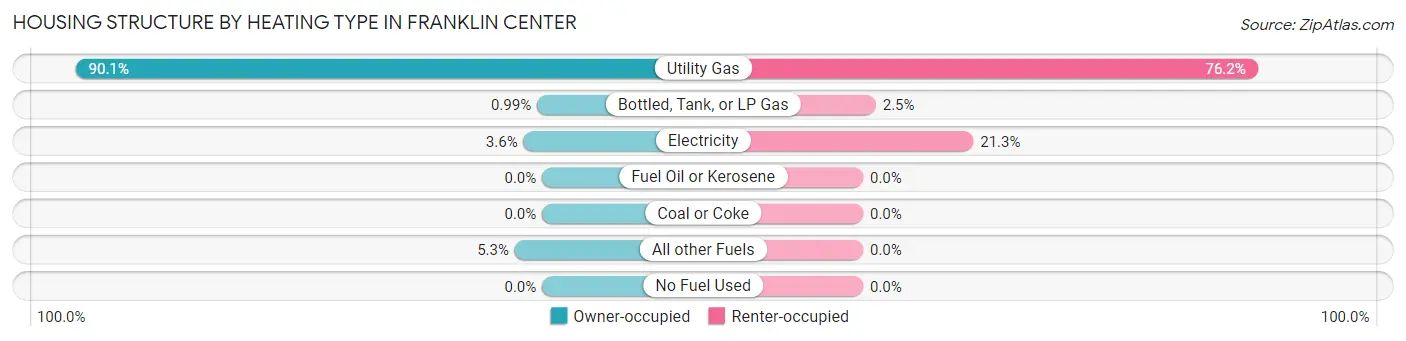
| Heating Type | Owner-occupied | Renter-occupied |
| Utility Gas | 1,554 (90.1%) | 558 (76.2%) |
| Bottled, Tank, or LP Gas | 17 (1.0%) | 18 (2.5%) |
| Electricity | 62 (3.6%) | 156 (21.3%) |
| Fuel Oil or Kerosene | 0 (0.0%) | 0 (0.0%) |
| Coal or Coke | 0 (0.0%) | 0 (0.0%) |
| All other Fuels | 91 (5.3%) | 0 (0.0%) |
| No Fuel Used | 0 (0.0%) | 0 (0.0%) |
| Total | 1,724 (100.0%) | 732 (100.0%) |
Household Vehicle Usage in Franklin Center
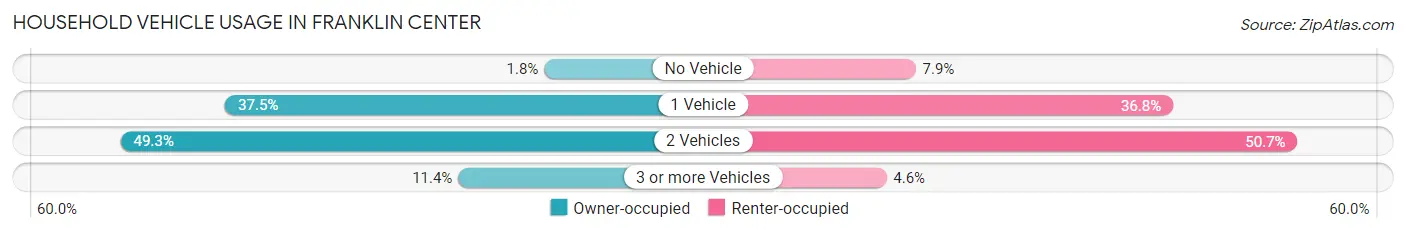
| Vehicles per Household | Owner-occupied | Renter-occupied |
| No Vehicle | 31 (1.8%) | 58 (7.9%) |
| 1 Vehicle | 647 (37.5%) | 269 (36.7%) |
| 2 Vehicles | 849 (49.2%) | 371 (50.7%) |
| 3 or more Vehicles | 197 (11.4%) | 34 (4.6%) |
| Total | 1,724 (100.0%) | 732 (100.0%) |
Real Estate & Mortgages in Franklin Center
Real Estate and Mortgage Overview in Franklin Center
| Characteristic | Without Mortgage | With Mortgage |
| Housing Units | 1,029 | 695 |
| Median Property Value | $497,500 | $592,300 |
| Median Household Income | $85,938 | $445 |
| Monthly Housing Costs | $1,501 | $387 |
| Real Estate Taxes | $10,001 | $0 |
Property Value by Mortgage Status in Franklin Center
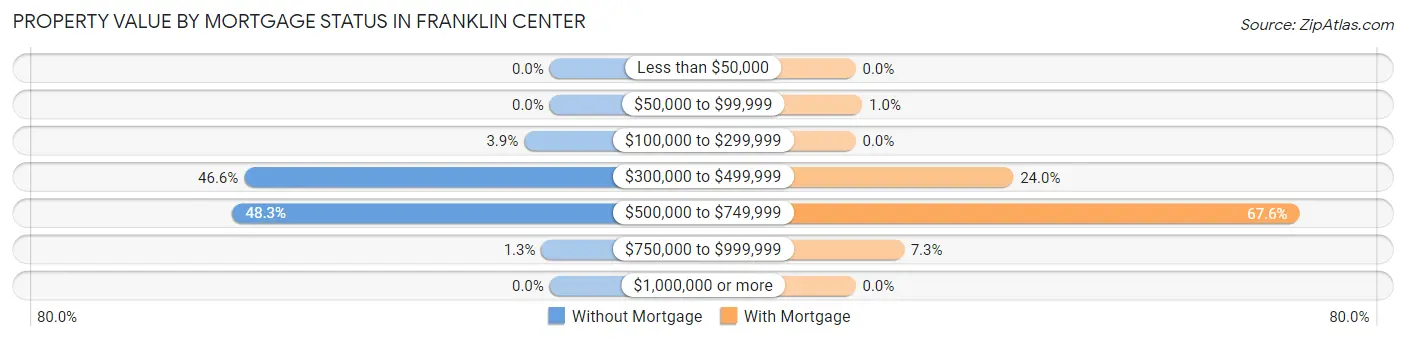
| Property Value | Without Mortgage | With Mortgage |
| Less than $50,000 | 0 (0.0%) | 0 (0.0%) |
| $50,000 to $99,999 | 0 (0.0%) | 7 (1.0%) |
| $100,000 to $299,999 | 40 (3.9%) | 0 (0.0%) |
| $300,000 to $499,999 | 479 (46.6%) | 167 (24.0%) |
| $500,000 to $749,999 | 497 (48.3%) | 470 (67.6%) |
| $750,000 to $999,999 | 13 (1.3%) | 51 (7.3%) |
| $1,000,000 or more | 0 (0.0%) | 0 (0.0%) |
| Total | 1,029 (100.0%) | 695 (100.0%) |
Household Income by Mortgage Status in Franklin Center
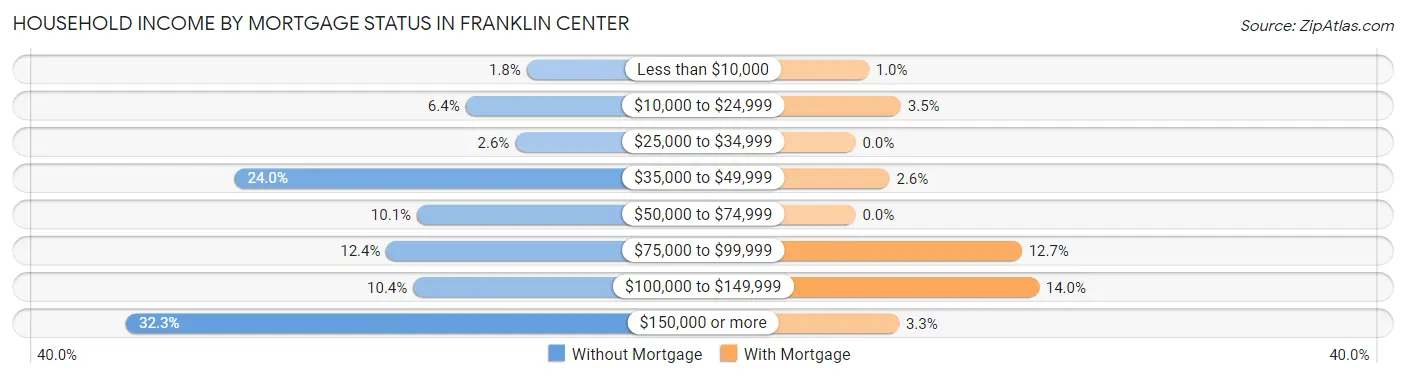
| Household Income | Without Mortgage | With Mortgage |
| Less than $10,000 | 18 (1.8%) | 7 (1.0%) |
| $10,000 to $24,999 | 66 (6.4%) | 24 (3.5%) |
| $25,000 to $34,999 | 27 (2.6%) | 0 (0.0%) |
| $35,000 to $49,999 | 247 (24.0%) | 18 (2.6%) |
| $50,000 to $74,999 | 104 (10.1%) | 0 (0.0%) |
| $75,000 to $99,999 | 128 (12.4%) | 88 (12.7%) |
| $100,000 to $149,999 | 107 (10.4%) | 97 (14.0%) |
| $150,000 or more | 332 (32.3%) | 23 (3.3%) |
| Total | 1,029 (100.0%) | 695 (100.0%) |
Property Value to Household Income Ratio in Franklin Center
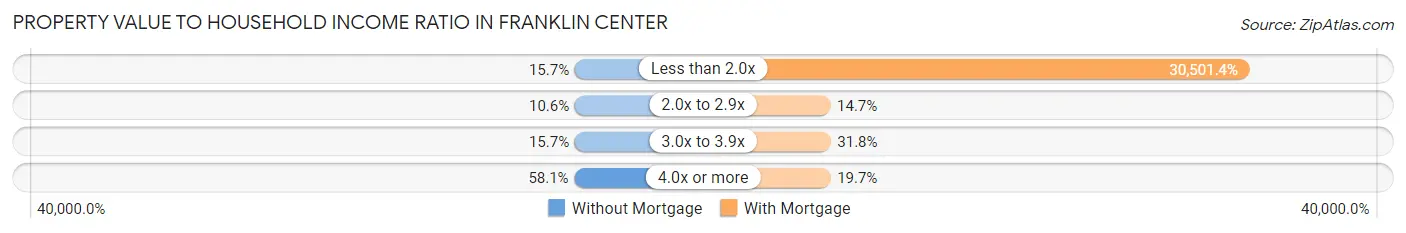
| Value-to-Income Ratio | Without Mortgage | With Mortgage |
| Less than 2.0x | 161 (15.7%) | 211,985 (30,501.4%) |
| 2.0x to 2.9x | 109 (10.6%) | 102 (14.7%) |
| 3.0x to 3.9x | 161 (15.7%) | 221 (31.8%) |
| 4.0x or more | 598 (58.1%) | 137 (19.7%) |
| Total | 1,029 (100.0%) | 695 (100.0%) |
Real Estate Taxes by Mortgage Status in Franklin Center
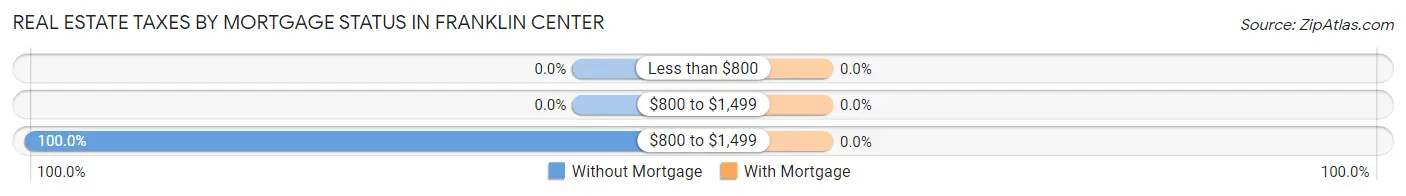
| Property Taxes | Without Mortgage | With Mortgage |
| Less than $800 | 0 (0.0%) | 0 (0.0%) |
| $800 to $1,499 | 0 (0.0%) | 0 (0.0%) |
| $800 to $1,499 | 1,029 (100.0%) | 0 (0.0%) |
| Total | 1,029 (100.0%) | 695 (100.0%) |
Health & Disability in Franklin Center
Health Insurance Coverage by Age in Franklin Center
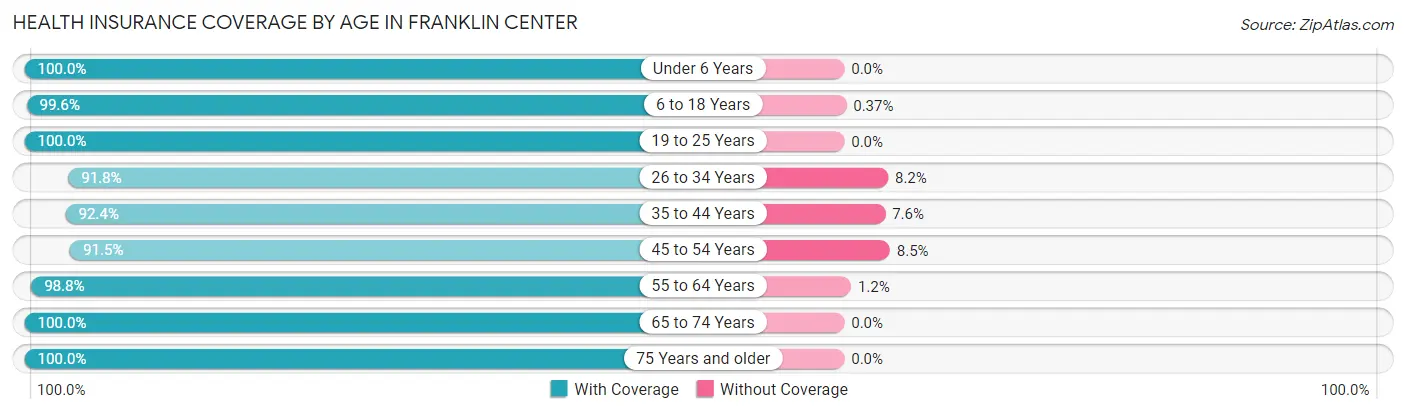
| Age Bracket | With Coverage | Without Coverage |
| Under 6 Years | 289 (100.0%) | 0 (0.0%) |
| 6 to 18 Years | 545 (99.6%) | 2 (0.4%) |
| 19 to 25 Years | 248 (100.0%) | 0 (0.0%) |
| 26 to 34 Years | 450 (91.8%) | 40 (8.2%) |
| 35 to 44 Years | 545 (92.4%) | 45 (7.6%) |
| 45 to 54 Years | 442 (91.5%) | 41 (8.5%) |
| 55 to 64 Years | 714 (98.8%) | 9 (1.2%) |
| 65 to 74 Years | 1,358 (100.0%) | 0 (0.0%) |
| 75 Years and older | 835 (100.0%) | 0 (0.0%) |
| Total | 5,426 (97.5%) | 137 (2.5%) |
Health Insurance Coverage by Citizenship Status in Franklin Center
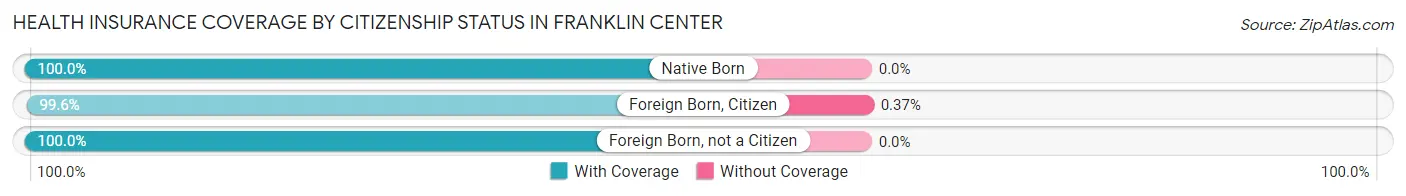
| Citizenship Status | With Coverage | Without Coverage |
| Native Born | 289 (100.0%) | 0 (0.0%) |
| Foreign Born, Citizen | 545 (99.6%) | 2 (0.4%) |
| Foreign Born, not a Citizen | 248 (100.0%) | 0 (0.0%) |
Health Insurance Coverage by Household Income in Franklin Center
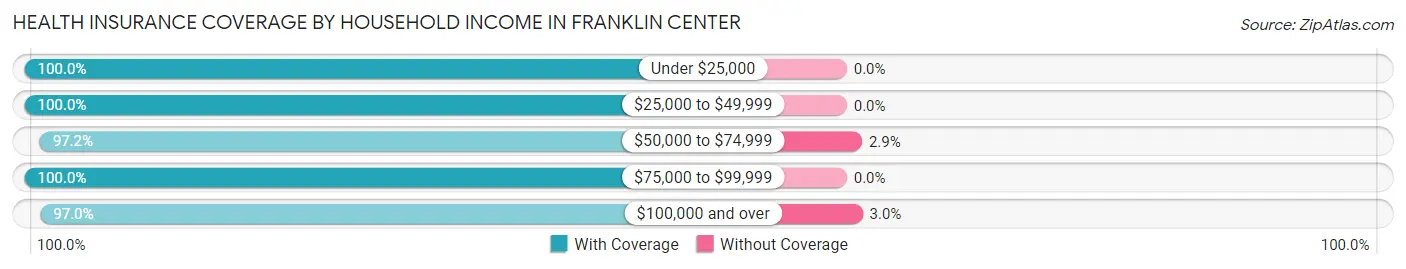
| Household Income | With Coverage | Without Coverage |
| Under $25,000 | 269 (100.0%) | 0 (0.0%) |
| $25,000 to $49,999 | 443 (100.0%) | 0 (0.0%) |
| $50,000 to $74,999 | 409 (97.2%) | 12 (2.9%) |
| $75,000 to $99,999 | 543 (100.0%) | 0 (0.0%) |
| $100,000 and over | 3,737 (97.0%) | 114 (3.0%) |
Public vs Private Health Insurance Coverage by Age in Franklin Center
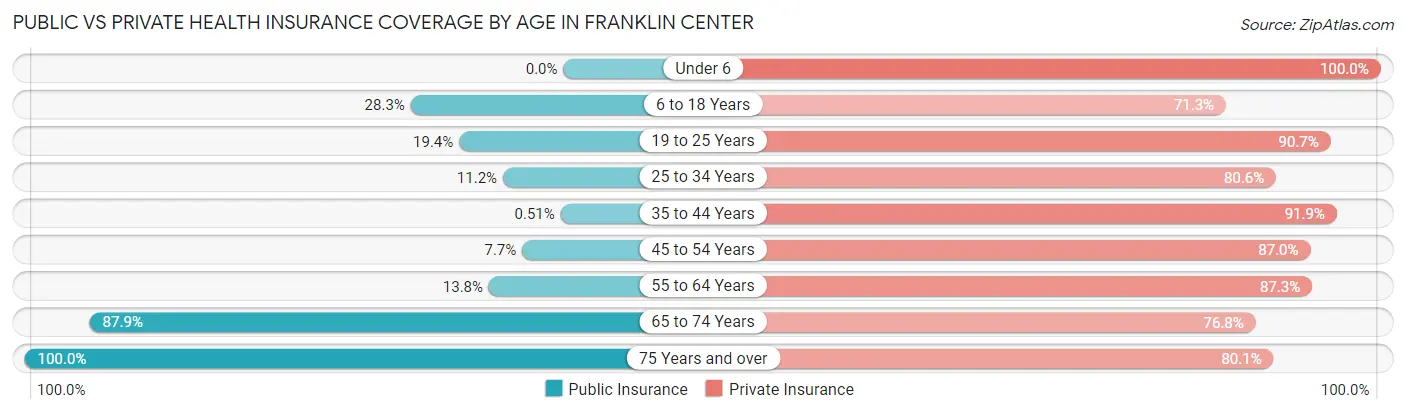
| Age Bracket | Public Insurance | Private Insurance |
| Under 6 | 0 (0.0%) | 289 (100.0%) |
| 6 to 18 Years | 155 (28.3%) | 390 (71.3%) |
| 19 to 25 Years | 48 (19.4%) | 225 (90.7%) |
| 25 to 34 Years | 55 (11.2%) | 395 (80.6%) |
| 35 to 44 Years | 3 (0.5%) | 542 (91.9%) |
| 45 to 54 Years | 37 (7.7%) | 420 (87.0%) |
| 55 to 64 Years | 100 (13.8%) | 631 (87.3%) |
| 65 to 74 Years | 1,194 (87.9%) | 1,043 (76.8%) |
| 75 Years and over | 835 (100.0%) | 669 (80.1%) |
| Total | 2,427 (43.6%) | 4,604 (82.8%) |
Disability Status by Sex by Age in Franklin Center
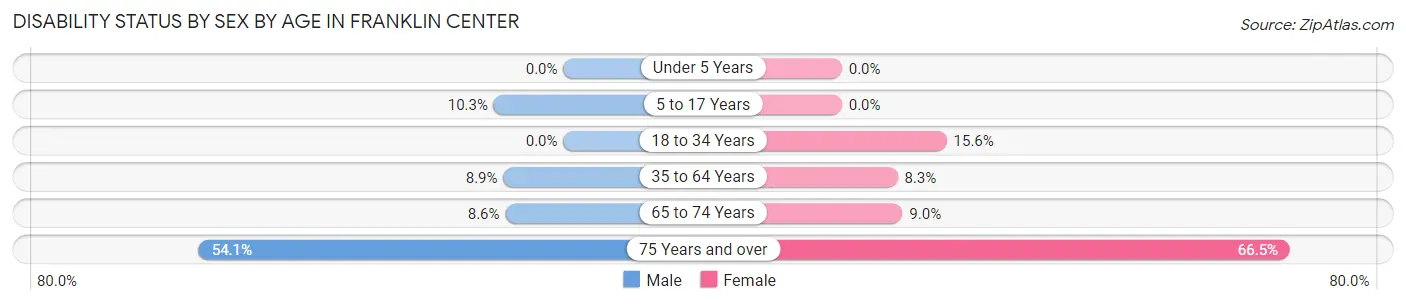
| Age Bracket | Male | Female |
| Under 5 Years | 0 (0.0%) | 0 (0.0%) |
| 5 to 17 Years | 38 (10.3%) | 0 (0.0%) |
| 18 to 34 Years | 0 (0.0%) | 47 (15.6%) |
| 35 to 64 Years | 91 (8.9%) | 64 (8.3%) |
| 65 to 74 Years | 49 (8.6%) | 71 (9.0%) |
| 75 Years and over | 177 (54.1%) | 338 (66.5%) |
Disability Class by Sex by Age in Franklin Center
Disability Class: Hearing Difficulty
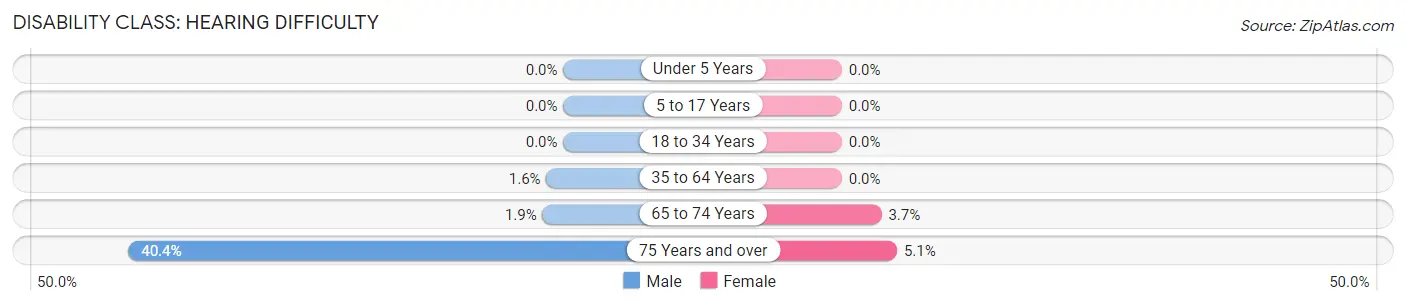
| Age Bracket | Male | Female |
| Under 5 Years | 0 (0.0%) | 0 (0.0%) |
| 5 to 17 Years | 0 (0.0%) | 0 (0.0%) |
| 18 to 34 Years | 0 (0.0%) | 0 (0.0%) |
| 35 to 64 Years | 16 (1.6%) | 0 (0.0%) |
| 65 to 74 Years | 11 (1.9%) | 29 (3.7%) |
| 75 Years and over | 132 (40.4%) | 26 (5.1%) |
Disability Class: Vision Difficulty
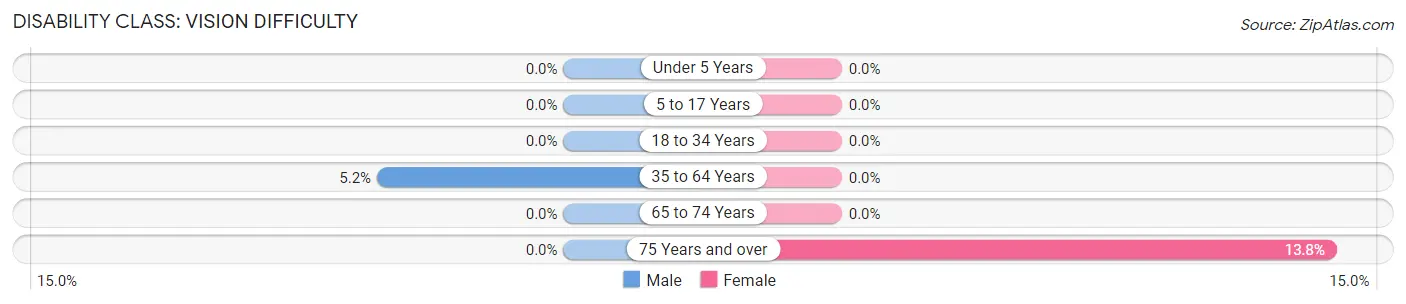
| Age Bracket | Male | Female |
| Under 5 Years | 0 (0.0%) | 0 (0.0%) |
| 5 to 17 Years | 0 (0.0%) | 0 (0.0%) |
| 18 to 34 Years | 0 (0.0%) | 0 (0.0%) |
| 35 to 64 Years | 53 (5.2%) | 0 (0.0%) |
| 65 to 74 Years | 0 (0.0%) | 0 (0.0%) |
| 75 Years and over | 0 (0.0%) | 70 (13.8%) |
Disability Class: Cognitive Difficulty
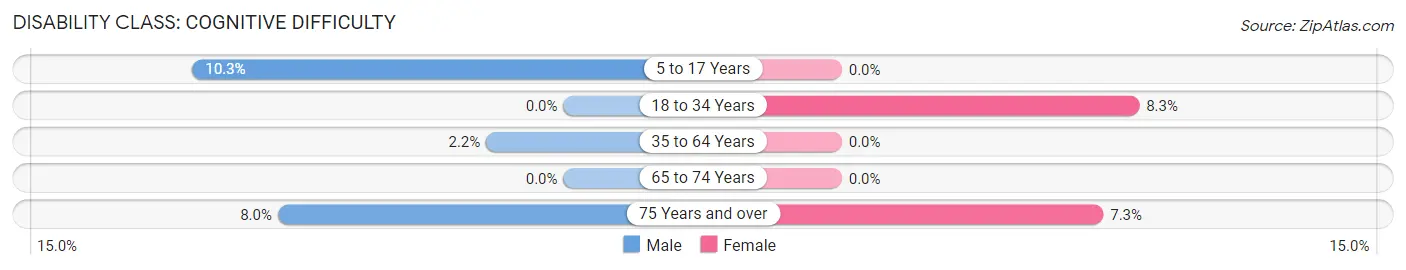
| Age Bracket | Male | Female |
| 5 to 17 Years | 38 (10.3%) | 0 (0.0%) |
| 18 to 34 Years | 0 (0.0%) | 25 (8.3%) |
| 35 to 64 Years | 22 (2.1%) | 0 (0.0%) |
| 65 to 74 Years | 0 (0.0%) | 0 (0.0%) |
| 75 Years and over | 26 (8.0%) | 37 (7.3%) |
Disability Class: Ambulatory Difficulty
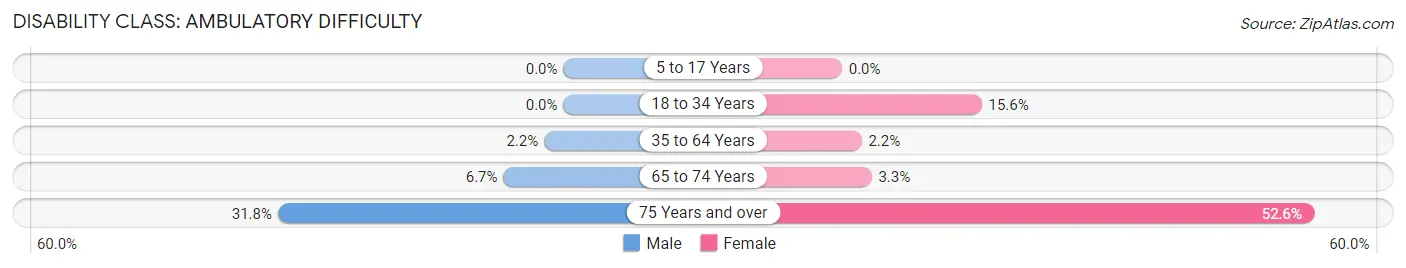
| Age Bracket | Male | Female |
| 5 to 17 Years | 0 (0.0%) | 0 (0.0%) |
| 18 to 34 Years | 0 (0.0%) | 47 (15.6%) |
| 35 to 64 Years | 22 (2.1%) | 17 (2.2%) |
| 65 to 74 Years | 38 (6.7%) | 26 (3.3%) |
| 75 Years and over | 104 (31.8%) | 267 (52.6%) |
Disability Class: Self-Care Difficulty
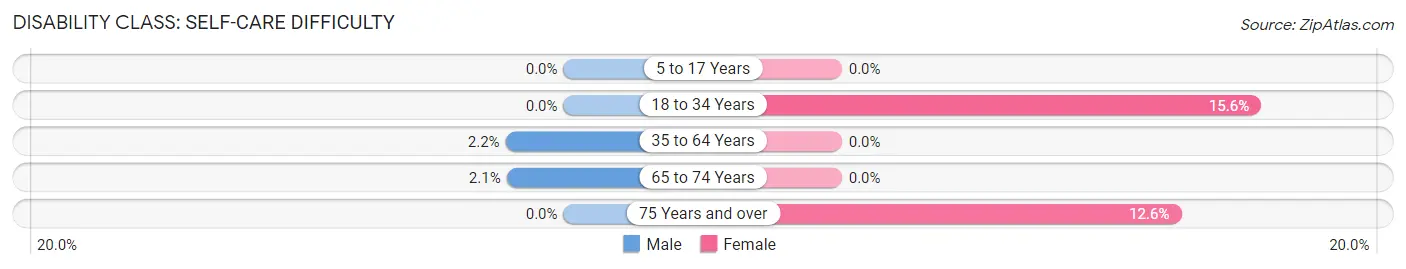
| Age Bracket | Male | Female |
| 5 to 17 Years | 0 (0.0%) | 0 (0.0%) |
| 18 to 34 Years | 0 (0.0%) | 47 (15.6%) |
| 35 to 64 Years | 22 (2.1%) | 0 (0.0%) |
| 65 to 74 Years | 12 (2.1%) | 0 (0.0%) |
| 75 Years and over | 0 (0.0%) | 64 (12.6%) |
Technology Access in Franklin Center
Computing Device Access in Franklin Center
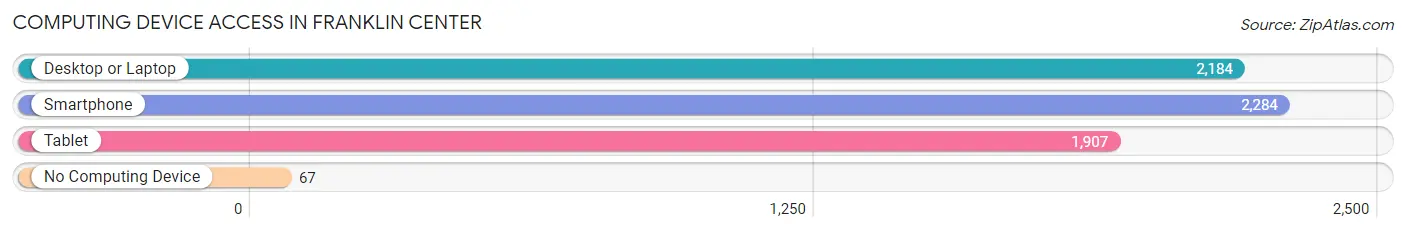
| Device Type | # Households | % Households |
| Desktop or Laptop | 2,184 | 88.9% |
| Smartphone | 2,284 | 93.0% |
| Tablet | 1,907 | 77.6% |
| No Computing Device | 67 | 2.7% |
| Total | 2,456 | 100.0% |
Internet Access in Franklin Center
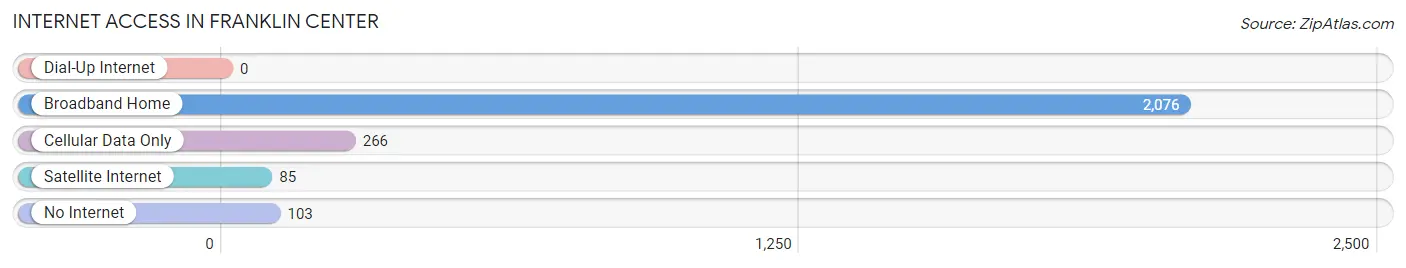
| Internet Type | # Households | % Households |
| Dial-Up Internet | 0 | 0.0% |
| Broadband Home | 2,076 | 84.5% |
| Cellular Data Only | 266 | 10.8% |
| Satellite Internet | 85 | 3.5% |
| No Internet | 103 | 4.2% |
| Total | 2,456 | 100.0% |
Franklin Center Summary
Franklin Center is an unincorporated community located in Somerset County, New Jersey. It is situated within Franklin Township, which is located in the central part of the state. The community is located approximately 25 miles from New York City and is part of the New York metropolitan area.
History
The area that is now Franklin Center was first settled in the late 1700s by Dutch and German immigrants. The area was originally known as “Franklin” and was part of Franklin Township. In 1845, the area was officially incorporated as the Borough of Franklin Center. The borough was named after Benjamin Franklin, who was a prominent figure in the American Revolution.
In 1875, the borough was dissolved and the area was reincorporated as part of Franklin Township. The area has remained part of Franklin Township ever since.
Geography
Franklin Center is located in central New Jersey, approximately 25 miles from New York City. It is situated within Franklin Township, which is located in Somerset County. The community is bordered by the communities of Somerset, Hillsborough, and Manville.
The area is mostly rural, with rolling hills and farmland. The area is home to several small lakes, including Lake Manasquan and Lake Cushetunk.
Economy
The economy of Franklin Center is largely based on agriculture. The area is home to several farms, which produce a variety of crops, including corn, soybeans, and hay. The area is also home to several wineries, which produce a variety of wines.
The area is also home to several small businesses, including restaurants, retail stores, and professional services. The area is also home to several industrial parks, which are home to a variety of businesses, including manufacturing and distribution companies.
Demographics
As of the 2010 census, the population of Franklin Center was 8,945. The population is largely white (90.3%), with small percentages of African American (3.2%), Asian (2.2%), and Hispanic (2.2%) residents. The median household income is $90,945, and the median home value is $400,000.
The area is home to several churches, including the Franklin Center United Methodist Church, the Franklin Center Presbyterian Church, and the Franklin Center Baptist Church. The area is also home to several schools, including Franklin Township High School, Franklin Township Middle School, and Franklin Township Elementary School.
Conclusion
Franklin Center is an unincorporated community located in Somerset County, New Jersey. It is situated within Franklin Township, which is located in the central part of the state. The area was first settled in the late 1700s by Dutch and German immigrants and was officially incorporated as the Borough of Franklin Center in 1845. The area has remained part of Franklin Township ever since. The economy of Franklin Center is largely based on agriculture, with several farms and wineries located in the area. The population of Franklin Center is largely white, with a median household income of $90,945 and a median home value of $400,000. The area is home to several churches and schools, and is also home to several small businesses and industrial parks.
Common Questions
What is Per Capita Income in Franklin Center?
Per Capita income in Franklin Center is $72,874.
What is the Median Family Income in Franklin Center?
Median Family Income in Franklin Center is $171,420.
What is the Median Household income in Franklin Center?
Median Household Income in Franklin Center is $132,787.
What is Income or Wage Gap in Franklin Center?
Income or Wage Gap in Franklin Center is 13.4%.
Women in Franklin Center earn 86.6 cents for every dollar earned by a man.
What is Inequality or Gini Index in Franklin Center?
Inequality or Gini Index in Franklin Center is 0.41.
What is the Total Population of Franklin Center?
Total Population of Franklin Center is 5,583.
What is the Total Male Population of Franklin Center?
Total Male Population of Franklin Center is 2,866.
What is the Total Female Population of Franklin Center?
Total Female Population of Franklin Center is 2,717.
What is the Ratio of Males per 100 Females in Franklin Center?
There are 105.48 Males per 100 Females in Franklin Center.
What is the Ratio of Females per 100 Males in Franklin Center?
There are 94.80 Females per 100 Males in Franklin Center.
What is the Median Population Age in Franklin Center?
Median Population Age in Franklin Center is 57.5 Years.
What is the Average Family Size in Franklin Center
Average Family Size in Franklin Center is 2.8 People.
What is the Average Household Size in Franklin Center
Average Household Size in Franklin Center is 2.2 People.
How Large is the Labor Force in Franklin Center?
There are 2,791 People in the Labor Forcein in Franklin Center.
What is the Percentage of People in the Labor Force in Franklin Center?
58.2% of People are in the Labor Force in Franklin Center.
What is the Unemployment Rate in Franklin Center?
Unemployment Rate in Franklin Center is 7.6%.