Cities with the Most Immigrants from Russia in New Jersey
RELATED REPORTS & OPTIONS
Russia
New Jersey
Compare Cities
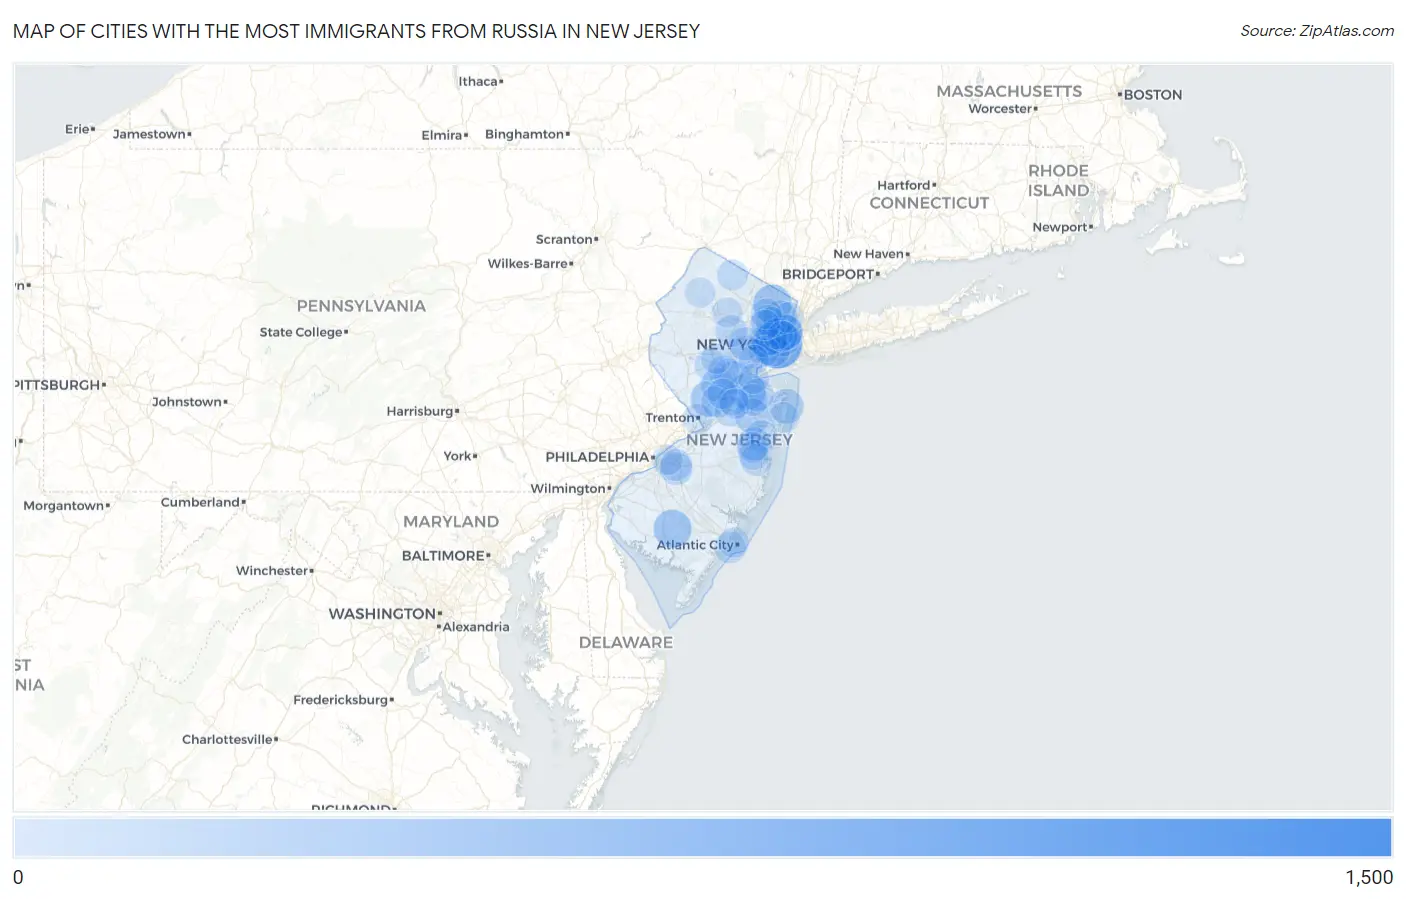
Map of Cities with the Most Immigrants from Russia in New Jersey
0
1,500
Cities with the Most Immigrants from Russia in New Jersey
| City | Russia | vs State | vs National | |
| 1. | Fair Lawn Borough | 1,035 | 20,371(5.08%)#1 | 406,732(0.25%)#26 |
| 2. | Jersey City | 725 | 20,371(3.56%)#2 | 406,732(0.18%)#48 |
| 3. | Fort Lee Borough | 659 | 20,371(3.23%)#3 | 406,732(0.16%)#57 |
| 4. | Cliffside Park Borough | 343 | 20,371(1.68%)#4 | 406,732(0.08%)#144 |
| 5. | Ridgewood | 323 | 20,371(1.59%)#5 | 406,732(0.08%)#160 |
| 6. | Vineland | 309 | 20,371(1.52%)#6 | 406,732(0.08%)#165 |
| 7. | Old Bridge | 252 | 20,371(1.24%)#7 | 406,732(0.06%)#204 |
| 8. | Princeton | 250 | 20,371(1.23%)#8 | 406,732(0.06%)#206 |
| 9. | Preakness | 240 | 20,371(1.18%)#9 | 406,732(0.06%)#213 |
| 10. | Guttenberg | 227 | 20,371(1.11%)#10 | 406,732(0.06%)#230 |
| 11. | Hoboken | 210 | 20,371(1.03%)#11 | 406,732(0.05%)#253 |
| 12. | West Freehold | 201 | 20,371(0.99%)#12 | 406,732(0.05%)#271 |
| 13. | West New York | 197 | 20,371(0.97%)#13 | 406,732(0.05%)#280 |
| 14. | Long Branch | 194 | 20,371(0.95%)#14 | 406,732(0.05%)#292 |
| 15. | New Providence Borough | 183 | 20,371(0.90%)#15 | 406,732(0.04%)#313 |
| 16. | Hackensack | 178 | 20,371(0.87%)#16 | 406,732(0.04%)#325 |
| 17. | Paramus Borough | 151 | 20,371(0.74%)#17 | 406,732(0.04%)#381 |
| 18. | Oakland Borough | 151 | 20,371(0.74%)#18 | 406,732(0.04%)#382 |
| 19. | Griggstown | 150 | 20,371(0.74%)#19 | 406,732(0.04%)#383 |
| 20. | Westfield | 136 | 20,371(0.67%)#20 | 406,732(0.03%)#421 |
| 21. | Cedar Glen West | 130 | 20,371(0.64%)#21 | 406,732(0.03%)#441 |
| 22. | Franklin Lakes Borough | 129 | 20,371(0.63%)#22 | 406,732(0.03%)#444 |
| 23. | New Brunswick | 125 | 20,371(0.61%)#23 | 406,732(0.03%)#458 |
| 24. | Summit | 125 | 20,371(0.61%)#24 | 406,732(0.03%)#460 |
| 25. | Morganville | 120 | 20,371(0.59%)#25 | 406,732(0.03%)#484 |
| 26. | Bayonne | 116 | 20,371(0.57%)#26 | 406,732(0.03%)#497 |
| 27. | Plainsboro Center | 115 | 20,371(0.56%)#27 | 406,732(0.03%)#508 |
| 28. | Springdale | 110 | 20,371(0.54%)#28 | 406,732(0.03%)#528 |
| 29. | Cresskill Borough | 107 | 20,371(0.53%)#29 | 406,732(0.03%)#546 |
| 30. | Newark | 103 | 20,371(0.51%)#30 | 406,732(0.03%)#564 |
| 31. | Clifton | 101 | 20,371(0.50%)#31 | 406,732(0.02%)#575 |
| 32. | River Edge Borough | 101 | 20,371(0.50%)#32 | 406,732(0.02%)#584 |
| 33. | Edgewater Borough | 100 | 20,371(0.49%)#33 | 406,732(0.02%)#588 |
| 34. | Kearny | 98 | 20,371(0.48%)#34 | 406,732(0.02%)#593 |
| 35. | Highland Park Borough | 94 | 20,371(0.46%)#35 | 406,732(0.02%)#605 |
| 36. | Robertsville | 94 | 20,371(0.46%)#36 | 406,732(0.02%)#606 |
| 37. | Morristown | 93 | 20,371(0.46%)#37 | 406,732(0.02%)#611 |
| 38. | Lakewood | 92 | 20,371(0.45%)#38 | 406,732(0.02%)#615 |
| 39. | Hawthorne Borough | 92 | 20,371(0.45%)#39 | 406,732(0.02%)#621 |
| 40. | North Haledon Borough | 92 | 20,371(0.45%)#40 | 406,732(0.02%)#623 |
| 41. | Lodi Borough | 89 | 20,371(0.44%)#41 | 406,732(0.02%)#641 |
| 42. | Tenafly Borough | 88 | 20,371(0.43%)#42 | 406,732(0.02%)#652 |
| 43. | Franklin Center | 84 | 20,371(0.41%)#43 | 406,732(0.02%)#688 |
| 44. | Greentree | 83 | 20,371(0.41%)#44 | 406,732(0.02%)#699 |
| 45. | Holiday Heights | 82 | 20,371(0.40%)#45 | 406,732(0.02%)#708 |
| 46. | Saddle River Borough | 79 | 20,371(0.39%)#46 | 406,732(0.02%)#726 |
| 47. | Basking Ridge | 75 | 20,371(0.37%)#47 | 406,732(0.02%)#759 |
| 48. | Ventnor City | 74 | 20,371(0.36%)#48 | 406,732(0.02%)#768 |
| 49. | North Plainfield Borough | 69 | 20,371(0.34%)#49 | 406,732(0.02%)#815 |
| 50. | Secaucus | 69 | 20,371(0.34%)#50 | 406,732(0.02%)#816 |
| 51. | Manville Borough | 69 | 20,371(0.34%)#51 | 406,732(0.02%)#819 |
| 52. | Florham Park Borough | 66 | 20,371(0.32%)#52 | 406,732(0.02%)#869 |
| 53. | Bergenfield Borough | 63 | 20,371(0.31%)#53 | 406,732(0.02%)#893 |
| 54. | Glassboro Borough | 63 | 20,371(0.31%)#54 | 406,732(0.02%)#896 |
| 55. | Berlin Borough | 63 | 20,371(0.31%)#55 | 406,732(0.02%)#899 |
| 56. | Bradley Gardens | 62 | 20,371(0.30%)#56 | 406,732(0.02%)#911 |
| 57. | Leisure Knoll | 61 | 20,371(0.30%)#57 | 406,732(0.01%)#924 |
| 58. | Highland Lakes | 60 | 20,371(0.29%)#58 | 406,732(0.01%)#937 |
| 59. | Leonia Borough | 59 | 20,371(0.29%)#59 | 406,732(0.01%)#950 |
| 60. | Northvale Borough | 58 | 20,371(0.28%)#60 | 406,732(0.01%)#968 |
| 61. | Allendale Borough | 57 | 20,371(0.28%)#61 | 406,732(0.01%)#985 |
| 62. | Passaic | 56 | 20,371(0.27%)#62 | 406,732(0.01%)#995 |
| 63. | Sayreville Borough | 55 | 20,371(0.27%)#63 | 406,732(0.01%)#1,008 |
| 64. | Carteret Borough | 55 | 20,371(0.27%)#64 | 406,732(0.01%)#1,014 |
| 65. | Elizabeth | 54 | 20,371(0.27%)#65 | 406,732(0.01%)#1,019 |
| 66. | Englewood | 54 | 20,371(0.27%)#66 | 406,732(0.01%)#1,028 |
| 67. | Hillsdale Borough | 52 | 20,371(0.26%)#67 | 406,732(0.01%)#1,067 |
| 68. | Paterson | 51 | 20,371(0.25%)#68 | 406,732(0.01%)#1,076 |
| 69. | Twin Rivers | 51 | 20,371(0.25%)#69 | 406,732(0.01%)#1,094 |
| 70. | Clearbrook | 51 | 20,371(0.25%)#70 | 406,732(0.01%)#1,098 |
| 71. | Rossmoor | 50 | 20,371(0.25%)#71 | 406,732(0.01%)#1,120 |
| 72. | Asbury Park | 47 | 20,371(0.23%)#72 | 406,732(0.01%)#1,168 |
| 73. | Oradell Borough | 47 | 20,371(0.23%)#73 | 406,732(0.01%)#1,170 |
| 74. | Hightstown Borough | 45 | 20,371(0.22%)#74 | 406,732(0.01%)#1,213 |
| 75. | Union City | 44 | 20,371(0.22%)#75 | 406,732(0.01%)#1,218 |
| 76. | New Milford Borough | 43 | 20,371(0.21%)#76 | 406,732(0.01%)#1,254 |
| 77. | Wanaque Borough | 43 | 20,371(0.21%)#77 | 406,732(0.01%)#1,262 |
| 78. | Golden Triangle | 43 | 20,371(0.21%)#78 | 406,732(0.01%)#1,266 |
| 79. | Somerset | 42 | 20,371(0.21%)#79 | 406,732(0.01%)#1,285 |
| 80. | Pines Lake | 42 | 20,371(0.21%)#80 | 406,732(0.01%)#1,301 |
| 81. | Trenton | 41 | 20,371(0.20%)#81 | 406,732(0.01%)#1,303 |
| 82. | Lake Hopatcong | 41 | 20,371(0.20%)#82 | 406,732(0.01%)#1,324 |
| 83. | Bridgewater Center | 41 | 20,371(0.20%)#83 | 406,732(0.01%)#1,326 |
| 84. | Parsippany | 40 | 20,371(0.20%)#84 | 406,732(0.01%)#1,350 |
| 85. | Rahway | 39 | 20,371(0.19%)#85 | 406,732(0.01%)#1,373 |
| 86. | South Amboy | 39 | 20,371(0.19%)#86 | 406,732(0.01%)#1,381 |
| 87. | Whippany | 39 | 20,371(0.19%)#87 | 406,732(0.01%)#1,382 |
| 88. | Rutherford Borough | 38 | 20,371(0.19%)#88 | 406,732(0.01%)#1,399 |
| 89. | Atlantic City | 37 | 20,371(0.18%)#89 | 406,732(0.01%)#1,416 |
| 90. | Monmouth Junction | 37 | 20,371(0.18%)#90 | 406,732(0.01%)#1,428 |
| 91. | Concordia | 37 | 20,371(0.18%)#91 | 406,732(0.01%)#1,434 |
| 92. | Brookdale | 36 | 20,371(0.18%)#92 | 406,732(0.01%)#1,456 |
| 93. | Maywood Borough | 34 | 20,371(0.17%)#93 | 406,732(0.01%)#1,523 |
| 94. | Newton | 34 | 20,371(0.17%)#94 | 406,732(0.01%)#1,525 |
| 95. | High Bridge Borough | 34 | 20,371(0.17%)#95 | 406,732(0.01%)#1,531 |
| 96. | Ramsey Borough | 33 | 20,371(0.16%)#96 | 406,732(0.01%)#1,549 |
| 97. | Holiday City Berkeley | 33 | 20,371(0.16%)#97 | 406,732(0.01%)#1,553 |
| 98. | Englewood Cliffs Borough | 33 | 20,371(0.16%)#98 | 406,732(0.01%)#1,558 |
| 99. | White Meadow Lake | 31 | 20,371(0.15%)#99 | 406,732(0.01%)#1,617 |
| 100. | Green Knoll | 31 | 20,371(0.15%)#100 | 406,732(0.01%)#1,622 |
Common Questions
What are the Top 10 Cities with the Most Immigrants from Russia in New Jersey?
Top 10 Cities with the Most Immigrants from Russia in New Jersey are:
#1
725
#2
323
#3
309
#4
252
#5
250
#6
227
#7
210
#8
201
#9
197
#10
194
What city has the Most Immigrants from Russia in New Jersey?
Jersey City has the Most Immigrants from Russia in New Jersey with 725.
What is the Total Immigrants from Russia in the State of New Jersey?
Total Immigrants from Russia in New Jersey is 20,371.
What is the Total Immigrants from Russia in the United States?
Total Immigrants from Russia in the United States is 406,732.