Cities with the Most Immigrants from Eastern Africa in New Jersey
RELATED REPORTS & OPTIONS
Eastern Africa
New Jersey
Compare Cities
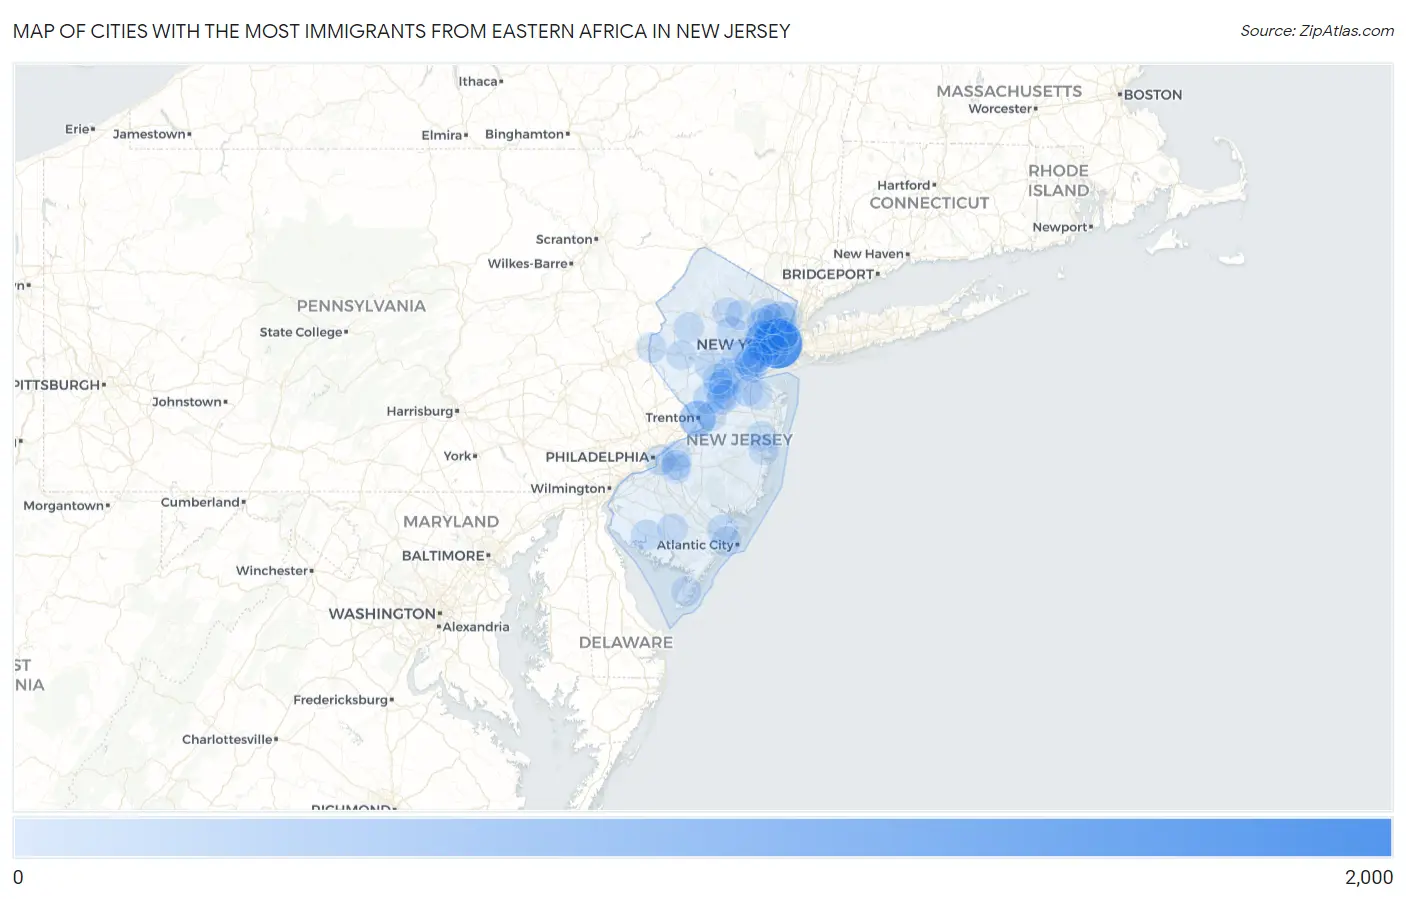
Map of Cities with the Most Immigrants from Eastern Africa in New Jersey
0
2,000
Cities with the Most Immigrants from Eastern Africa in New Jersey
| City | Eastern Africa | vs State | vs National | |
| 1. | Jersey City | 1,672 | 13,566(12.32%)#1 | 752,337(0.22%)#68 |
| 2. | Newark | 850 | 13,566(6.27%)#2 | 752,337(0.11%)#147 |
| 3. | Trenton | 522 | 13,566(3.85%)#3 | 752,337(0.07%)#242 |
| 4. | Sayreville Borough | 510 | 13,566(3.76%)#4 | 752,337(0.07%)#245 |
| 5. | Edgewater Borough | 306 | 13,566(2.26%)#5 | 752,337(0.04%)#376 |
| 6. | Hackensack | 227 | 13,566(1.67%)#6 | 752,337(0.03%)#485 |
| 7. | East Orange | 196 | 13,566(1.44%)#7 | 752,337(0.03%)#544 |
| 8. | Secaucus | 169 | 13,566(1.25%)#8 | 752,337(0.02%)#603 |
| 9. | Collingswood Borough | 157 | 13,566(1.16%)#9 | 752,337(0.02%)#644 |
| 10. | Somerset | 126 | 13,566(0.93%)#10 | 752,337(0.02%)#763 |
| 11. | Iselin | 126 | 13,566(0.93%)#11 | 752,337(0.02%)#765 |
| 12. | Lodi Borough | 125 | 13,566(0.92%)#12 | 752,337(0.02%)#771 |
| 13. | Cliffside Park Borough | 121 | 13,566(0.89%)#13 | 752,337(0.02%)#787 |
| 14. | Plainfield | 117 | 13,566(0.86%)#14 | 752,337(0.02%)#800 |
| 15. | Princeton | 117 | 13,566(0.86%)#15 | 752,337(0.02%)#801 |
| 16. | Kearny | 109 | 13,566(0.80%)#16 | 752,337(0.01%)#844 |
| 17. | Elizabeth | 101 | 13,566(0.74%)#17 | 752,337(0.01%)#890 |
| 18. | Hoboken | 99 | 13,566(0.73%)#18 | 752,337(0.01%)#899 |
| 19. | Clifton | 95 | 13,566(0.70%)#19 | 752,337(0.01%)#919 |
| 20. | Bradley Gardens | 88 | 13,566(0.65%)#20 | 752,337(0.01%)#966 |
| 21. | Ten Mile Run | 86 | 13,566(0.63%)#21 | 752,337(0.01%)#984 |
| 22. | Camden | 79 | 13,566(0.58%)#22 | 752,337(0.01%)#1,032 |
| 23. | New Brunswick | 79 | 13,566(0.58%)#23 | 752,337(0.01%)#1,033 |
| 24. | Harrison | 75 | 13,566(0.55%)#24 | 752,337(0.01%)#1,069 |
| 25. | Pomona | 75 | 13,566(0.55%)#25 | 752,337(0.01%)#1,074 |
| 26. | Bridgeton | 70 | 13,566(0.52%)#26 | 752,337(0.01%)#1,122 |
| 27. | Landing | 70 | 13,566(0.52%)#27 | 752,337(0.01%)#1,128 |
| 28. | Palisades Park Borough | 69 | 13,566(0.51%)#28 | 752,337(0.01%)#1,136 |
| 29. | Vineland | 64 | 13,566(0.47%)#29 | 752,337(0.01%)#1,181 |
| 30. | Highland Park Borough | 64 | 13,566(0.47%)#30 | 752,337(0.01%)#1,184 |
| 31. | Goshen | 62 | 13,566(0.46%)#31 | 752,337(0.01%)#1,210 |
| 32. | Paterson | 59 | 13,566(0.43%)#32 | 752,337(0.01%)#1,236 |
| 33. | Rutherford Borough | 58 | 13,566(0.43%)#33 | 752,337(0.01%)#1,258 |
| 34. | Woodland Park Borough | 57 | 13,566(0.42%)#34 | 752,337(0.01%)#1,275 |
| 35. | Westwood Borough | 56 | 13,566(0.41%)#35 | 752,337(0.01%)#1,289 |
| 36. | Phillipsburg | 55 | 13,566(0.41%)#36 | 752,337(0.01%)#1,307 |
| 37. | Parsippany | 54 | 13,566(0.40%)#37 | 752,337(0.01%)#1,318 |
| 38. | Woodbridge | 52 | 13,566(0.38%)#38 | 752,337(0.01%)#1,355 |
| 39. | Franklin Park | 52 | 13,566(0.38%)#39 | 752,337(0.01%)#1,361 |
| 40. | Ridgefield Borough | 52 | 13,566(0.38%)#40 | 752,337(0.01%)#1,363 |
| 41. | Union City | 51 | 13,566(0.38%)#41 | 752,337(0.01%)#1,368 |
| 42. | Glassboro Borough | 51 | 13,566(0.38%)#42 | 752,337(0.01%)#1,373 |
| 43. | Upper Montclair | 49 | 13,566(0.36%)#43 | 752,337(0.01%)#1,395 |
| 44. | Carteret Borough | 47 | 13,566(0.35%)#44 | 752,337(0.01%)#1,425 |
| 45. | Garfield | 44 | 13,566(0.32%)#45 | 752,337(0.01%)#1,469 |
| 46. | Bergenfield Borough | 43 | 13,566(0.32%)#46 | 752,337(0.01%)#1,489 |
| 47. | Bellmawr Borough | 43 | 13,566(0.32%)#47 | 752,337(0.01%)#1,497 |
| 48. | Colonia | 40 | 13,566(0.29%)#48 | 752,337(0.01%)#1,542 |
| 49. | Monmouth Junction | 38 | 13,566(0.28%)#49 | 752,337(0.01%)#1,581 |
| 50. | Whitesboro | 37 | 13,566(0.27%)#50 | 752,337(0.00%)#1,608 |
| 51. | Avenel | 36 | 13,566(0.27%)#51 | 752,337(0.00%)#1,616 |
| 52. | White Meadow Lake | 35 | 13,566(0.26%)#52 | 752,337(0.00%)#1,646 |
| 53. | Dayton | 35 | 13,566(0.26%)#53 | 752,337(0.00%)#1,647 |
| 54. | Lakewood | 34 | 13,566(0.25%)#54 | 752,337(0.00%)#1,654 |
| 55. | New Milford Borough | 34 | 13,566(0.25%)#55 | 752,337(0.00%)#1,663 |
| 56. | Englewood Cliffs Borough | 34 | 13,566(0.25%)#56 | 752,337(0.00%)#1,669 |
| 57. | Beattystown | 34 | 13,566(0.25%)#57 | 752,337(0.00%)#1,670 |
| 58. | Hamilton Square | 32 | 13,566(0.24%)#58 | 752,337(0.00%)#1,716 |
| 59. | Maywood Borough | 32 | 13,566(0.24%)#59 | 752,337(0.00%)#1,717 |
| 60. | Paramus Borough | 31 | 13,566(0.23%)#60 | 752,337(0.00%)#1,737 |
| 61. | Pleasantville | 29 | 13,566(0.21%)#61 | 752,337(0.00%)#1,796 |
| 62. | Moorestown Lenola | 29 | 13,566(0.21%)#62 | 752,337(0.00%)#1,798 |
| 63. | Franklin Lakes Borough | 29 | 13,566(0.21%)#63 | 752,337(0.00%)#1,800 |
| 64. | Prospect Park Borough | 29 | 13,566(0.21%)#64 | 752,337(0.00%)#1,805 |
| 65. | Hasbrouck Heights Borough | 28 | 13,566(0.21%)#65 | 752,337(0.00%)#1,832 |
| 66. | Somerdale Borough | 28 | 13,566(0.21%)#66 | 752,337(0.00%)#1,839 |
| 67. | West New York | 27 | 13,566(0.20%)#67 | 752,337(0.00%)#1,851 |
| 68. | Rainbow Lakes | 27 | 13,566(0.20%)#68 | 752,337(0.00%)#1,874 |
| 69. | Bayonne | 26 | 13,566(0.19%)#69 | 752,337(0.00%)#1,881 |
| 70. | Princeton Meadows | 26 | 13,566(0.19%)#70 | 752,337(0.00%)#1,898 |
| 71. | Somerville Borough | 26 | 13,566(0.19%)#71 | 752,337(0.00%)#1,901 |
| 72. | Old Bridge | 25 | 13,566(0.18%)#72 | 752,337(0.00%)#1,916 |
| 73. | Morristown | 25 | 13,566(0.18%)#73 | 752,337(0.00%)#1,923 |
| 74. | Toms River | 24 | 13,566(0.18%)#74 | 752,337(0.00%)#1,940 |
| 75. | South Plainfield Borough | 24 | 13,566(0.18%)#75 | 752,337(0.00%)#1,951 |
| 76. | Hillsdale Borough | 24 | 13,566(0.18%)#76 | 752,337(0.00%)#1,968 |
| 77. | Blackwells Mills | 24 | 13,566(0.18%)#77 | 752,337(0.00%)#1,970 |
| 78. | Dunellen Borough | 24 | 13,566(0.18%)#78 | 752,337(0.00%)#1,974 |
| 79. | Ramapo College Of New Jersey | 24 | 13,566(0.18%)#79 | 752,337(0.00%)#1,982 |
| 80. | Fort Lee Borough | 23 | 13,566(0.17%)#80 | 752,337(0.00%)#1,994 |
| 81. | Springdale | 23 | 13,566(0.17%)#81 | 752,337(0.00%)#2,014 |
| 82. | Bound Brook Borough | 22 | 13,566(0.16%)#82 | 752,337(0.00%)#2,048 |
| 83. | Roselle Park Borough | 21 | 13,566(0.15%)#83 | 752,337(0.00%)#2,081 |
| 84. | Fair Lawn Borough | 19 | 13,566(0.14%)#84 | 752,337(0.00%)#2,151 |
| 85. | Madison Borough | 19 | 13,566(0.14%)#85 | 752,337(0.00%)#2,162 |
| 86. | Metuchen Borough | 19 | 13,566(0.14%)#86 | 752,337(0.00%)#2,164 |
| 87. | The Hills | 19 | 13,566(0.14%)#87 | 752,337(0.00%)#2,166 |
| 88. | Waldwick Borough | 19 | 13,566(0.14%)#88 | 752,337(0.00%)#2,167 |
| 89. | Glen Rock Borough | 18 | 13,566(0.13%)#89 | 752,337(0.00%)#2,213 |
| 90. | Westfield | 17 | 13,566(0.13%)#90 | 752,337(0.00%)#2,236 |
| 91. | Morganville | 17 | 13,566(0.13%)#91 | 752,337(0.00%)#2,258 |
| 92. | Woodlynne Borough | 17 | 13,566(0.13%)#92 | 752,337(0.00%)#2,261 |
| 93. | Boonton | 16 | 13,566(0.12%)#93 | 752,337(0.00%)#2,286 |
| 94. | Hopatcong Borough | 15 | 13,566(0.11%)#94 | 752,337(0.00%)#2,328 |
| 95. | Greentree | 15 | 13,566(0.11%)#95 | 752,337(0.00%)#2,333 |
| 96. | Clinton | 15 | 13,566(0.11%)#96 | 752,337(0.00%)#2,361 |
| 97. | Pleasantdale | 14 | 13,566(0.10%)#97 | 752,337(0.00%)#2,417 |
| 98. | Englewood | 13 | 13,566(0.10%)#98 | 752,337(0.00%)#2,432 |
| 99. | Linden | 12 | 13,566(0.09%)#99 | 752,337(0.00%)#2,479 |
| 100. | Leonia Borough | 12 | 13,566(0.09%)#100 | 752,337(0.00%)#2,502 |
Common Questions
What are the Top 10 Cities with the Most Immigrants from Eastern Africa in New Jersey?
Top 10 Cities with the Most Immigrants from Eastern Africa in New Jersey are:
#1
1,672
#2
850
#3
522
#4
227
#5
196
#6
169
#7
126
#8
126
#9
117
#10
117
What city has the Most Immigrants from Eastern Africa in New Jersey?
Jersey City has the Most Immigrants from Eastern Africa in New Jersey with 1,672.
What is the Total Immigrants from Eastern Africa in the State of New Jersey?
Total Immigrants from Eastern Africa in New Jersey is 13,566.
What is the Total Immigrants from Eastern Africa in the United States?
Total Immigrants from Eastern Africa in the United States is 752,337.