Cities with the Highest Owner-Occupied Median Costs of Housing in New Jersey
RELATED REPORTS & OPTIONS
Highest Owner Housing Costs
New Jersey
Compare Cities
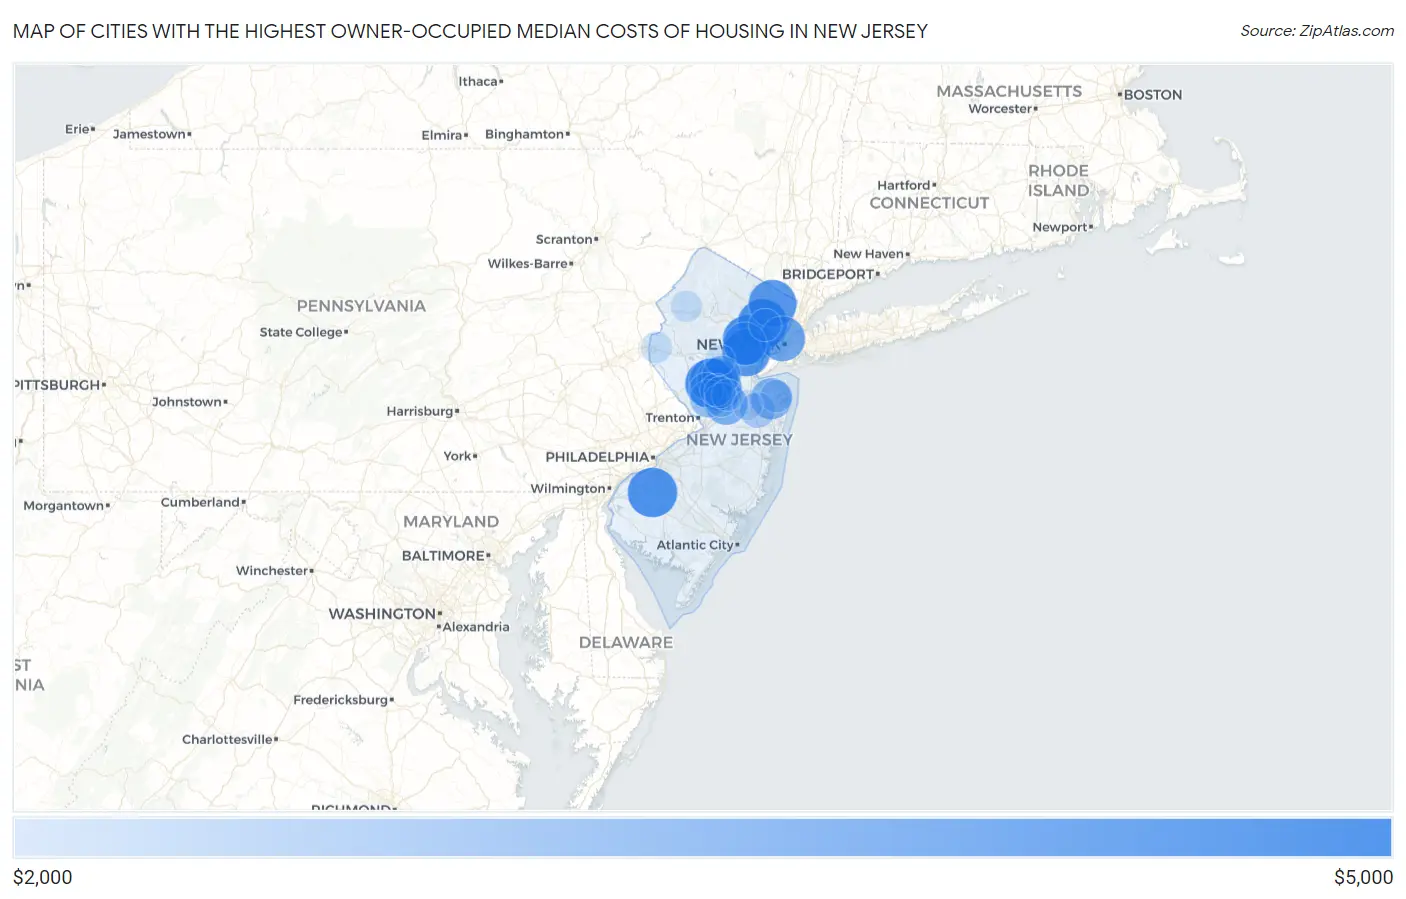
Map of Cities with the Highest Owner-Occupied Median Costs of Housing in New Jersey
$0
$5,000
Cities with the Highest Owner-Occupied Median Costs of Housing in New Jersey
| City | Housing Costs | vs State | vs National | |
| 1. | Short Hills | $4,001 | $2,101(+1.90k)#1 | $1,282(+2.72k)#20 |
| 2. | Upper Montclair | $4,001 | $2,101(+1.90k)#2 | $1,282(+2.72k)#26 |
| 3. | Upper Saddle River Borough | $4,001 | $2,101(+1.90k)#3 | $1,282(+2.72k)#39 |
| 4. | Rumson Borough | $4,001 | $2,101(+1.90k)#4 | $1,282(+2.72k)#43 |
| 5. | Richwood | $4,001 | $2,101(+1.90k)#5 | $1,282(+2.72k)#68 |
| 6. | Liberty Corner | $4,001 | $2,101(+1.90k)#6 | $1,282(+2.72k)#112 |
| 7. | Llewellyn Park | $4,001 | $2,101(+1.90k)#7 | $1,282(+2.72k)#151 |
| 8. | Rockleigh Borough | $4,001 | $2,101(+1.90k)#8 | $1,282(+2.72k)#159 |
| 9. | Harlingen | $4,001 | $2,101(+1.90k)#9 | $1,282(+2.72k)#167 |
| 10. | Ho Ho Kus Borough | $3,979 | $2,101(+1.88k)#10 | $1,282(+2.70k)#195 |
| 11. | Essex Fells Borough | $3,932 | $2,101(+1.83k)#11 | $1,282(+2.65k)#198 |
| 12. | Mount Royal | $3,917 | $2,101(+1.82k)#12 | $1,282(+2.63k)#200 |
| 13. | Ridgewood | $3,891 | $2,101(+1.79k)#13 | $1,282(+2.61k)#206 |
| 14. | Westfield | $3,888 | $2,101(+1.79k)#14 | $1,282(+2.61k)#208 |
| 15. | New Vernon | $3,855 | $2,101(+1.75k)#15 | $1,282(+2.57k)#216 |
| 16. | Saddle River Borough | $3,853 | $2,101(+1.75k)#16 | $1,282(+2.57k)#217 |
| 17. | Mendham Borough | $3,843 | $2,101(+1.74k)#17 | $1,282(+2.56k)#221 |
| 18. | Glen Ridge Borough | $3,838 | $2,101(+1.74k)#18 | $1,282(+2.56k)#222 |
| 19. | Franklin Lakes Borough | $3,825 | $2,101(+1.72k)#19 | $1,282(+2.54k)#226 |
| 20. | Ten Mile Run | $3,755 | $2,101(+1.65k)#20 | $1,282(+2.47k)#246 |
| 21. | Alpine Borough | $3,735 | $2,101(+1.63k)#21 | $1,282(+2.45k)#250 |
| 22. | Hoboken | $3,723 | $2,101(+1.62k)#22 | $1,282(+2.44k)#253 |
| 23. | Mountain Lakes Borough | $3,715 | $2,101(+1.61k)#23 | $1,282(+2.43k)#255 |
| 24. | Chatham Borough | $3,704 | $2,101(+1.60k)#24 | $1,282(+2.42k)#257 |
| 25. | Haworth Borough | $3,676 | $2,101(+1.57k)#25 | $1,282(+2.39k)#265 |
| 26. | Cream Ridge | $3,653 | $2,101(+1.55k)#26 | $1,282(+2.37k)#272 |
| 27. | Deans | $3,619 | $2,101(+1.52k)#27 | $1,282(+2.34k)#279 |
| 28. | Belle Mead | $3,618 | $2,101(+1.52k)#28 | $1,282(+2.34k)#281 |
| 29. | Summit | $3,589 | $2,101(+1.49k)#29 | $1,282(+2.31k)#288 |
| 30. | Monroe Manor | $3,577 | $2,101(+1.48k)#30 | $1,282(+2.29k)#293 |
| 31. | Old Tappan Borough | $3,564 | $2,101(+1.46k)#31 | $1,282(+2.28k)#297 |
| 32. | Fair Haven Borough | $3,538 | $2,101(+1.44k)#32 | $1,282(+2.26k)#305 |
| 33. | Cranbury | $3,534 | $2,101(+1.43k)#33 | $1,282(+2.25k)#311 |
| 34. | Tenafly Borough | $3,508 | $2,101(+1.41k)#34 | $1,282(+2.23k)#324 |
| 35. | Blackwells Mills | $3,485 | $2,101(+1.38k)#35 | $1,282(+2.20k)#334 |
| 36. | Lincroft | $3,477 | $2,101(+1.38k)#36 | $1,282(+2.19k)#335 |
| 37. | North Caldwell Borough | $3,465 | $2,101(+1.36k)#37 | $1,282(+2.18k)#343 |
| 38. | Neshanic Station | $3,459 | $2,101(+1.36k)#38 | $1,282(+2.18k)#344 |
| 39. | Woodcliff Lake Borough | $3,428 | $2,101(+1.33k)#39 | $1,282(+2.15k)#356 |
| 40. | Haddonfield Borough | $3,402 | $2,101(+1.30k)#40 | $1,282(+2.12k)#368 |
| 41. | Allendale Borough | $3,381 | $2,101(+1.28k)#41 | $1,282(+2.10k)#381 |
| 42. | Springfield | $3,351 | $2,101(+1.25k)#42 | $1,282(+2.07k)#392 |
| 43. | Demarest Borough | $3,350 | $2,101(+1.25k)#43 | $1,282(+2.07k)#393 |
| 44. | Glen Rock Borough | $3,334 | $2,101(+1.23k)#44 | $1,282(+2.05k)#400 |
| 45. | Bernardsville Borough | $3,332 | $2,101(+1.23k)#45 | $1,282(+2.05k)#403 |
| 46. | Little Silver Borough | $3,331 | $2,101(+1.23k)#46 | $1,282(+2.05k)#404 |
| 47. | East Millstone | $3,305 | $2,101(+1.20k)#47 | $1,282(+2.02k)#415 |
| 48. | Madison Borough | $3,286 | $2,101(+1.19k)#48 | $1,282(+2.00k)#422 |
| 49. | River Edge Borough | $3,273 | $2,101(+1.17k)#49 | $1,282(+1.99k)#429 |
| 50. | Stirling | $3,273 | $2,101(+1.17k)#50 | $1,282(+1.99k)#430 |
| 51. | Princeton | $3,260 | $2,101(+1.16k)#51 | $1,282(+1.98k)#435 |
| 52. | Peapack And Gladstone Borough | $3,218 | $2,101(+1.12k)#52 | $1,282(+1.94k)#464 |
| 53. | Lyons | $3,191 | $2,101(+1.09k)#53 | $1,282(+1.91k)#475 |
| 54. | Caldwell Borough | $3,155 | $2,101(+1.05k)#54 | $1,282(+1.87k)#496 |
| 55. | Kinnelon Borough | $3,151 | $2,101(+1.05k)#55 | $1,282(+1.87k)#502 |
| 56. | Fanwood Borough | $3,150 | $2,101(+1.05k)#56 | $1,282(+1.87k)#503 |
| 57. | Ramsey Borough | $3,140 | $2,101(+1.04k)#57 | $1,282(+1.86k)#509 |
| 58. | Closter Borough | $3,126 | $2,101(+1.02k)#58 | $1,282(+1.84k)#524 |
| 59. | Pines Lake | $3,123 | $2,101(+1.02k)#59 | $1,282(+1.84k)#529 |
| 60. | East Freehold | $3,108 | $2,101(+1.01k)#60 | $1,282(+1.83k)#538 |
| 61. | Rainbow Lakes | $3,108 | $2,101(+1.01k)#61 | $1,282(+1.83k)#540 |
| 62. | Hillsdale Borough | $3,094 | $2,101(+993)#62 | $1,282(+1.81k)#548 |
| 63. | Edgewater Borough | $3,091 | $2,101(+990)#63 | $1,282(+1.81k)#551 |
| 64. | Cresskill Borough | $3,070 | $2,101(+969)#64 | $1,282(+1.79k)#563 |
| 65. | Blawenburg | $3,044 | $2,101(+943)#65 | $1,282(+1.76k)#584 |
| 66. | Oradell Borough | $3,040 | $2,101(+939)#66 | $1,282(+1.76k)#587 |
| 67. | Robbinsville Center | $3,039 | $2,101(+938)#67 | $1,282(+1.76k)#589 |
| 68. | Mountainside Borough | $3,015 | $2,101(+914)#68 | $1,282(+1.73k)#610 |
| 69. | Norwood Borough | $3,011 | $2,101(+910)#69 | $1,282(+1.73k)#615 |
| 70. | Princeton Meadows | $3,006 | $2,101(+905)#70 | $1,282(+1.72k)#623 |
| 71. | Brookside | $2,989 | $2,101(+888)#71 | $1,282(+1.71k)#636 |
| 72. | Deal Borough | $2,988 | $2,101(+887)#72 | $1,282(+1.71k)#638 |
| 73. | Pleasantdale | $2,987 | $2,101(+886)#73 | $1,282(+1.71k)#639 |
| 74. | Far Hills Borough | $2,961 | $2,101(+860)#74 | $1,282(+1.68k)#657 |
| 75. | Montvale Borough | $2,949 | $2,101(+848)#75 | $1,282(+1.67k)#669 |
| 76. | New Providence Borough | $2,947 | $2,101(+846)#76 | $1,282(+1.67k)#671 |
| 77. | Fairview | $2,936 | $2,101(+835)#77 | $1,282(+1.65k)#681 |
| 78. | Brookdale | $2,931 | $2,101(+830)#78 | $1,282(+1.65k)#686 |
| 79. | Packanack Lake | $2,929 | $2,101(+828)#79 | $1,282(+1.65k)#688 |
| 80. | East Rocky Hill | $2,929 | $2,101(+828)#80 | $1,282(+1.65k)#689 |
| 81. | Basking Ridge | $2,928 | $2,101(+827)#81 | $1,282(+1.65k)#690 |
| 82. | Westwood Borough | $2,920 | $2,101(+819)#82 | $1,282(+1.64k)#700 |
| 83. | Dayton | $2,887 | $2,101(+786)#83 | $1,282(+1.60k)#728 |
| 84. | Oakland Borough | $2,883 | $2,101(+782)#84 | $1,282(+1.60k)#733 |
| 85. | Greenwich | $2,874 | $2,101(+773)#85 | $1,282(+1.59k)#741 |
| 86. | Heathcote | $2,872 | $2,101(+771)#86 | $1,282(+1.59k)#744 |
| 87. | Forsgate | $2,872 | $2,101(+771)#87 | $1,282(+1.59k)#745 |
| 88. | Chester Borough | $2,871 | $2,101(+770)#88 | $1,282(+1.59k)#748 |
| 89. | Johnsonburg | $2,871 | $2,101(+770)#89 | $1,282(+1.59k)#749 |
| 90. | Watchung Borough | $2,868 | $2,101(+767)#90 | $1,282(+1.59k)#753 |
| 91. | Shrewsbury Borough | $2,864 | $2,101(+763)#91 | $1,282(+1.58k)#756 |
| 92. | Mantoloking Borough | $2,846 | $2,101(+745)#92 | $1,282(+1.56k)#772 |
| 93. | Leonia Borough | $2,822 | $2,101(+721)#93 | $1,282(+1.54k)#791 |
| 94. | Martinsville | $2,798 | $2,101(+697)#94 | $1,282(+1.52k)#810 |
| 95. | Yorketown | $2,796 | $2,101(+695)#95 | $1,282(+1.51k)#813 |
| 96. | Pine Brook | $2,796 | $2,101(+695)#96 | $1,282(+1.51k)#814 |
| 97. | Harrington Park Borough | $2,796 | $2,101(+695)#97 | $1,282(+1.51k)#815 |
| 98. | Union | $2,794 | $2,101(+693)#98 | $1,282(+1.51k)#819 |
| 99. | Flanders | $2,793 | $2,101(+692)#99 | $1,282(+1.51k)#820 |
| 100. | New Milford Borough | $2,792 | $2,101(+691)#100 | $1,282(+1.51k)#824 |
Common Questions
What are the Top 10 Cities with the Highest Owner-Occupied Median Costs of Housing in New Jersey?
Top 10 Cities with the Highest Owner-Occupied Median Costs of Housing in New Jersey are:
#1
$4,001
#2
$4,001
#3
$4,001
#4
$4,001
#5
$3,891
#6
$3,888
#7
$3,755
#8
$3,723
#9
$3,618
#10
$3,589
What city has the Highest Owner-Occupied Median Costs of Housing in New Jersey?
Short Hills has the Highest Owner-Occupied Median Costs of Housing in New Jersey with $4,001.
What is the Median Renter-Occupied Housing Costs in the State of New Jersey?
Median Renter-Occupied Housing Costs in New Jersey is $2,101.
What is the Median Renter-Occupied Housing Costs in the United States?
Median Renter-Occupied Housing Costs in the United States is $1,282.