Cities with the Largest Honduran Community in New Jersey
RELATED REPORTS & OPTIONS
Honduran
New Jersey
Compare Cities
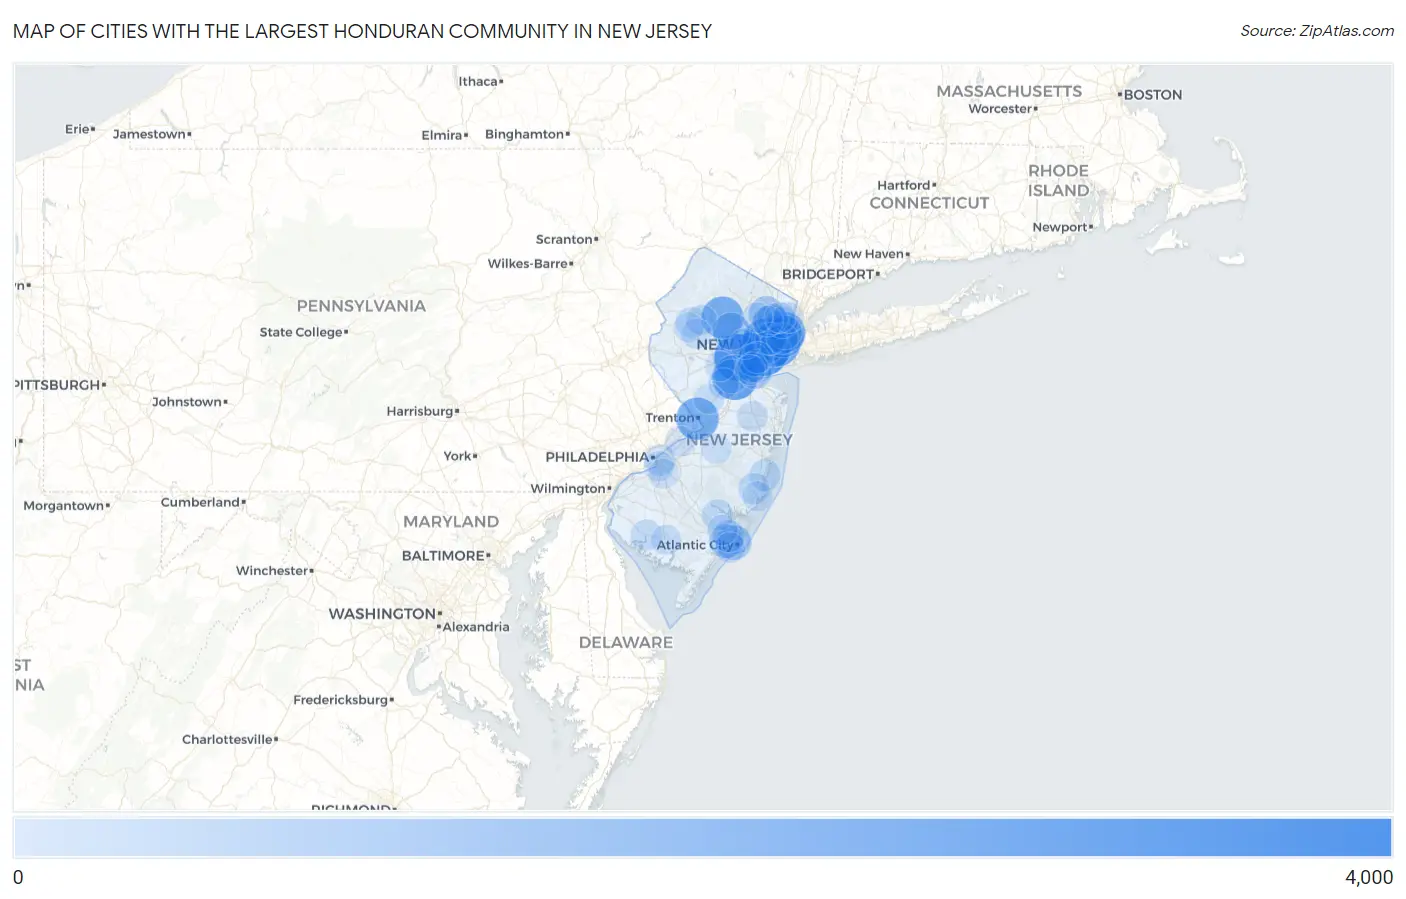
Map of Cities with the Largest Honduran Community in New Jersey
0
4,000
Cities with the Largest Honduran Community in New Jersey
| City | Honduran | vs State | vs National | |
| 1. | Elizabeth | 3,147 | 54,308(5.79%)#1 | 1,068,265(0.29%)#31 |
| 2. | Plainfield | 2,704 | 54,308(4.98%)#2 | 1,068,265(0.25%)#37 |
| 3. | Jersey City | 2,445 | 54,308(4.50%)#3 | 1,068,265(0.23%)#44 |
| 4. | New Brunswick | 2,428 | 54,308(4.47%)#4 | 1,068,265(0.23%)#45 |
| 5. | Newark | 2,419 | 54,308(4.45%)#5 | 1,068,265(0.23%)#46 |
| 6. | Trenton | 1,991 | 54,308(3.67%)#6 | 1,068,265(0.19%)#62 |
| 7. | Union City | 1,987 | 54,308(3.66%)#7 | 1,068,265(0.19%)#63 |
| 8. | Dover | 1,940 | 54,308(3.57%)#8 | 1,068,265(0.18%)#67 |
| 9. | West New York | 1,753 | 54,308(3.23%)#9 | 1,068,265(0.16%)#75 |
| 10. | Morristown | 1,164 | 54,308(2.14%)#10 | 1,068,265(0.11%)#123 |
| 11. | Carteret Borough | 1,141 | 54,308(2.10%)#11 | 1,068,265(0.11%)#127 |
| 12. | Lindenwold Borough | 1,013 | 54,308(1.87%)#12 | 1,068,265(0.09%)#146 |
| 13. | Atlantic City | 852 | 54,308(1.57%)#13 | 1,068,265(0.08%)#177 |
| 14. | Passaic | 845 | 54,308(1.56%)#14 | 1,068,265(0.08%)#180 |
| 15. | Paterson | 832 | 54,308(1.53%)#15 | 1,068,265(0.08%)#183 |
| 16. | South River Borough | 780 | 54,308(1.44%)#16 | 1,068,265(0.07%)#197 |
| 17. | Bayonne | 692 | 54,308(1.27%)#17 | 1,068,265(0.06%)#221 |
| 18. | Lodi Borough | 678 | 54,308(1.25%)#18 | 1,068,265(0.06%)#227 |
| 19. | Pleasantville | 645 | 54,308(1.19%)#19 | 1,068,265(0.06%)#245 |
| 20. | East Franklin | 600 | 54,308(1.10%)#20 | 1,068,265(0.06%)#263 |
| 21. | Guttenberg | 571 | 54,308(1.05%)#21 | 1,068,265(0.05%)#273 |
| 22. | Sayreville Borough | 533 | 54,308(0.98%)#22 | 1,068,265(0.05%)#292 |
| 23. | Port Reading | 523 | 54,308(0.96%)#23 | 1,068,265(0.05%)#297 |
| 24. | Perth Amboy | 474 | 54,308(0.87%)#24 | 1,068,265(0.04%)#329 |
| 25. | Rahway | 419 | 54,308(0.77%)#25 | 1,068,265(0.04%)#390 |
| 26. | North Plainfield Borough | 417 | 54,308(0.77%)#26 | 1,068,265(0.04%)#393 |
| 27. | Harrison | 398 | 54,308(0.73%)#27 | 1,068,265(0.04%)#413 |
| 28. | Kearny | 340 | 54,308(0.63%)#28 | 1,068,265(0.03%)#473 |
| 29. | Absecon | 338 | 54,308(0.62%)#29 | 1,068,265(0.03%)#477 |
| 30. | Little Ferry Borough | 319 | 54,308(0.59%)#30 | 1,068,265(0.03%)#501 |
| 31. | Forked River | 259 | 54,308(0.48%)#31 | 1,068,265(0.02%)#585 |
| 32. | Camden | 239 | 54,308(0.44%)#32 | 1,068,265(0.02%)#630 |
| 33. | Ocean Acres | 236 | 54,308(0.43%)#33 | 1,068,265(0.02%)#634 |
| 34. | Egg Harbor City | 235 | 54,308(0.43%)#34 | 1,068,265(0.02%)#637 |
| 35. | Flanders | 215 | 54,308(0.40%)#35 | 1,068,265(0.02%)#683 |
| 36. | Ridgefield Park | 212 | 54,308(0.39%)#36 | 1,068,265(0.02%)#689 |
| 37. | Bergenfield Borough | 206 | 54,308(0.38%)#37 | 1,068,265(0.02%)#708 |
| 38. | Cedar Knolls | 201 | 54,308(0.37%)#38 | 1,068,265(0.02%)#718 |
| 39. | Milltown Borough | 196 | 54,308(0.36%)#39 | 1,068,265(0.02%)#734 |
| 40. | Linden | 195 | 54,308(0.36%)#40 | 1,068,265(0.02%)#735 |
| 41. | Bridgeton | 194 | 54,308(0.36%)#41 | 1,068,265(0.02%)#738 |
| 42. | Hoboken | 168 | 54,308(0.31%)#42 | 1,068,265(0.02%)#843 |
| 43. | Dumont Borough | 161 | 54,308(0.30%)#43 | 1,068,265(0.02%)#875 |
| 44. | Bound Brook Borough | 155 | 54,308(0.29%)#44 | 1,068,265(0.01%)#903 |
| 45. | Victory Gardens Borough | 155 | 54,308(0.29%)#45 | 1,068,265(0.01%)#904 |
| 46. | Franklin Park | 152 | 54,308(0.28%)#46 | 1,068,265(0.01%)#916 |
| 47. | Fairview Borough | 150 | 54,308(0.28%)#47 | 1,068,265(0.01%)#924 |
| 48. | Paramus Borough | 137 | 54,308(0.25%)#48 | 1,068,265(0.01%)#988 |
| 49. | Englewood | 136 | 54,308(0.25%)#49 | 1,068,265(0.01%)#996 |
| 50. | Manville Borough | 136 | 54,308(0.25%)#50 | 1,068,265(0.01%)#999 |
| 51. | Waldwick Borough | 132 | 54,308(0.24%)#51 | 1,068,265(0.01%)#1,015 |
| 52. | Hackettstown | 128 | 54,308(0.24%)#52 | 1,068,265(0.01%)#1,036 |
| 53. | Caldwell Borough | 127 | 54,308(0.23%)#53 | 1,068,265(0.01%)#1,039 |
| 54. | Garfield | 124 | 54,308(0.23%)#54 | 1,068,265(0.01%)#1,053 |
| 55. | Clifton | 118 | 54,308(0.22%)#55 | 1,068,265(0.01%)#1,092 |
| 56. | West Freehold | 115 | 54,308(0.21%)#56 | 1,068,265(0.01%)#1,110 |
| 57. | Budd Lake | 115 | 54,308(0.21%)#57 | 1,068,265(0.01%)#1,111 |
| 58. | Pomona | 109 | 54,308(0.20%)#58 | 1,068,265(0.01%)#1,146 |
| 59. | Hackensack | 106 | 54,308(0.20%)#59 | 1,068,265(0.01%)#1,164 |
| 60. | Summit | 105 | 54,308(0.19%)#60 | 1,068,265(0.01%)#1,174 |
| 61. | Middlesex Borough | 104 | 54,308(0.19%)#61 | 1,068,265(0.01%)#1,182 |
| 62. | Haddon Heights Borough | 103 | 54,308(0.19%)#62 | 1,068,265(0.01%)#1,189 |
| 63. | Ridgefield Borough | 102 | 54,308(0.19%)#63 | 1,068,265(0.01%)#1,196 |
| 64. | Rockaway Borough | 102 | 54,308(0.19%)#64 | 1,068,265(0.01%)#1,197 |
| 65. | Millville | 97 | 54,308(0.18%)#65 | 1,068,265(0.01%)#1,229 |
| 66. | Rutherford Borough | 94 | 54,308(0.17%)#66 | 1,068,265(0.01%)#1,246 |
| 67. | Lincoln Park Borough | 93 | 54,308(0.17%)#67 | 1,068,265(0.01%)#1,257 |
| 68. | Parsippany | 90 | 54,308(0.17%)#68 | 1,068,265(0.01%)#1,273 |
| 69. | Somerville Borough | 82 | 54,308(0.15%)#69 | 1,068,265(0.01%)#1,344 |
| 70. | Landing | 82 | 54,308(0.15%)#70 | 1,068,265(0.01%)#1,345 |
| 71. | South Plainfield Borough | 78 | 54,308(0.14%)#71 | 1,068,265(0.01%)#1,385 |
| 72. | Netcong Borough | 78 | 54,308(0.14%)#72 | 1,068,265(0.01%)#1,390 |
| 73. | Beverly | 76 | 54,308(0.14%)#73 | 1,068,265(0.01%)#1,408 |
| 74. | Hawthorne Borough | 75 | 54,308(0.14%)#74 | 1,068,265(0.01%)#1,414 |
| 75. | Bogota Borough | 73 | 54,308(0.13%)#75 | 1,068,265(0.01%)#1,431 |
| 76. | Princeton | 69 | 54,308(0.13%)#76 | 1,068,265(0.01%)#1,472 |
| 77. | Ventnor City | 65 | 54,308(0.12%)#77 | 1,068,265(0.01%)#1,523 |
| 78. | Stratford Borough | 64 | 54,308(0.12%)#78 | 1,068,265(0.01%)#1,537 |
| 79. | Gloucester City | 58 | 54,308(0.11%)#79 | 1,068,265(0.01%)#1,611 |
| 80. | Woodbridge | 56 | 54,308(0.10%)#80 | 1,068,265(0.01%)#1,641 |
| 81. | Park Ridge Borough | 56 | 54,308(0.10%)#81 | 1,068,265(0.01%)#1,644 |
| 82. | Spotswood Borough | 56 | 54,308(0.10%)#82 | 1,068,265(0.01%)#1,645 |
| 83. | Singac | 55 | 54,308(0.10%)#83 | 1,068,265(0.01%)#1,666 |
| 84. | Hasbrouck Heights Borough | 54 | 54,308(0.10%)#84 | 1,068,265(0.01%)#1,678 |
| 85. | Long Valley | 53 | 54,308(0.10%)#85 | 1,068,265(0.00%)#1,698 |
| 86. | Wharton Borough | 51 | 54,308(0.09%)#86 | 1,068,265(0.00%)#1,726 |
| 87. | Glendora | 51 | 54,308(0.09%)#87 | 1,068,265(0.00%)#1,728 |
| 88. | Englishtown Borough | 48 | 54,308(0.09%)#88 | 1,068,265(0.00%)#1,781 |
| 89. | Palisades Park Borough | 47 | 54,308(0.09%)#89 | 1,068,265(0.00%)#1,793 |
| 90. | Fort Dix | 46 | 54,308(0.08%)#90 | 1,068,265(0.00%)#1,815 |
| 91. | Ledgewood | 45 | 54,308(0.08%)#91 | 1,068,265(0.00%)#1,836 |
| 92. | Finderne | 44 | 54,308(0.08%)#92 | 1,068,265(0.00%)#1,850 |
| 93. | Manahawkin | 44 | 54,308(0.08%)#93 | 1,068,265(0.00%)#1,852 |
| 94. | Fords | 43 | 54,308(0.08%)#94 | 1,068,265(0.00%)#1,868 |
| 95. | Beattystown | 42 | 54,308(0.08%)#95 | 1,068,265(0.00%)#1,892 |
| 96. | Cliffside Park Borough | 41 | 54,308(0.08%)#96 | 1,068,265(0.00%)#1,914 |
| 97. | Roselle Park Borough | 38 | 54,308(0.07%)#97 | 1,068,265(0.00%)#1,977 |
| 98. | Chatham Borough | 38 | 54,308(0.07%)#98 | 1,068,265(0.00%)#1,981 |
| 99. | Lakehurst Borough | 38 | 54,308(0.07%)#99 | 1,068,265(0.00%)#1,983 |
| 100. | Clementon Borough | 36 | 54,308(0.07%)#100 | 1,068,265(0.00%)#2,032 |
Common Questions
What are the Top 10 Cities with the Largest Honduran Community in New Jersey?
Top 10 Cities with the Largest Honduran Community in New Jersey are:
#1
3,147
#2
2,704
#3
2,445
#4
2,428
#5
2,419
#6
1,991
#7
1,987
#8
1,940
#9
1,753
#10
1,164
What city has the Largest Honduran Community in New Jersey?
Elizabeth has the Largest Honduran Community in New Jersey with 3,147.
What is the Total Honduran Population in the State of New Jersey?
Total Honduran Population in New Jersey is 54,308.
What is the Total Honduran Population in the United States?
Total Honduran Population in the United States is 1,068,265.