Cities with the Most Immigrants from Western Asia in New Jersey
RELATED REPORTS & OPTIONS
Western Asia
New Jersey
Compare Cities
Map of Cities with the Most Immigrants from Western Asia in New Jersey
0
3,000
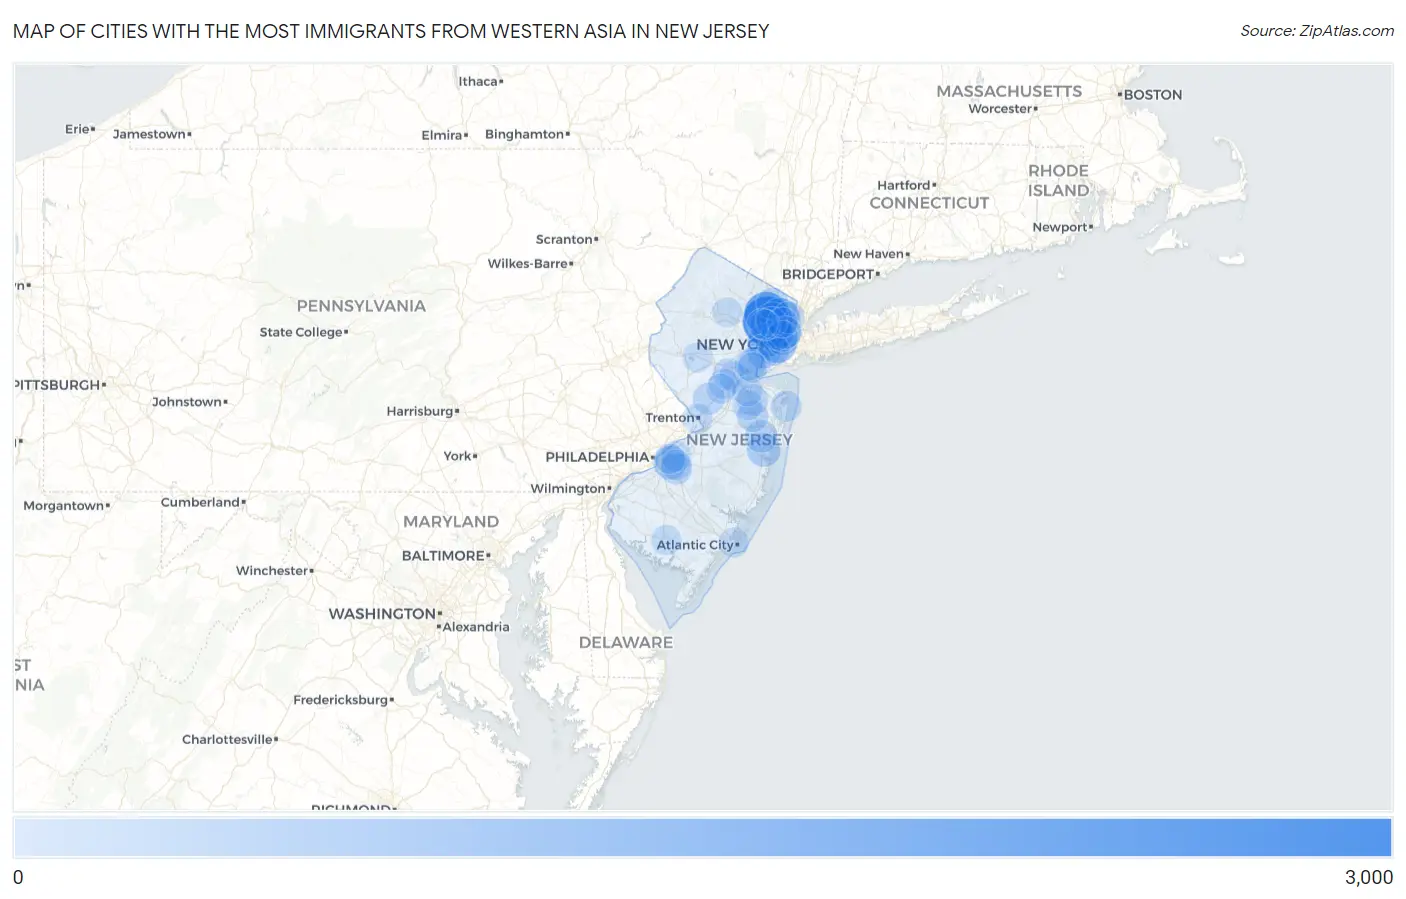
Cities with the Most Immigrants from Western Asia in New Jersey
| City | Western Asia | vs State | vs National | |
| 1. | Clifton | 2,567 | 55,103(4.66%)#1 | 1,204,112(0.21%)#44 |
| 2. | Paterson | 1,807 | 55,103(3.28%)#2 | 1,204,112(0.15%)#69 |
| 3. | Hackensack | 1,188 | 55,103(2.16%)#3 | 1,204,112(0.10%)#116 |
| 4. | Fort Lee Borough | 1,144 | 55,103(2.08%)#4 | 1,204,112(0.10%)#124 |
| 5. | Jersey City | 1,121 | 55,103(2.03%)#5 | 1,204,112(0.09%)#126 |
| 6. | Woodland Park Borough | 939 | 55,103(1.70%)#6 | 1,204,112(0.08%)#164 |
| 7. | Fair Lawn Borough | 871 | 55,103(1.58%)#7 | 1,204,112(0.07%)#178 |
| 8. | Preakness | 806 | 55,103(1.46%)#8 | 1,204,112(0.07%)#197 |
| 9. | Paramus Borough | 782 | 55,103(1.42%)#9 | 1,204,112(0.06%)#203 |
| 10. | Cliffside Park Borough | 767 | 55,103(1.39%)#10 | 1,204,112(0.06%)#209 |
| 11. | Cresskill Borough | 759 | 55,103(1.38%)#11 | 1,204,112(0.06%)#211 |
| 12. | Newark | 636 | 55,103(1.15%)#12 | 1,204,112(0.05%)#264 |
| 13. | Elizabeth | 577 | 55,103(1.05%)#13 | 1,204,112(0.05%)#293 |
| 14. | Tenafly Borough | 558 | 55,103(1.01%)#14 | 1,204,112(0.05%)#301 |
| 15. | Toms River | 514 | 55,103(0.93%)#15 | 1,204,112(0.04%)#326 |
| 16. | Ellisburg | 499 | 55,103(0.91%)#16 | 1,204,112(0.04%)#338 |
| 17. | Garfield | 446 | 55,103(0.81%)#17 | 1,204,112(0.04%)#383 |
| 18. | Hillsborough | 431 | 55,103(0.78%)#18 | 1,204,112(0.04%)#403 |
| 19. | Hoboken | 413 | 55,103(0.75%)#19 | 1,204,112(0.03%)#421 |
| 20. | New Milford Borough | 407 | 55,103(0.74%)#20 | 1,204,112(0.03%)#427 |
| 21. | Demarest Borough | 390 | 55,103(0.71%)#21 | 1,204,112(0.03%)#450 |
| 22. | Guttenberg | 387 | 55,103(0.70%)#22 | 1,204,112(0.03%)#454 |
| 23. | West New York | 378 | 55,103(0.69%)#23 | 1,204,112(0.03%)#459 |
| 24. | Lakewood | 369 | 55,103(0.67%)#24 | 1,204,112(0.03%)#473 |
| 25. | Elmwood Park Borough | 366 | 55,103(0.66%)#25 | 1,204,112(0.03%)#478 |
| 26. | Secaucus | 335 | 55,103(0.61%)#26 | 1,204,112(0.03%)#520 |
| 27. | North Arlington Borough | 313 | 55,103(0.57%)#27 | 1,204,112(0.03%)#554 |
| 28. | East Rutherford Borough | 313 | 55,103(0.57%)#28 | 1,204,112(0.03%)#555 |
| 29. | Franklin Lakes Borough | 311 | 55,103(0.56%)#29 | 1,204,112(0.03%)#558 |
| 30. | Ridgewood | 307 | 55,103(0.56%)#30 | 1,204,112(0.03%)#562 |
| 31. | Edgewater Borough | 303 | 55,103(0.55%)#31 | 1,204,112(0.03%)#570 |
| 32. | Princeton | 298 | 55,103(0.54%)#32 | 1,204,112(0.02%)#579 |
| 33. | Totowa Borough | 285 | 55,103(0.52%)#33 | 1,204,112(0.02%)#608 |
| 34. | Englewood | 281 | 55,103(0.51%)#34 | 1,204,112(0.02%)#616 |
| 35. | Glen Rock Borough | 281 | 55,103(0.51%)#35 | 1,204,112(0.02%)#617 |
| 36. | Avenel | 265 | 55,103(0.48%)#36 | 1,204,112(0.02%)#658 |
| 37. | Hawthorne Borough | 261 | 55,103(0.47%)#37 | 1,204,112(0.02%)#669 |
| 38. | Washington Borough | 259 | 55,103(0.47%)#38 | 1,204,112(0.02%)#673 |
| 39. | Closter Borough | 257 | 55,103(0.47%)#39 | 1,204,112(0.02%)#680 |
| 40. | Springdale | 255 | 55,103(0.46%)#40 | 1,204,112(0.02%)#683 |
| 41. | Robertsville | 245 | 55,103(0.44%)#41 | 1,204,112(0.02%)#712 |
| 42. | Bayonne | 241 | 55,103(0.44%)#42 | 1,204,112(0.02%)#722 |
| 43. | Dumont Borough | 239 | 55,103(0.43%)#43 | 1,204,112(0.02%)#728 |
| 44. | West Freehold | 236 | 55,103(0.43%)#44 | 1,204,112(0.02%)#732 |
| 45. | New Brunswick | 234 | 55,103(0.42%)#45 | 1,204,112(0.02%)#741 |
| 46. | Lodi Borough | 234 | 55,103(0.42%)#46 | 1,204,112(0.02%)#742 |
| 47. | Sayreville Borough | 218 | 55,103(0.40%)#47 | 1,204,112(0.02%)#780 |
| 48. | Bergenfield Borough | 217 | 55,103(0.39%)#48 | 1,204,112(0.02%)#789 |
| 49. | Somerset | 216 | 55,103(0.39%)#49 | 1,204,112(0.02%)#794 |
| 50. | Bloomingdale Borough | 213 | 55,103(0.39%)#50 | 1,204,112(0.02%)#803 |
| 51. | Leonia Borough | 206 | 55,103(0.37%)#51 | 1,204,112(0.02%)#820 |
| 52. | Rutherford Borough | 204 | 55,103(0.37%)#52 | 1,204,112(0.02%)#824 |
| 53. | Keansburg Borough | 200 | 55,103(0.36%)#53 | 1,204,112(0.02%)#840 |
| 54. | Passaic | 199 | 55,103(0.36%)#54 | 1,204,112(0.02%)#841 |
| 55. | Long Branch | 197 | 55,103(0.36%)#55 | 1,204,112(0.02%)#849 |
| 56. | Ridgefield Borough | 196 | 55,103(0.36%)#56 | 1,204,112(0.02%)#853 |
| 57. | Palisades Park Borough | 189 | 55,103(0.34%)#57 | 1,204,112(0.02%)#876 |
| 58. | Glassboro Borough | 185 | 55,103(0.34%)#58 | 1,204,112(0.02%)#888 |
| 59. | Union City | 175 | 55,103(0.32%)#59 | 1,204,112(0.01%)#927 |
| 60. | Milltown Borough | 166 | 55,103(0.30%)#60 | 1,204,112(0.01%)#962 |
| 61. | Fairview Borough | 163 | 55,103(0.30%)#61 | 1,204,112(0.01%)#980 |
| 62. | Moorestown Lenola | 163 | 55,103(0.30%)#62 | 1,204,112(0.01%)#981 |
| 63. | Iselin | 161 | 55,103(0.29%)#63 | 1,204,112(0.01%)#993 |
| 64. | Jamesburg Borough | 156 | 55,103(0.28%)#64 | 1,204,112(0.01%)#1,011 |
| 65. | North Caldwell Borough | 155 | 55,103(0.28%)#65 | 1,204,112(0.01%)#1,016 |
| 66. | Englewood Cliffs Borough | 155 | 55,103(0.28%)#66 | 1,204,112(0.01%)#1,017 |
| 67. | Hasbrouck Heights Borough | 149 | 55,103(0.27%)#67 | 1,204,112(0.01%)#1,047 |
| 68. | Paulsboro Borough | 146 | 55,103(0.26%)#68 | 1,204,112(0.01%)#1,060 |
| 69. | Maywood Borough | 142 | 55,103(0.26%)#69 | 1,204,112(0.01%)#1,080 |
| 70. | Prospect Park Borough | 139 | 55,103(0.25%)#70 | 1,204,112(0.01%)#1,094 |
| 71. | Trenton | 137 | 55,103(0.25%)#71 | 1,204,112(0.01%)#1,104 |
| 72. | Greentree | 136 | 55,103(0.25%)#72 | 1,204,112(0.01%)#1,117 |
| 73. | Roselle Park Borough | 134 | 55,103(0.24%)#73 | 1,204,112(0.01%)#1,135 |
| 74. | Highland Park Borough | 133 | 55,103(0.24%)#74 | 1,204,112(0.01%)#1,139 |
| 75. | Riverdale Borough | 130 | 55,103(0.24%)#75 | 1,204,112(0.01%)#1,157 |
| 76. | Yorketown | 121 | 55,103(0.22%)#76 | 1,204,112(0.01%)#1,225 |
| 77. | Westwood Borough | 112 | 55,103(0.20%)#77 | 1,204,112(0.01%)#1,286 |
| 78. | Millville | 111 | 55,103(0.20%)#78 | 1,204,112(0.01%)#1,295 |
| 79. | Park Ridge Borough | 110 | 55,103(0.20%)#79 | 1,204,112(0.01%)#1,306 |
| 80. | Pines Lake | 109 | 55,103(0.20%)#80 | 1,204,112(0.01%)#1,323 |
| 81. | Brookdale | 108 | 55,103(0.20%)#81 | 1,204,112(0.01%)#1,328 |
| 82. | Saddle River Borough | 107 | 55,103(0.19%)#82 | 1,204,112(0.01%)#1,339 |
| 83. | Franklin Park | 104 | 55,103(0.19%)#83 | 1,204,112(0.01%)#1,360 |
| 84. | Oradell Borough | 99 | 55,103(0.18%)#84 | 1,204,112(0.01%)#1,391 |
| 85. | White House Station | 96 | 55,103(0.17%)#85 | 1,204,112(0.01%)#1,414 |
| 86. | Kinnelon Borough | 95 | 55,103(0.17%)#86 | 1,204,112(0.01%)#1,423 |
| 87. | Cherry Hill Mall | 94 | 55,103(0.17%)#87 | 1,204,112(0.01%)#1,433 |
| 88. | Woodbridge | 93 | 55,103(0.17%)#88 | 1,204,112(0.01%)#1,441 |
| 89. | Eatontown Borough | 93 | 55,103(0.17%)#89 | 1,204,112(0.01%)#1,445 |
| 90. | North Haledon Borough | 93 | 55,103(0.17%)#90 | 1,204,112(0.01%)#1,446 |
| 91. | Madison Borough | 92 | 55,103(0.17%)#91 | 1,204,112(0.01%)#1,451 |
| 92. | Manville Borough | 92 | 55,103(0.17%)#92 | 1,204,112(0.01%)#1,452 |
| 93. | White Meadow Lake | 92 | 55,103(0.17%)#93 | 1,204,112(0.01%)#1,453 |
| 94. | Carlstadt Borough | 91 | 55,103(0.17%)#94 | 1,204,112(0.01%)#1,463 |
| 95. | Old Bridge | 90 | 55,103(0.16%)#95 | 1,204,112(0.01%)#1,470 |
| 96. | Ridgefield Park | 87 | 55,103(0.16%)#96 | 1,204,112(0.01%)#1,506 |
| 97. | Upper Montclair | 87 | 55,103(0.16%)#97 | 1,204,112(0.01%)#1,508 |
| 98. | Upper Saddle River Borough | 86 | 55,103(0.16%)#98 | 1,204,112(0.01%)#1,521 |
| 99. | Atlantic City | 85 | 55,103(0.15%)#99 | 1,204,112(0.01%)#1,526 |
| 100. | Kendall Park | 85 | 55,103(0.15%)#100 | 1,204,112(0.01%)#1,531 |
Common Questions
What are the Top 10 Cities with the Most Immigrants from Western Asia in New Jersey?
Top 10 Cities with the Most Immigrants from Western Asia in New Jersey are:
#1
2,567
#2
1,807
#3
1,188
#4
1,121
#5
636
#6
577
#7
514
#8
499
#9
446
#10
413
What city has the Most Immigrants from Western Asia in New Jersey?
Clifton has the Most Immigrants from Western Asia in New Jersey with 2,567.
What is the Total Immigrants from Western Asia in the State of New Jersey?
Total Immigrants from Western Asia in New Jersey is 55,103.
What is the Total Immigrants from Western Asia in the United States?
Total Immigrants from Western Asia in the United States is 1,204,112.