Cities with the Fewest Births per 1,000 Teenage Women Under the Age of 20 in New Jersey

RELATED REPORTS & OPTIONS

Lowest Birth Rate | Women 15-19
Population
Families and Households
Female Fertility
Female Fertility (Unmarried)
Race (Community Size)
Race (Percentage)
Ancestry (Community Size)
AfghanAfricanAlaska NativeAlaskan AthabascanAlbanianAleutAlsatianAmericanApacheArabArapahoArgentineanArmenianAssyrian / Chaldean / SyriacAustralianAustrianBahamianBangladeshiBarbadianBasqueBelgianBelizeanBermudanBhutaneseBlackfeetBolivianBrazilianBritishBritish West IndianBulgarianBurmeseCajunCambodianCanadianCape VerdeanCarpatho RusynCelticCentral AmericanCentral American IndianCherokeeCheyenneChickasawChileanChineseChippewaChoctawColombianColvilleComancheCosta RicanCreeCreekCroatianCrowCubanCypriotCzechCzechoslovakianDanishDelawareDominicanDutchDutch West IndianEastern EuropeanEcuadorianEgyptianEnglishEstonianEthiopianEuropeanFijianFilipinoFinnishFrenchFrench American IndianFrench CanadianGermanGerman RussianGhanaianGreekGuamanian / ChamorroGuatemalanGuyaneseHaitianHmongHonduranHopiHoumaHungarianIcelanderIndian (Asian)IndonesianInupiatIranianIraqiIrishIroquoisIsraeliItalianJamaicanJapaneseJordanianKenyanKiowaKoreanLaotianLatvianLebaneseLiberianLithuanianLumbeeLuxembourgerMacedonianMalaysianMalteseMarshalleseMenomineeMexicanMexican American IndianMongolianMoroccanNative HawaiianNavajoNepaleseNew ZealanderNicaraguanNigerianNorthern EuropeanNorwegianOkinawanOsageOttawaPaiutePakistaniPalestinianPanamanianParaguayanPennsylvania GermanPeruvianPimaPolishPortuguesePotawatomiPuebloPuerto RicanPuget Sound SalishRomanianRussianSalvadoranSamoanScandinavianScotch-IrishScottishSeminoleSenegaleseSerbianShoshoneSierra LeoneanSiouxSlavicSlovakSloveneSomaliSouth AfricanSouth AmericanSouth American IndianSoviet UnionSpaniardSpanishSpanish AmericanSpanish American IndianSri LankanSubsaharan AfricanSudaneseSwedishSwissSyrianTaiwaneseThaiTlingit-HaidaTohono O'OdhamTonganTrinidadian and TobagonianTsimshianTurkishU.S. Virgin IslanderUgandanUkrainianUruguayanUteVenezuelanVietnameseWelshWest IndianYakamaYaquiYugoslavianYumanYup'ikZimbabwean
Ancestry (Percentage)
AfghanAfricanAlaska NativeAlaskan AthabascanAlbanianAleutAlsatianAmericanApacheArabArapahoArgentineanArmenianAssyrian / Chaldean / SyriacAustralianAustrianBahamianBangladeshiBarbadianBasqueBelgianBelizeanBermudanBhutaneseBlackfeetBolivianBrazilianBritishBritish West IndianBulgarianBurmeseCajunCambodianCanadianCape VerdeanCarpatho RusynCelticCentral AmericanCentral American IndianCherokeeCheyenneChickasawChileanChineseChippewaChoctawColombianColvilleComancheCosta RicanCreeCreekCroatianCrowCubanCypriotCzechCzechoslovakianDanishDelawareDominicanDutchDutch West IndianEastern EuropeanEcuadorianEgyptianEnglishEstonianEthiopianEuropeanFijianFilipinoFinnishFrenchFrench American IndianFrench CanadianGermanGerman RussianGhanaianGreekGuamanian / ChamorroGuatemalanGuyaneseHaitianHmongHonduranHopiHoumaHungarianIcelanderIndian (Asian)IndonesianInupiatIranianIraqiIrishIroquoisIsraeliItalianJamaicanJapaneseJordanianKenyanKiowaKoreanLaotianLatvianLebaneseLiberianLithuanianLumbeeLuxembourgerMacedonianMalaysianMalteseMarshalleseMenomineeMexicanMexican American IndianMongolianMoroccanNative HawaiianNavajoNepaleseNew ZealanderNicaraguanNigerianNorthern EuropeanNorwegianOkinawanOsageOttawaPaiutePakistaniPalestinianPanamanianParaguayanPennsylvania GermanPeruvianPimaPolishPortuguesePotawatomiPuebloPuerto RicanPuget Sound SalishRomanianRussianSalvadoranSamoanScandinavianScotch-IrishScottishSeminoleSenegaleseSerbianShoshoneSierra LeoneanSiouxSlavicSlovakSloveneSomaliSouth AfricanSouth AmericanSouth American IndianSoviet UnionSpaniardSpanishSpanish AmericanSpanish American IndianSri LankanSubsaharan AfricanSudaneseSwedishSwissSyrianTaiwaneseThaiTlingit-HaidaTohono O'OdhamTonganTrinidadian and TobagonianTsimshianTurkishU.S. Virgin IslanderUgandanUkrainianUruguayanUteVenezuelanVietnameseWelshWest IndianYakamaYaquiYugoslavianYumanYup'ikZimbabwean
Immigrant Origin (Total)
AfghanistanAfricaAlbaniaArgentinaArmeniaAsiaAustraliaAustriaAzoresBahamasBangladeshBarbadosBelarusBelgiumBelizeBoliviaBosnia and HerzegovinaBrazilBulgariaBurma / MyanmarCabo VerdeCambodiaCameroonCanadaCaribbeanCentral AmericaChileChinaColombiaCongoCosta RicaCroatiaCubaCzechoslovakiaDenmarkDominicaDominican RepublicEastern AfricaEastern AsiaEastern EuropeEcuadorEgyptEl SalvadorEnglandEritreaEthiopiaEuropeFijiFranceGermanyGhanaGreeceGrenadaGuatemalaGuyanaHaitiHondurasHong KongHungaryIndiaIndonesiaIranIraqIrelandIsraelItalyJamaicaJapanJordanKazakhstanKenyaKoreaKuwaitLaosLatin AmericaLatviaLebanonLiberiaLithuaniaMalaysiaMexicoMicronesiaMiddle AfricaMoldovaMoroccoNepalNetherlandsNicaraguaNigeriaNorth MacedoniaNorthern AfricaNorthern EuropeNorwayOceaniaPakistanPanamaPeruPhilippinesPolandPortugalRomaniaRussiaSaudi ArabiaScotlandSenegalSerbiaSierra LeoneSingaporeSomaliaSouth AfricaSouth AmericaSouth Central AsiaSouth Eastern AsiaSouthern EuropeSpainSri LankaSt. Vincent and the GrenadinesSudanSwedenSwitzerlandSyriaTaiwanThailandTrinidad and TobagoTurkeyUgandaUkraineUruguayUzbekistanVenezuelaVietnamWest IndiesWestern AfricaWestern AsiaWestern EuropeYemenZaireZimbabwe
Immigrant Origin (Percentage)
AfghanistanAfricaAlbaniaArgentinaArmeniaAsiaAustraliaAustriaAzoresBahamasBangladeshBarbadosBelarusBelgiumBelizeBoliviaBosnia and HerzegovinaBrazilBulgariaBurma / MyanmarCabo VerdeCambodiaCameroonCanadaCaribbeanCentral AmericaChileChinaColombiaCongoCosta RicaCroatiaCubaCzechoslovakiaDenmarkDominicaDominican RepublicEastern AfricaEastern AsiaEastern EuropeEcuadorEgyptEl SalvadorEnglandEritreaEthiopiaEuropeFijiFranceGermanyGhanaGreeceGrenadaGuatemalaGuyanaHaitiHondurasHong KongHungaryIndiaIndonesiaIranIraqIrelandIsraelItalyJamaicaJapanJordanKazakhstanKenyaKoreaKuwaitLaosLatin AmericaLatviaLebanonLiberiaLithuaniaMalaysiaMexicoMicronesiaMiddle AfricaMoldovaMoroccoNepalNetherlandsNicaraguaNigeriaNorth MacedoniaNorthern AfricaNorthern EuropeNorwayOceaniaPakistanPanamaPeruPhilippinesPolandPortugalRomaniaRussiaSaudi ArabiaScotlandSenegalSerbiaSierra LeoneSingaporeSomaliaSouth AfricaSouth AmericaSouth Central AsiaSouth Eastern AsiaSouthern EuropeSpainSri LankaSt. Vincent and the GrenadinesSudanSwedenSwitzerlandSyriaTaiwanThailandTrinidad and TobagoTurkeyUgandaUkraineUruguayUzbekistanVenezuelaVietnamWest IndiesWestern AfricaWestern AsiaWestern EuropeYemenZaireZimbabwe
Income
Income (Families)
Income (Households)
Poverty
Poverty (Families)
Unemployment
Employment Occupations
Employment Industries
Employer Class
Commute Time
Commute Means
School Enrollment
Education by Degree Field
Occupancy
Finances
Physical Characteristics
New Jersey
Compare Cities
Comparison Subject

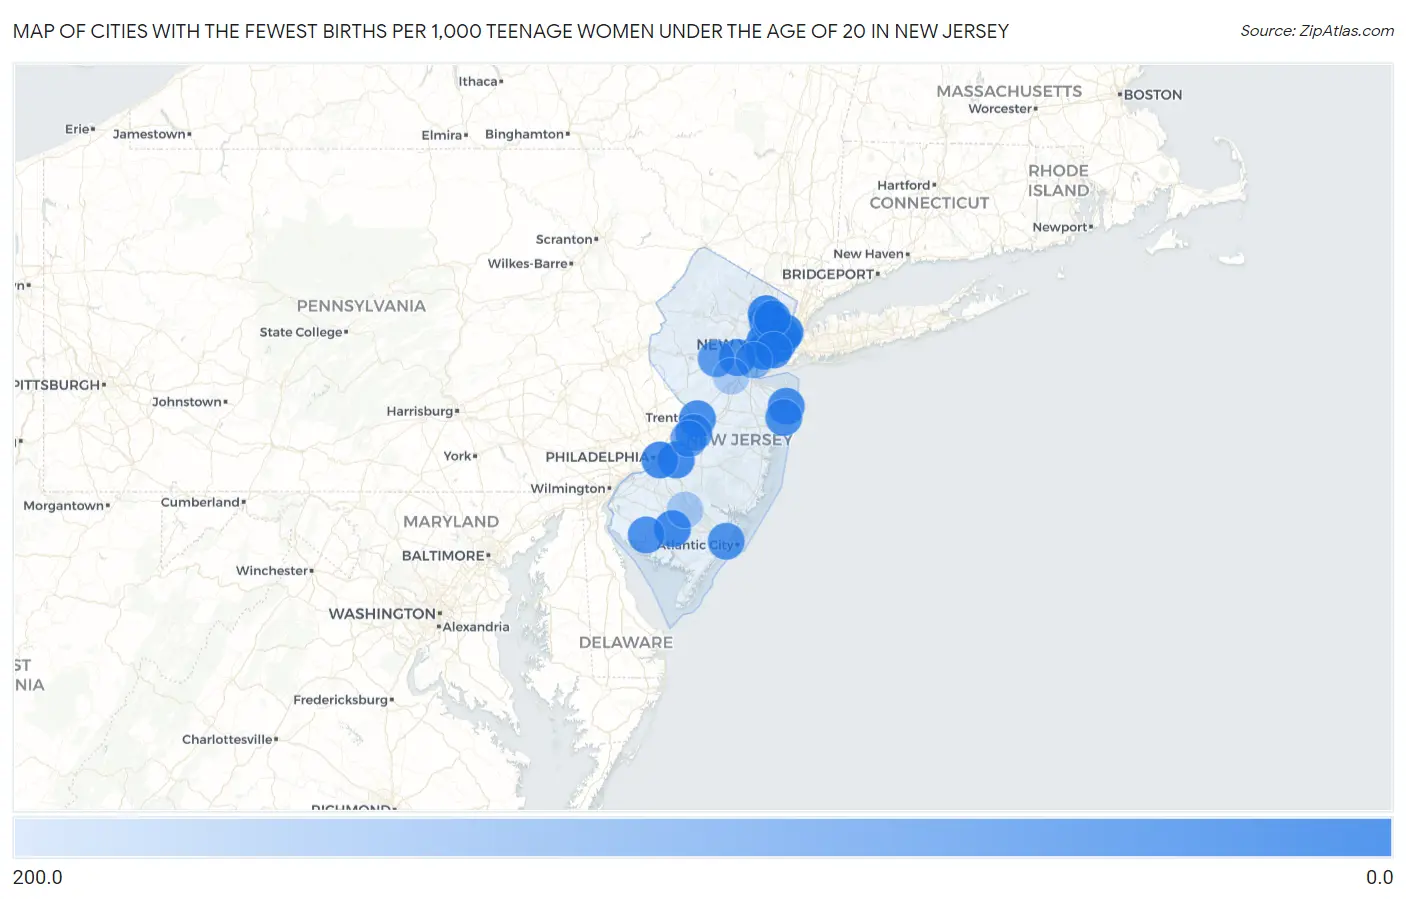
Map of Cities with the Fewest Births per 1,000 Teenage Women Under the Age of 20 in New Jersey

200.0
0.0
Cities with the Fewest Births per 1,000 Teenage Women Under the Age of 20 in New Jersey Map

Cities with the Fewest Births per 1,000 Teenage Women Under the Age of 20 in New Jersey

City Births / 1,000 Women vs State vs National
1.Clifton3.05.0(-2.00)#110.0(-7.00)#73
2.Elizabeth5.05.0(=0.000)#210.0(-5.00)#152
3.Union City5.05.0(=0.000)#310.0(-5.00)#165
4.Sicklerville5.05.0(=0.000)#410.0(-5.00)#170
5.Jersey City8.05.0(+3.00)#510.0(-2.00)#266
6.Paterson12.05.0(+7.00)#610.0(+2.00)#432
7.Newark14.05.0(+9.00)#710.0(+4.00)#488
8.Vineland14.05.0(+9.00)#810.0(+4.00)#501
9.Passaic15.05.0(+10.00)#910.0(+5.00)#538
10.Ramblewood17.05.0(+12.0)#1010.0(+7.00)#615
11.West New York19.05.0(+14.0)#1110.0(+9.00)#657
12.Camden22.05.0(+17.0)#1210.0(+12.0)#721
13.Plainfield23.05.0(+18.0)#1310.0(+13.0)#752
14.Gibbsboro Borough24.05.0(+19.0)#1410.0(+14.0)#799
15.Trenton27.05.0(+22.0)#1510.0(+17.0)#849
16.Long Branch27.05.0(+22.0)#1610.0(+17.0)#860
17.Garfield31.05.0(+26.0)#1710.0(+21.0)#936
18.Stockton University34.05.0(+29.0)#1810.0(+24.0)#991
19.Bridgeton35.05.0(+30.0)#1910.0(+25.0)#1,004
20.Bayonne37.05.0(+32.0)#2010.0(+27.0)#1,039
21.Asbury Park37.05.0(+32.0)#2110.0(+27.0)#1,043
22.Pleasantville39.05.0(+34.0)#2210.0(+29.0)#1,072
23.Florence42.05.0(+37.0)#2310.0(+32.0)#1,109
24.North Plainfield Borough43.05.0(+38.0)#2410.0(+33.0)#1,115
25.Elmer Borough45.05.0(+40.0)#2510.0(+35.0)#1,160
26.Middlesex Borough52.05.0(+47.0)#2610.0(+42.0)#1,229
27.Green Knoll53.05.0(+48.0)#2710.0(+43.0)#1,240
28.Leonia Borough54.05.0(+49.0)#2810.0(+44.0)#1,255
29.Lindenwold Borough60.05.0(+55.0)#2910.0(+50.0)#1,299
30.New Milford Borough71.05.0(+66.0)#3010.0(+61.0)#1,401
31.Burlington76.05.0(+71.0)#3110.0(+66.0)#1,433
32.Laurel Springs Borough86.05.0(+81.0)#3210.0(+76.0)#1,512
33.Woodlynne Borough87.05.0(+82.0)#3310.0(+77.0)#1,520
34.Rahway100.05.0(+95.0)#3410.0(+90.0)#1,590
35.Collings Lakes160.05.0(+155)#3510.0(+150)#1,881
36.East Franklin166.05.0(+161)#3610.0(+156)#1,895
37.Roosevelt Borough183.05.0(+178)#3710.0(+173)#1,951

Common Questions

What are the Top 10 Cities with the Fewest Births per 1,000 Teenage Women Under the Age of 20 in New Jersey?
Top 10 Cities with the Fewest Births per 1,000 Teenage Women Under the Age of 20 in New Jersey are:
What city has the Fewest Births per 1,000 Teenage Women Under the Age of 20 in New Jersey?
Clifton has the Fewest Births per 1,000 Teenage Women Under the Age of 20 in New Jersey with 3.0.
What is the Number of Births per 1,000 Teenage Women Under the Age of 20 in the State of New Jersey?
Number of Births per 1,000 Teenage Women Under the Age of 20 in New Jersey is 5.0.
What is the Number of Births per 1,000 Teenage Women Under the Age of 20 in the United States?
Number of Births per 1,000 Teenage Women Under the Age of 20 in the United States is 10.0.