Cities with the Highest Percentage of Population Employed in Cleaning & Maintenance in New Jersey
RELATED REPORTS & OPTIONS
Cleaning & Maintenance
New Jersey
Compare Cities
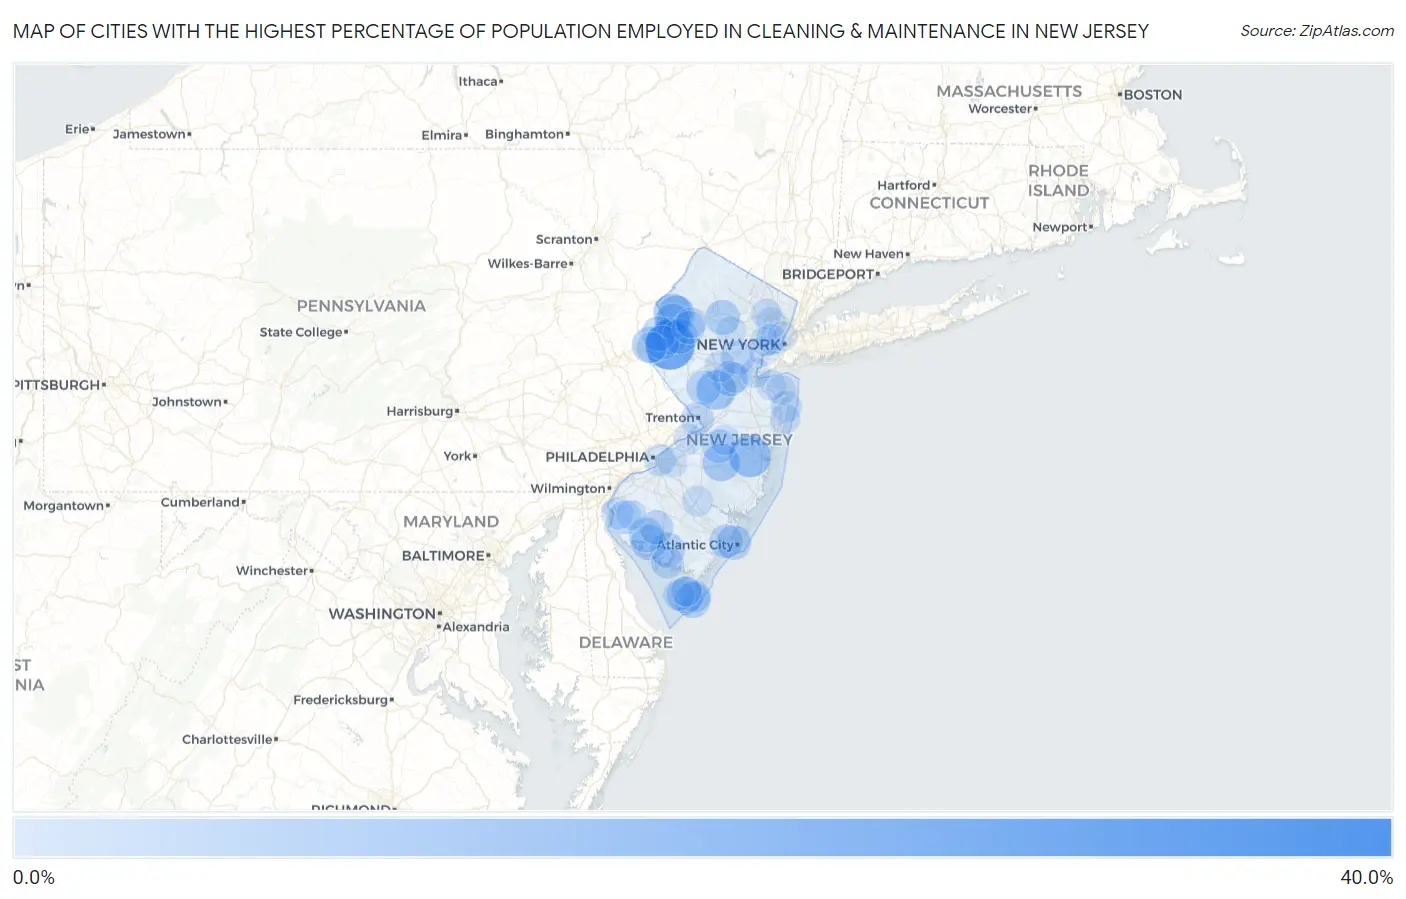
Map of Cities with the Highest Percentage of Population Employed in Cleaning & Maintenance in New Jersey
0.0%
40.0%
Cities with the Highest Percentage of Population Employed in Cleaning & Maintenance in New Jersey
| City | % Employed | vs State | vs National | |
| 1. | Windsor | 38.5% | 3.1%(+35.4)#1 | 3.5%(+35.0)#153 |
| 2. | Dorchester | 28.6% | 3.1%(+25.5)#2 | 3.5%(+25.1)#297 |
| 3. | Asbury | 28.4% | 3.1%(+25.4)#3 | 3.5%(+24.9)#306 |
| 4. | Pine Ridge At Crestwood | 19.4% | 3.1%(+16.3)#4 | 3.5%(+15.9)#676 |
| 5. | East Rocky Hill | 16.6% | 3.1%(+13.5)#5 | 3.5%(+13.1)#916 |
| 6. | Mount Hermon | 14.8% | 3.1%(+11.7)#6 | 3.5%(+11.3)#1,149 |
| 7. | Presidential Lakes Estates | 14.6% | 3.1%(+11.5)#7 | 3.5%(+11.1)#1,190 |
| 8. | Flemington Borough | 14.2% | 3.1%(+11.2)#8 | 3.5%(+10.7)#1,257 |
| 9. | Arrowhead Lake | 14.0% | 3.1%(+11.0)#9 | 3.5%(+10.6)#1,289 |
| 10. | Hope | 13.5% | 3.1%(+10.4)#10 | 3.5%(+10.0)#1,411 |
| 11. | Brass Castle | 13.0% | 3.1%(+9.98)#11 | 3.5%(+9.56)#1,521 |
| 12. | Heislerville | 13.0% | 3.1%(+9.98)#12 | 3.5%(+9.56)#1,528 |
| 13. | Delaware Park | 12.8% | 3.1%(+9.74)#13 | 3.5%(+9.33)#1,606 |
| 14. | Rio Grande | 12.6% | 3.1%(+9.53)#14 | 3.5%(+9.12)#1,664 |
| 15. | Wildwood | 12.5% | 3.1%(+9.42)#15 | 3.5%(+9.00)#1,707 |
| 16. | Harrisonville | 12.4% | 3.1%(+9.37)#16 | 3.5%(+8.95)#1,721 |
| 17. | West Wildwood Borough | 12.3% | 3.1%(+9.19)#17 | 3.5%(+8.78)#1,772 |
| 18. | Fairton | 11.9% | 3.1%(+8.87)#18 | 3.5%(+8.45)#1,881 |
| 19. | Mountain Lake | 11.7% | 3.1%(+8.65)#19 | 3.5%(+8.24)#1,941 |
| 20. | Anderson | 11.7% | 3.1%(+8.61)#20 | 3.5%(+8.19)#1,955 |
| 21. | New Gretna | 11.7% | 3.1%(+8.58)#21 | 3.5%(+8.17)#1,965 |
| 22. | Dover | 11.6% | 3.1%(+8.50)#22 | 3.5%(+8.08)#1,984 |
| 23. | Laurel Lake | 11.4% | 3.1%(+8.38)#23 | 3.5%(+7.96)#2,029 |
| 24. | Voorhees | 11.4% | 3.1%(+8.37)#24 | 3.5%(+7.95)#2,032 |
| 25. | Atlantic City | 11.3% | 3.1%(+8.24)#25 | 3.5%(+7.83)#2,093 |
| 26. | Millstone Borough | 11.2% | 3.1%(+8.14)#26 | 3.5%(+7.72)#2,128 |
| 27. | Bridgeton | 11.2% | 3.1%(+8.12)#27 | 3.5%(+7.70)#2,135 |
| 28. | Hutchinson | 11.0% | 3.1%(+7.89)#28 | 3.5%(+7.48)#2,223 |
| 29. | Wharton Borough | 10.9% | 3.1%(+7.86)#29 | 3.5%(+7.44)#2,239 |
| 30. | East Newark Borough | 10.8% | 3.1%(+7.73)#30 | 3.5%(+7.31)#2,286 |
| 31. | Lower Berkshire Valley | 10.7% | 3.1%(+7.67)#31 | 3.5%(+7.26)#2,306 |
| 32. | Skillman | 10.5% | 3.1%(+7.43)#32 | 3.5%(+7.01)#2,402 |
| 33. | Rosenhayn | 10.4% | 3.1%(+7.34)#33 | 3.5%(+6.93)#2,449 |
| 34. | Cologne | 10.3% | 3.1%(+7.24)#34 | 3.5%(+6.82)#2,482 |
| 35. | New Village | 10.3% | 3.1%(+7.20)#35 | 3.5%(+6.79)#2,499 |
| 36. | Pleasantville | 10.1% | 3.1%(+6.98)#36 | 3.5%(+6.57)#2,592 |
| 37. | Ocean View | 9.9% | 3.1%(+6.86)#37 | 3.5%(+6.44)#2,670 |
| 38. | Plainfield | 9.9% | 3.1%(+6.84)#38 | 3.5%(+6.43)#2,681 |
| 39. | Mcguire Afb | 9.8% | 3.1%(+6.78)#39 | 3.5%(+6.36)#2,716 |
| 40. | Freehold Borough | 9.8% | 3.1%(+6.73)#40 | 3.5%(+6.31)#2,748 |
| 41. | Quinton | 9.5% | 3.1%(+6.44)#41 | 3.5%(+6.02)#2,889 |
| 42. | Trenton | 9.3% | 3.1%(+6.22)#42 | 3.5%(+5.80)#3,004 |
| 43. | Beattystown | 9.1% | 3.1%(+6.00)#43 | 3.5%(+5.59)#3,134 |
| 44. | Lakehurst Borough | 9.0% | 3.1%(+5.90)#44 | 3.5%(+5.49)#3,195 |
| 45. | Keasbey | 8.9% | 3.1%(+5.79)#45 | 3.5%(+5.37)#3,294 |
| 46. | Connecticut Farms | 8.8% | 3.1%(+5.73)#46 | 3.5%(+5.31)#3,330 |
| 47. | Silver Lake Cdp Warren County | 8.5% | 3.1%(+5.42)#47 | 3.5%(+5.00)#3,555 |
| 48. | Lindenwold Borough | 8.4% | 3.1%(+5.38)#48 | 3.5%(+4.96)#3,584 |
| 49. | Port Norris | 8.4% | 3.1%(+5.29)#49 | 3.5%(+4.87)#3,644 |
| 50. | Cumberland-Hesstown | 8.3% | 3.1%(+5.27)#50 | 3.5%(+4.85)#3,670 |
| 51. | North Wildwood | 8.2% | 3.1%(+5.09)#51 | 3.5%(+4.67)#3,839 |
| 52. | Victory Gardens Borough | 8.1% | 3.1%(+5.08)#52 | 3.5%(+4.66)#3,849 |
| 53. | Ampere North | 8.1% | 3.1%(+5.04)#53 | 3.5%(+4.63)#3,874 |
| 54. | Salem | 8.0% | 3.1%(+4.92)#54 | 3.5%(+4.50)#3,976 |
| 55. | Newtonville | 7.9% | 3.1%(+4.87)#55 | 3.5%(+4.45)#4,015 |
| 56. | Camden | 7.9% | 3.1%(+4.84)#56 | 3.5%(+4.42)#4,052 |
| 57. | Villas | 7.6% | 3.1%(+4.51)#57 | 3.5%(+4.10)#4,344 |
| 58. | Bargaintown | 7.6% | 3.1%(+4.50)#58 | 3.5%(+4.09)#4,358 |
| 59. | Long Branch | 7.3% | 3.1%(+4.28)#59 | 3.5%(+3.87)#4,577 |
| 60. | Franklin Borough | 7.3% | 3.1%(+4.26)#60 | 3.5%(+3.85)#4,600 |
| 61. | Union | 7.3% | 3.1%(+4.23)#61 | 3.5%(+3.81)#4,638 |
| 62. | Red Bank Borough | 7.2% | 3.1%(+4.14)#62 | 3.5%(+3.73)#4,716 |
| 63. | Finderne | 7.1% | 3.1%(+4.04)#63 | 3.5%(+3.62)#4,817 |
| 64. | Shiloh Borough | 6.9% | 3.1%(+3.83)#64 | 3.5%(+3.41)#5,046 |
| 65. | Lake Hiawatha | 6.8% | 3.1%(+3.76)#65 | 3.5%(+3.34)#5,152 |
| 66. | Vincentown | 6.8% | 3.1%(+3.71)#66 | 3.5%(+3.29)#5,230 |
| 67. | High Bridge Borough | 6.8% | 3.1%(+3.69)#67 | 3.5%(+3.27)#5,255 |
| 68. | Passaic | 6.7% | 3.1%(+3.64)#68 | 3.5%(+3.23)#5,305 |
| 69. | Port Morris | 6.6% | 3.1%(+3.56)#69 | 3.5%(+3.14)#5,411 |
| 70. | Woodbine Borough | 6.6% | 3.1%(+3.54)#70 | 3.5%(+3.12)#5,446 |
| 71. | Lake Como Borough | 6.6% | 3.1%(+3.52)#71 | 3.5%(+3.10)#5,472 |
| 72. | Hammonton | 6.6% | 3.1%(+3.49)#72 | 3.5%(+3.08)#5,511 |
| 73. | New Brunswick | 6.6% | 3.1%(+3.49)#73 | 3.5%(+3.07)#5,522 |
| 74. | Phillipsburg | 6.5% | 3.1%(+3.46)#74 | 3.5%(+3.04)#5,553 |
| 75. | Woodlynne Borough | 6.5% | 3.1%(+3.46)#75 | 3.5%(+3.04)#5,555 |
| 76. | Cape May Point Borough | 6.5% | 3.1%(+3.46)#76 | 3.5%(+3.04)#5,567 |
| 77. | Hackettstown | 6.4% | 3.1%(+3.36)#77 | 3.5%(+2.94)#5,695 |
| 78. | Pemberton Borough | 6.4% | 3.1%(+3.35)#78 | 3.5%(+2.94)#5,707 |
| 79. | Ocean Grove | 6.4% | 3.1%(+3.34)#79 | 3.5%(+2.92)#5,724 |
| 80. | Burlington | 6.4% | 3.1%(+3.30)#80 | 3.5%(+2.88)#5,778 |
| 81. | North Middletown | 6.3% | 3.1%(+3.27)#81 | 3.5%(+2.86)#5,824 |
| 82. | Paterson | 6.3% | 3.1%(+3.24)#82 | 3.5%(+2.83)#5,866 |
| 83. | Whitesboro | 6.3% | 3.1%(+3.24)#83 | 3.5%(+2.82)#5,874 |
| 84. | Franklinville | 6.3% | 3.1%(+3.23)#84 | 3.5%(+2.82)#5,879 |
| 85. | Perth Amboy | 6.2% | 3.1%(+3.11)#85 | 3.5%(+2.70)#6,091 |
| 86. | South Dennis | 6.2% | 3.1%(+3.09)#86 | 3.5%(+2.67)#6,131 |
| 87. | New Egypt | 6.1% | 3.1%(+3.06)#87 | 3.5%(+2.64)#6,188 |
| 88. | Cliffside Park Borough | 6.1% | 3.1%(+3.01)#88 | 3.5%(+2.60)#6,231 |
| 89. | Elizabeth | 6.1% | 3.1%(+3.01)#89 | 3.5%(+2.59)#6,236 |
| 90. | Newark | 6.1% | 3.1%(+2.99)#90 | 3.5%(+2.57)#6,292 |
| 91. | Kingston Estates | 6.0% | 3.1%(+2.93)#91 | 3.5%(+2.51)#6,379 |
| 92. | Kearny | 6.0% | 3.1%(+2.92)#92 | 3.5%(+2.50)#6,404 |
| 93. | Hampton Borough | 6.0% | 3.1%(+2.91)#93 | 3.5%(+2.49)#6,424 |
| 94. | Alloway | 6.0% | 3.1%(+2.90)#94 | 3.5%(+2.49)#6,430 |
| 95. | Morristown | 5.9% | 3.1%(+2.87)#95 | 3.5%(+2.46)#6,481 |
| 96. | Navesink | 5.9% | 3.1%(+2.86)#96 | 3.5%(+2.44)#6,507 |
| 97. | Absecon Highlands | 5.9% | 3.1%(+2.84)#97 | 3.5%(+2.43)#6,537 |
| 98. | Bound Brook Borough | 5.9% | 3.1%(+2.84)#98 | 3.5%(+2.42)#6,543 |
| 99. | Rockaway Borough | 5.8% | 3.1%(+2.77)#99 | 3.5%(+2.36)#6,625 |
| 100. | Union City | 5.8% | 3.1%(+2.72)#100 | 3.5%(+2.31)#6,700 |
Common Questions
What are the Top 10 Cities with the Highest Percentage of Population Employed in Cleaning & Maintenance in New Jersey?
Top 10 Cities with the Highest Percentage of Population Employed in Cleaning & Maintenance in New Jersey are:
#1
28.4%
#2
19.4%
#3
16.6%
#4
14.8%
#5
14.6%
#6
13.5%
#7
13.0%
#8
12.8%
#9
12.6%
#10
12.5%
What city has the Highest Percentage of Population Employed in Cleaning & Maintenance in New Jersey?
Asbury has the Highest Percentage of Population Employed in Cleaning & Maintenance in New Jersey with 28.4%.
What is the Percentage of Population Employed in Cleaning & Maintenance in the State of New Jersey?
Percentage of Population Employed in Cleaning & Maintenance in New Jersey is 3.1%.
What is the Percentage of Population Employed in Cleaning & Maintenance in the United States?
Percentage of Population Employed in Cleaning & Maintenance in the United States is 3.5%.