Haddonfield borough, NJ Map & Demographics
Haddonfield borough Overview
$90,870
PER CAPITA INCOME
$219,122
AVG FAMILY INCOME
$178,362
AVG HOUSEHOLD INCOME
43.1%
WAGE / INCOME GAP [ % ]
56.9¢/ $1
WAGE / INCOME GAP [ $ ]
$20,998
FAMILY INCOME DEFICIT
0.47
INEQUALITY / GINI INDEX
12,456
TOTAL POPULATION
6,029
MALE POPULATION
6,427
FEMALE POPULATION
93.81
MALES / 100 FEMALES
106.60
FEMALES / 100 MALES
39.4
MEDIAN AGE
3.3
AVG FAMILY SIZE
2.9
AVG HOUSEHOLD SIZE
6,242
LABOR FORCE [ PEOPLE ]
70.0%
PERCENT IN LABOR FORCE
3.4%
UNEMPLOYMENT RATE
Income in Haddonfield borough
Income Overview in Haddonfield borough
Per Capita Income in Haddonfield borough is $90,870, while median incomes of families and households are $219,122 and $178,362 respectively.
| Characteristic | Number | Measure |
| Per Capita Income | 12,456 | $90,870 |
| Median Family Income | 3,393 | $219,122 |
| Mean Family Income | 3,393 | $306,164 |
| Median Household Income | 4,232 | $178,362 |
| Mean Household Income | 4,232 | $264,817 |
| Income Deficit | 3,393 | $20,998 |
| Wage / Income Gap (%) | 12,456 | 43.12% |
| Wage / Income Gap ($) | 12,456 | 56.88¢ per $1 |
| Gini / Inequality Index | 12,456 | 0.47 |
Earnings by Sex in Haddonfield borough
Average Earnings in Haddonfield borough are $92,910, $119,821 for men and $68,152 for women, a difference of 43.1%.
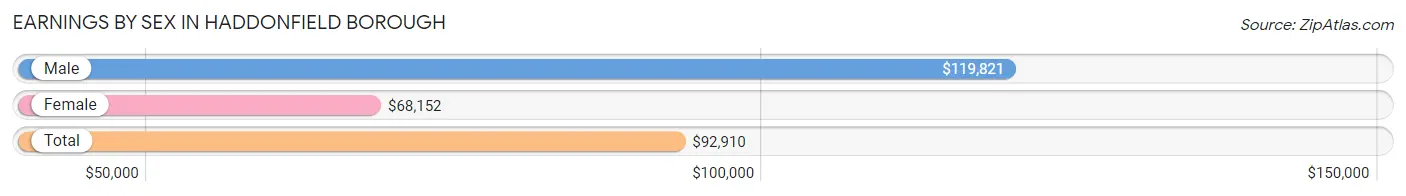
| Sex | Number | Average Earnings |
| Male | 3,500 (53.1%) | $119,821 |
| Female | 3,091 (46.9%) | $68,152 |
| Total | 6,591 (100.0%) | $92,910 |
Earnings by Sex by Income Bracket in Haddonfield borough
The most common earnings brackets in Haddonfield borough are $100,000+ for men (2,154 | 61.5%) and $100,000+ for women (980 | 31.7%).
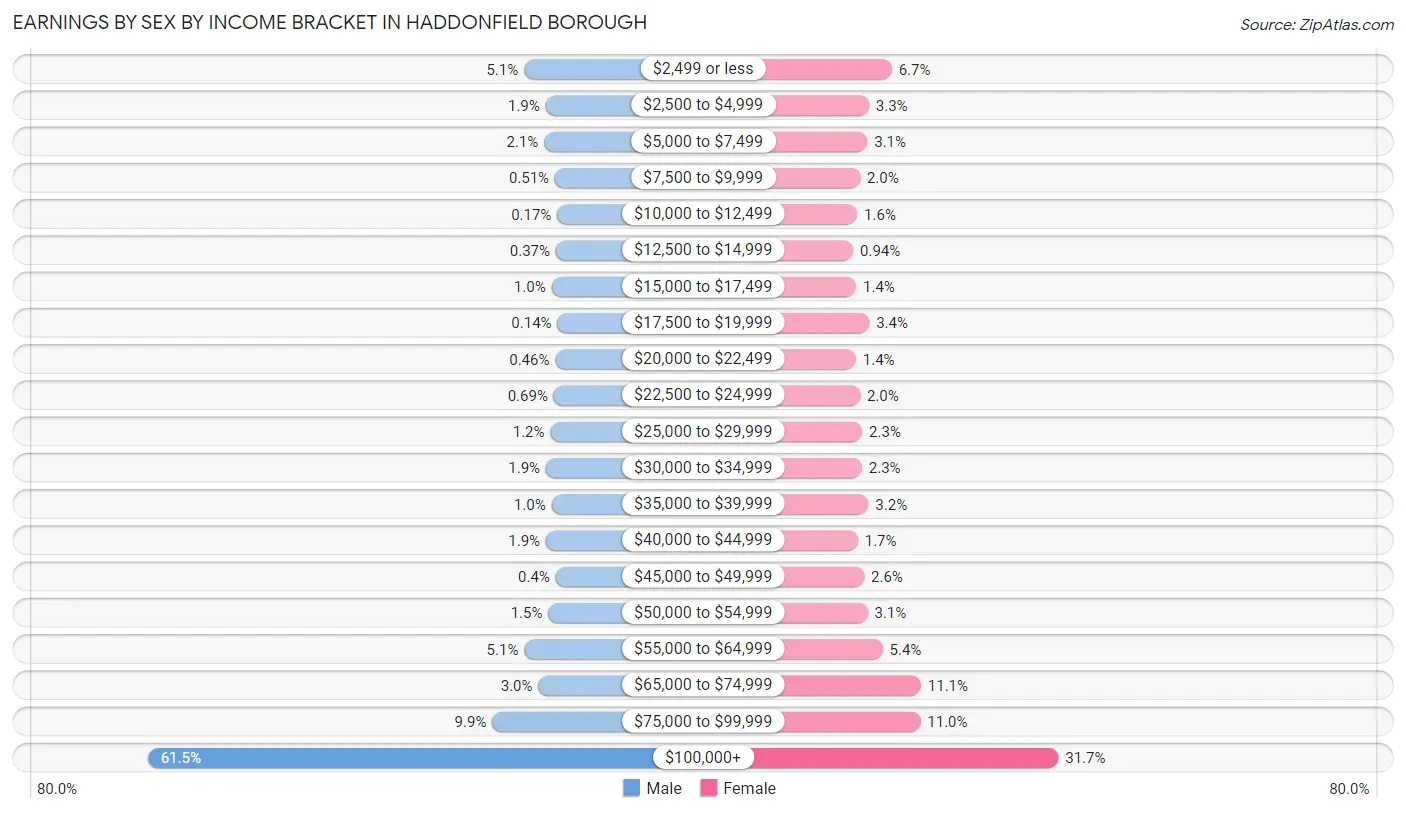
| Income | Male | Female |
| $2,499 or less | 180 (5.1%) | 208 (6.7%) |
| $2,500 to $4,999 | 67 (1.9%) | 102 (3.3%) |
| $5,000 to $7,499 | 75 (2.1%) | 95 (3.1%) |
| $7,500 to $9,999 | 18 (0.5%) | 61 (2.0%) |
| $10,000 to $12,499 | 6 (0.2%) | 48 (1.5%) |
| $12,500 to $14,999 | 13 (0.4%) | 29 (0.9%) |
| $15,000 to $17,499 | 36 (1.0%) | 43 (1.4%) |
| $17,500 to $19,999 | 5 (0.1%) | 104 (3.4%) |
| $20,000 to $22,499 | 16 (0.5%) | 42 (1.4%) |
| $22,500 to $24,999 | 24 (0.7%) | 61 (2.0%) |
| $25,000 to $29,999 | 42 (1.2%) | 71 (2.3%) |
| $30,000 to $34,999 | 65 (1.9%) | 70 (2.3%) |
| $35,000 to $39,999 | 36 (1.0%) | 100 (3.2%) |
| $40,000 to $44,999 | 65 (1.9%) | 51 (1.7%) |
| $45,000 to $49,999 | 14 (0.4%) | 80 (2.6%) |
| $50,000 to $54,999 | 53 (1.5%) | 96 (3.1%) |
| $55,000 to $64,999 | 179 (5.1%) | 166 (5.4%) |
| $65,000 to $74,999 | 105 (3.0%) | 343 (11.1%) |
| $75,000 to $99,999 | 347 (9.9%) | 341 (11.0%) |
| $100,000+ | 2,154 (61.5%) | 980 (31.7%) |
| Total | 3,500 (100.0%) | 3,091 (100.0%) |
Earnings by Sex by Educational Attainment in Haddonfield borough
Average earnings in Haddonfield borough are $130,762 for men and $71,979 for women, a difference of 45.0%. Men with an educational attainment of graduate degree enjoy the highest average annual earnings of $201,528, while those with high school diploma education earn the least with $57,868. Women with an educational attainment of graduate degree earn the most with the average annual earnings of $79,223, while those with college or associate's degree education have the smallest earnings of $23,667.
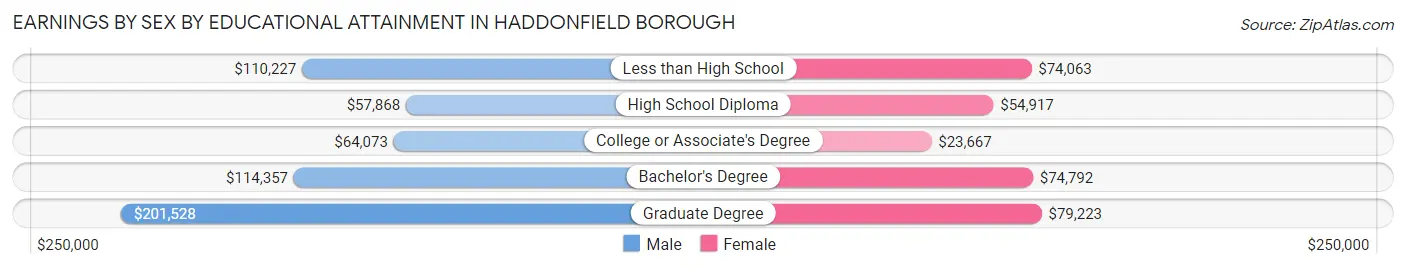
| Educational Attainment | Male Income | Female Income |
| Less than High School | $110,227 | $74,063 |
| High School Diploma | $57,868 | $54,917 |
| College or Associate's Degree | $64,073 | $23,667 |
| Bachelor's Degree | $114,357 | $74,792 |
| Graduate Degree | $201,528 | $79,223 |
| Total | $130,762 | $71,979 |
Family Income in Haddonfield borough
Family Income Brackets in Haddonfield borough
According to the Haddonfield borough family income data, there are 1,825 families falling into the $200,000+ income range, which is the most common income bracket and makes up 53.8% of all families.
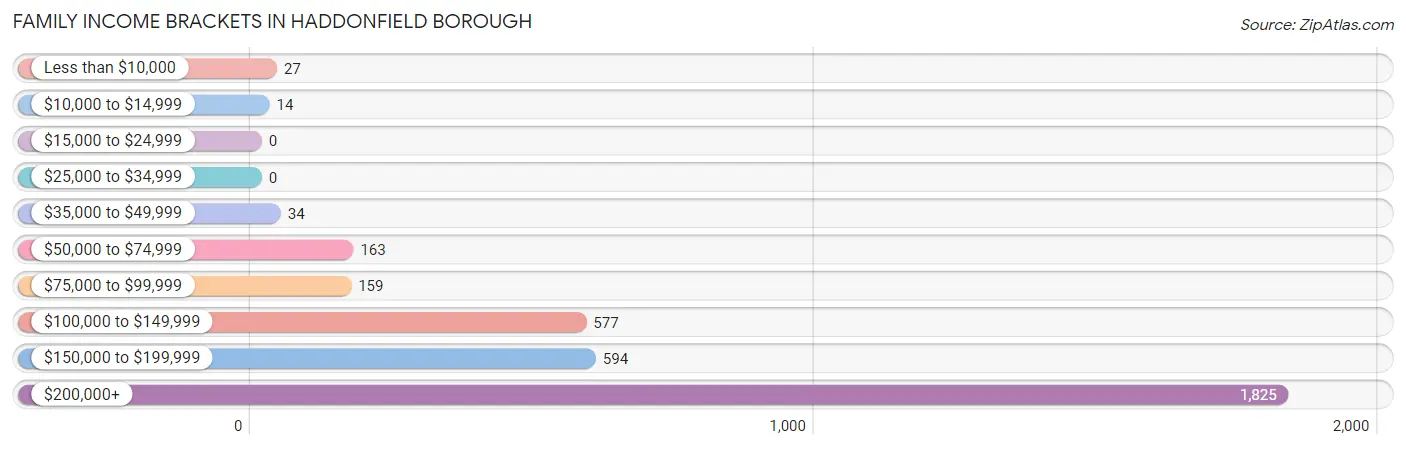
| Income Bracket | # Families | % Families |
| Less than $10,000 | 27 | 0.8% |
| $10,000 to $14,999 | 14 | 0.4% |
| $15,000 to $24,999 | 0 | 0.0% |
| $25,000 to $34,999 | 0 | 0.0% |
| $35,000 to $49,999 | 34 | 1.0% |
| $50,000 to $74,999 | 163 | 4.8% |
| $75,000 to $99,999 | 159 | 4.7% |
| $100,000 to $149,999 | 577 | 17.0% |
| $150,000 to $199,999 | 594 | 17.5% |
| $200,000+ | 1,825 | 53.8% |
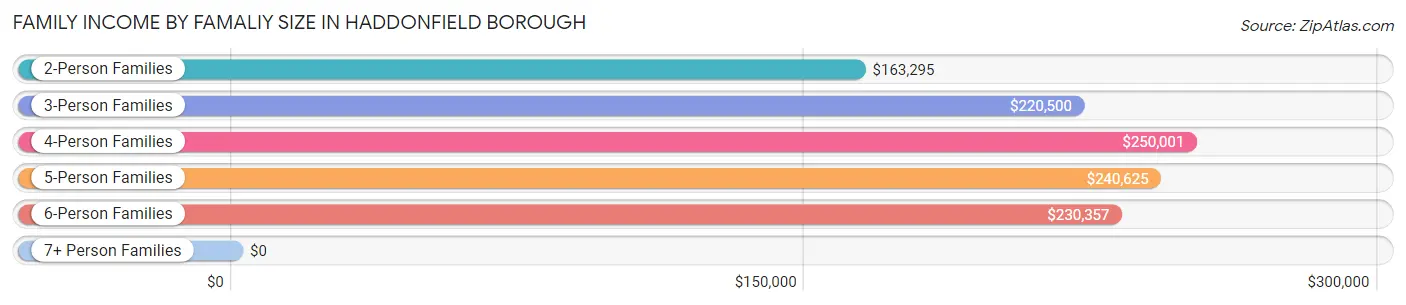
Family Income by Famaliy Size in Haddonfield borough
4-person families (1,103 | 32.5%) account for the highest median family income in Haddonfield borough with $250,001 per family, while 2-person families (1,173 | 34.6%) have the highest median income of $81,648 per family member.
| Income Bracket | # Families | Median Income |
| 2-Person Families | 1,173 (34.6%) | $163,295 |
| 3-Person Families | 654 (19.3%) | $220,500 |
| 4-Person Families | 1,103 (32.5%) | $250,001 |
| 5-Person Families | 333 (9.8%) | $240,625 |
| 6-Person Families | 130 (3.8%) | $230,357 |
| 7+ Person Families | 0 (0.0%) | $0 |
| Total | 3,393 (100.0%) | $219,122 |
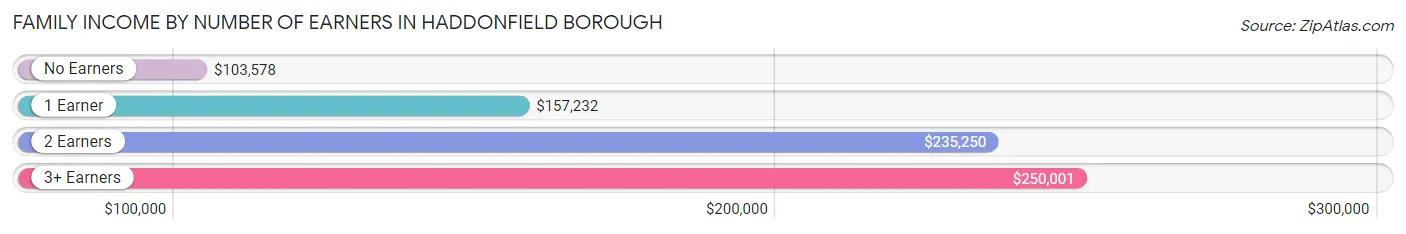
Family Income by Number of Earners in Haddonfield borough
The median family income in Haddonfield borough is $219,122, with families comprising 3+ earners (336) having the highest median family income of $250,001, while families with no earners (265) have the lowest median family income of $103,578, accounting for 9.9% and 7.8% of families, respectively.
| Number of Earners | # Families | Median Income |
| No Earners | 265 (7.8%) | $103,578 |
| 1 Earner | 871 (25.7%) | $157,232 |
| 2 Earners | 1,921 (56.6%) | $235,250 |
| 3+ Earners | 336 (9.9%) | $250,001 |
| Total | 3,393 (100.0%) | $219,122 |
Household Income in Haddonfield borough
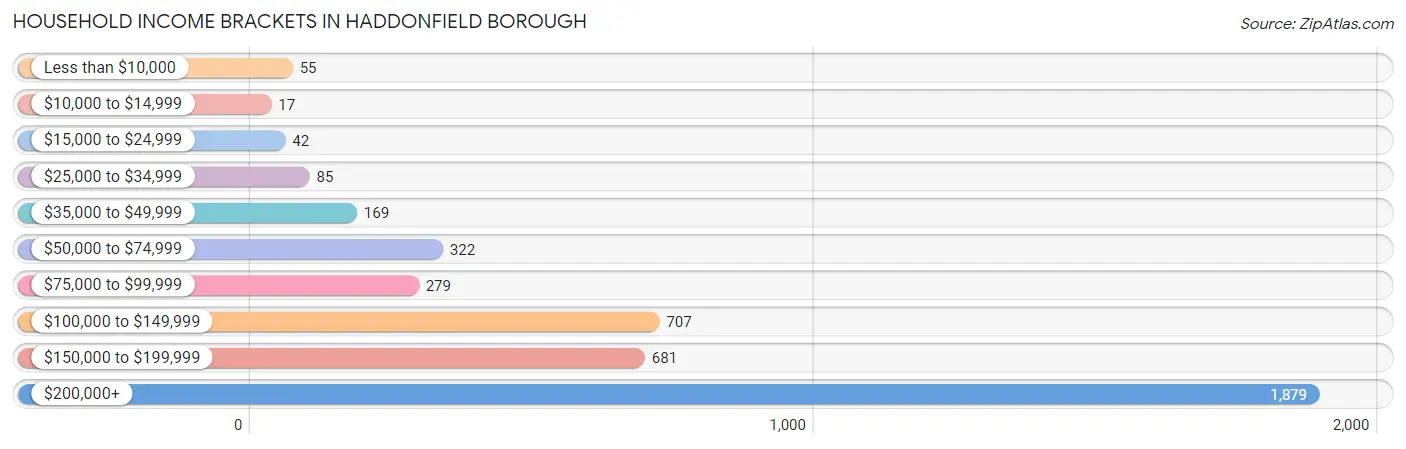
Household Income Brackets in Haddonfield borough
With 1,879 households falling in the category, the $200,000+ income range is the most frequent in Haddonfield borough, accounting for 44.4% of all households. In contrast, only 17 households (0.4%) fall into the $10,000 to $14,999 income bracket, making it the least populous group.
| Income Bracket | # Households | % Households |
| Less than $10,000 | 55 | 1.3% |
| $10,000 to $14,999 | 17 | 0.4% |
| $15,000 to $24,999 | 42 | 1.0% |
| $25,000 to $34,999 | 85 | 2.0% |
| $35,000 to $49,999 | 169 | 4.0% |
| $50,000 to $74,999 | 322 | 7.6% |
| $75,000 to $99,999 | 279 | 6.6% |
| $100,000 to $149,999 | 707 | 16.7% |
| $150,000 to $199,999 | 681 | 16.1% |
| $200,000+ | 1,879 | 44.4% |
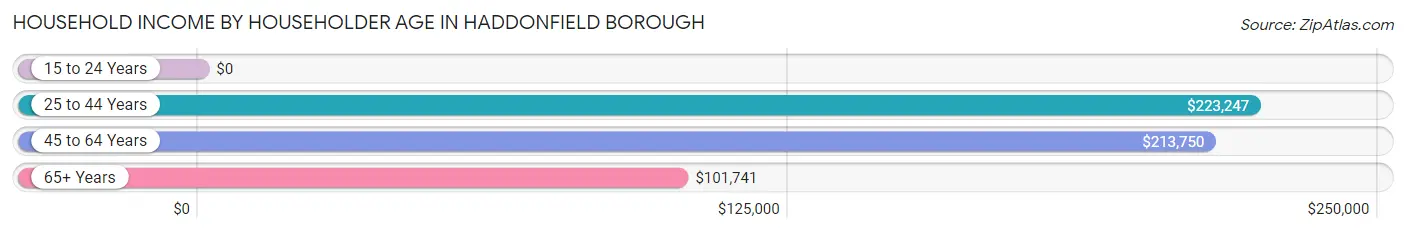
Household Income by Householder Age in Haddonfield borough
The median household income in Haddonfield borough is $178,362, with the highest median household income of $223,247 found in the 25 to 44 years age bracket for the primary householder. A total of 1,505 households (35.6%) fall into this category. Meanwhile, the 15 to 24 years age bracket for the primary householder has the lowest median household income of $0, with 5 households (0.1%) in this group.
| Income Bracket | # Households | Median Income |
| 15 to 24 Years | 5 (0.1%) | $0 |
| 25 to 44 Years | 1,505 (35.6%) | $223,247 |
| 45 to 64 Years | 1,671 (39.5%) | $213,750 |
| 65+ Years | 1,051 (24.8%) | $101,741 |
| Total | 4,232 (100.0%) | $178,362 |
Poverty in Haddonfield borough
Income Below Poverty by Sex and Age in Haddonfield borough
With 1.1% poverty level for males and 3.1% for females among the residents of Haddonfield borough, 25 to 34 year old males and 15 year old females are the most vulnerable to poverty, with 20 males (5.2%) and 14 females (28.6%) in their respective age groups living below the poverty level.
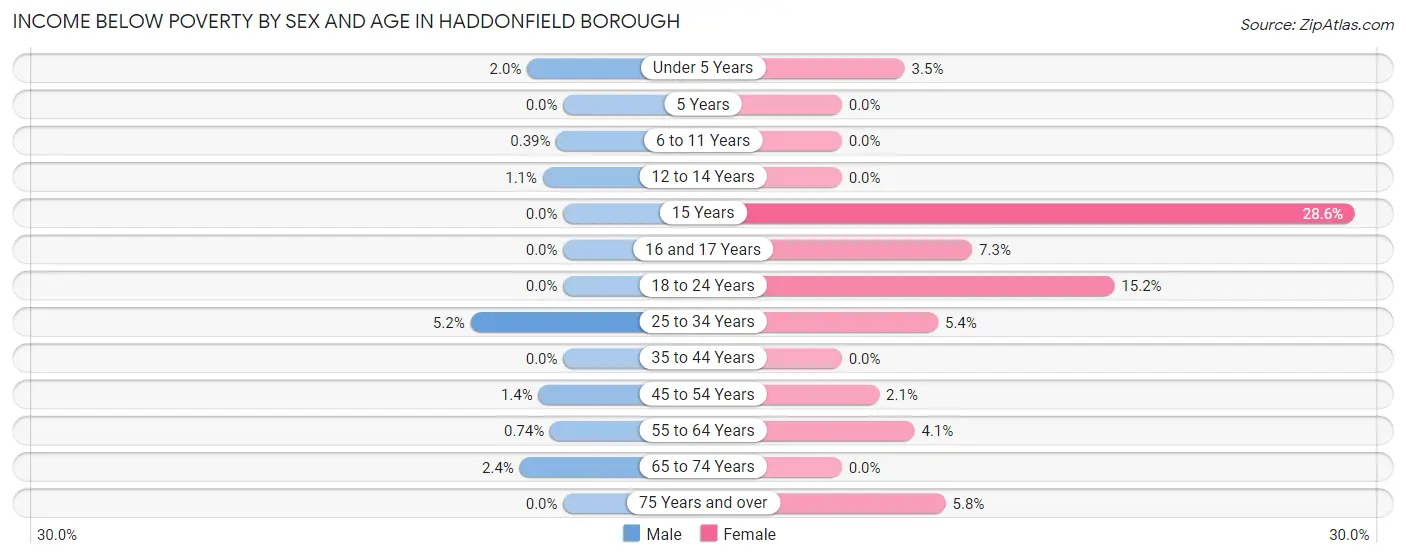
| Age Bracket | Male | Female |
| Under 5 Years | 8 (2.0%) | 24 (3.5%) |
| 5 Years | 0 (0.0%) | 0 (0.0%) |
| 6 to 11 Years | 3 (0.4%) | 0 (0.0%) |
| 12 to 14 Years | 4 (1.1%) | 0 (0.0%) |
| 15 Years | 0 (0.0%) | 14 (28.6%) |
| 16 and 17 Years | 0 (0.0%) | 22 (7.3%) |
| 18 to 24 Years | 0 (0.0%) | 39 (15.2%) |
| 25 to 34 Years | 20 (5.2%) | 26 (5.4%) |
| 35 to 44 Years | 0 (0.0%) | 0 (0.0%) |
| 45 to 54 Years | 14 (1.4%) | 19 (2.1%) |
| 55 to 64 Years | 4 (0.7%) | 26 (4.1%) |
| 65 to 74 Years | 12 (2.4%) | 0 (0.0%) |
| 75 Years and over | 0 (0.0%) | 29 (5.8%) |
| Total | 65 (1.1%) | 199 (3.1%) |
Income Above Poverty by Sex and Age in Haddonfield borough
According to the poverty statistics in Haddonfield borough, males aged 5 years and females aged 5 years are the age groups that are most secure financially, with 100.0% of males and 100.0% of females in these age groups living above the poverty line.
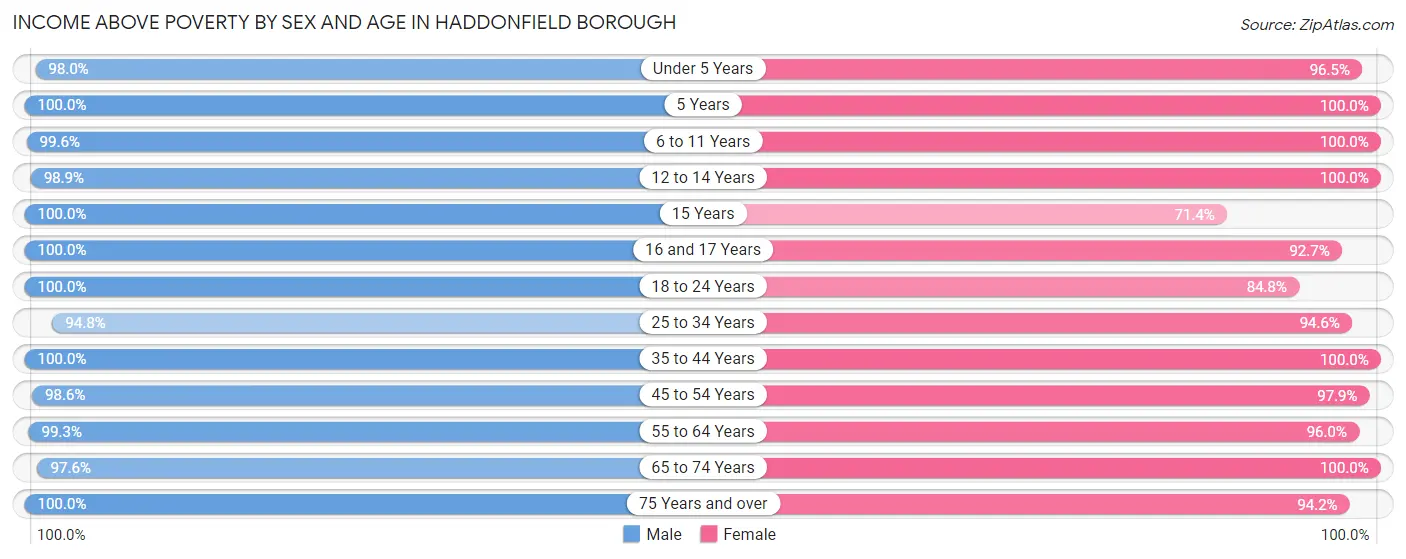
| Age Bracket | Male | Female |
| Under 5 Years | 391 (98.0%) | 662 (96.5%) |
| 5 Years | 70 (100.0%) | 110 (100.0%) |
| 6 to 11 Years | 766 (99.6%) | 567 (100.0%) |
| 12 to 14 Years | 346 (98.9%) | 332 (100.0%) |
| 15 Years | 188 (100.0%) | 35 (71.4%) |
| 16 and 17 Years | 267 (100.0%) | 281 (92.7%) |
| 18 to 24 Years | 195 (100.0%) | 218 (84.8%) |
| 25 to 34 Years | 367 (94.8%) | 459 (94.6%) |
| 35 to 44 Years | 1,033 (100.0%) | 1,112 (100.0%) |
| 45 to 54 Years | 1,001 (98.6%) | 896 (97.9%) |
| 55 to 64 Years | 534 (99.3%) | 616 (96.0%) |
| 65 to 74 Years | 481 (97.6%) | 436 (100.0%) |
| 75 Years and over | 300 (100.0%) | 473 (94.2%) |
| Total | 5,939 (98.9%) | 6,197 (96.9%) |
Income Below Poverty Among Married-Couple Families in Haddonfield borough
The poverty statistics for married-couple families in Haddonfield borough show that 0.9% or 28 of the total 3,041 families live below the poverty line. Families with 1 or 2 children have the highest poverty rate of 1.6%, comprising of 23 families. On the other hand, families with 3 or 4 children have the lowest poverty rate of 0.0%, which includes 0 families.
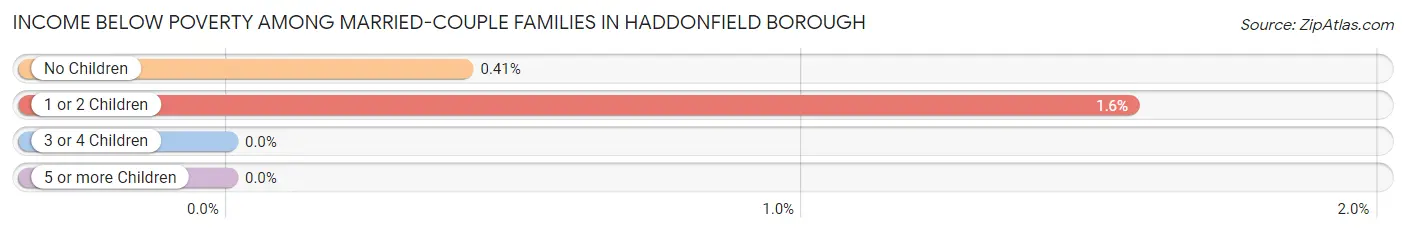
| Children | Above Poverty | Below Poverty |
| No Children | 1,218 (99.6%) | 5 (0.4%) |
| 1 or 2 Children | 1,440 (98.4%) | 23 (1.6%) |
| 3 or 4 Children | 355 (100.0%) | 0 (0.0%) |
| 5 or more Children | 0 (0.0%) | 0 (0.0%) |
| Total | 3,013 (99.1%) | 28 (0.9%) |
Income Below Poverty Among Single-Parent Households in Haddonfield borough
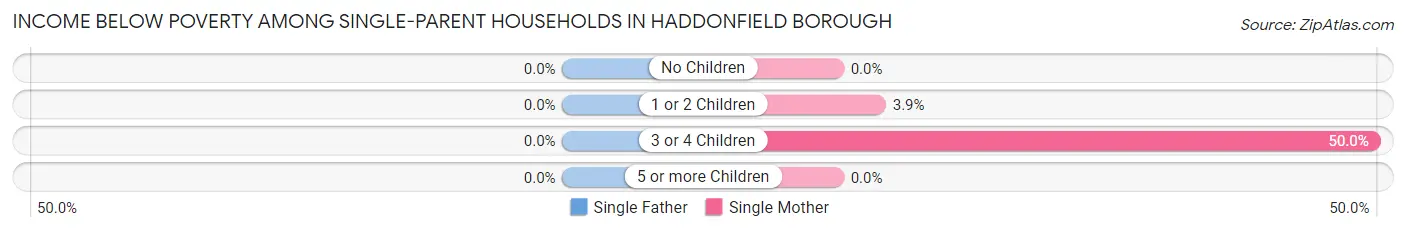
| Children | Single Father | Single Mother |
| No Children | 0 (0.0%) | 0 (0.0%) |
| 1 or 2 Children | 0 (0.0%) | 8 (3.9%) |
| 3 or 4 Children | 0 (0.0%) | 4 (50.0%) |
| 5 or more Children | 0 (0.0%) | 0 (0.0%) |
| Total | 0 (0.0%) | 12 (4.4%) |
Income Below Poverty Among Married-Couple vs Single-Parent Households in Haddonfield borough
The poverty data for Haddonfield borough shows that 28 of the married-couple family households (0.9%) and 12 of the single-parent households (3.4%) are living below the poverty level. Within the married-couple family households, those with 1 or 2 children have the highest poverty rate, with 23 households (1.6%) falling below the poverty line. Among the single-parent households, those with 3 or 4 children have the highest poverty rate, with 4 household (14.8%) living below poverty.
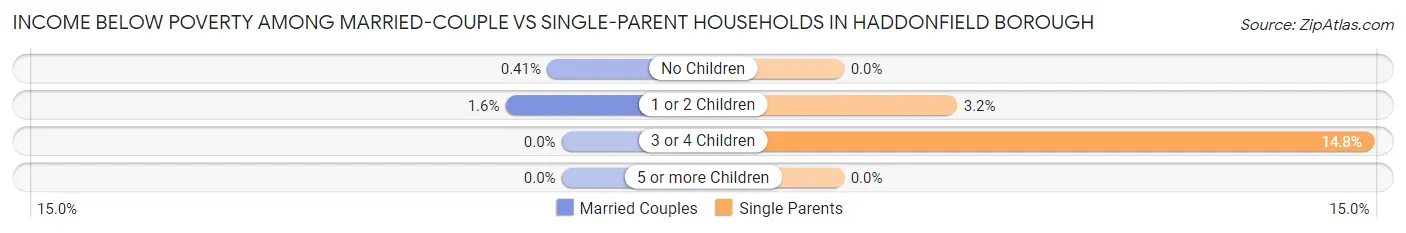
| Children | Married-Couple Families | Single-Parent Households |
| No Children | 5 (0.4%) | 0 (0.0%) |
| 1 or 2 Children | 23 (1.6%) | 8 (3.2%) |
| 3 or 4 Children | 0 (0.0%) | 4 (14.8%) |
| 5 or more Children | 0 (0.0%) | 0 (0.0%) |
| Total | 28 (0.9%) | 12 (3.4%) |
Race in Haddonfield borough
The most populous races in Haddonfield borough are White / Caucasian (11,231 | 90.2%), Two or more Races (911 | 7.3%), and Hispanic or Latino (674 | 5.4%).
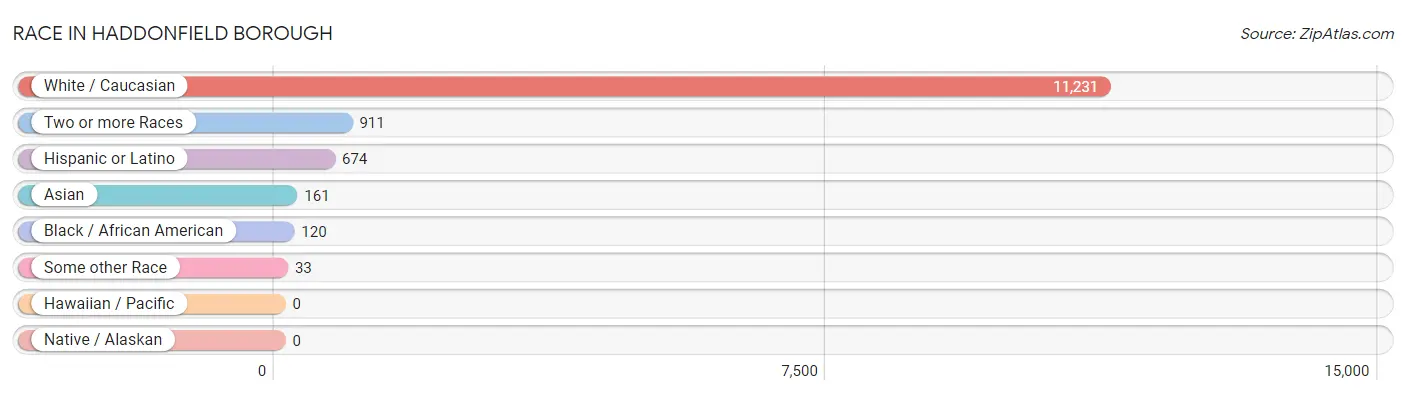
| Race | # Population | % Population |
| Asian | 161 | 1.3% |
| Black / African American | 120 | 1.0% |
| Hawaiian / Pacific | 0 | 0.0% |
| Hispanic or Latino | 674 | 5.4% |
| Native / Alaskan | 0 | 0.0% |
| White / Caucasian | 11,231 | 90.2% |
| Two or more Races | 911 | 7.3% |
| Some other Race | 33 | 0.3% |
| Total | 12,456 | 100.0% |
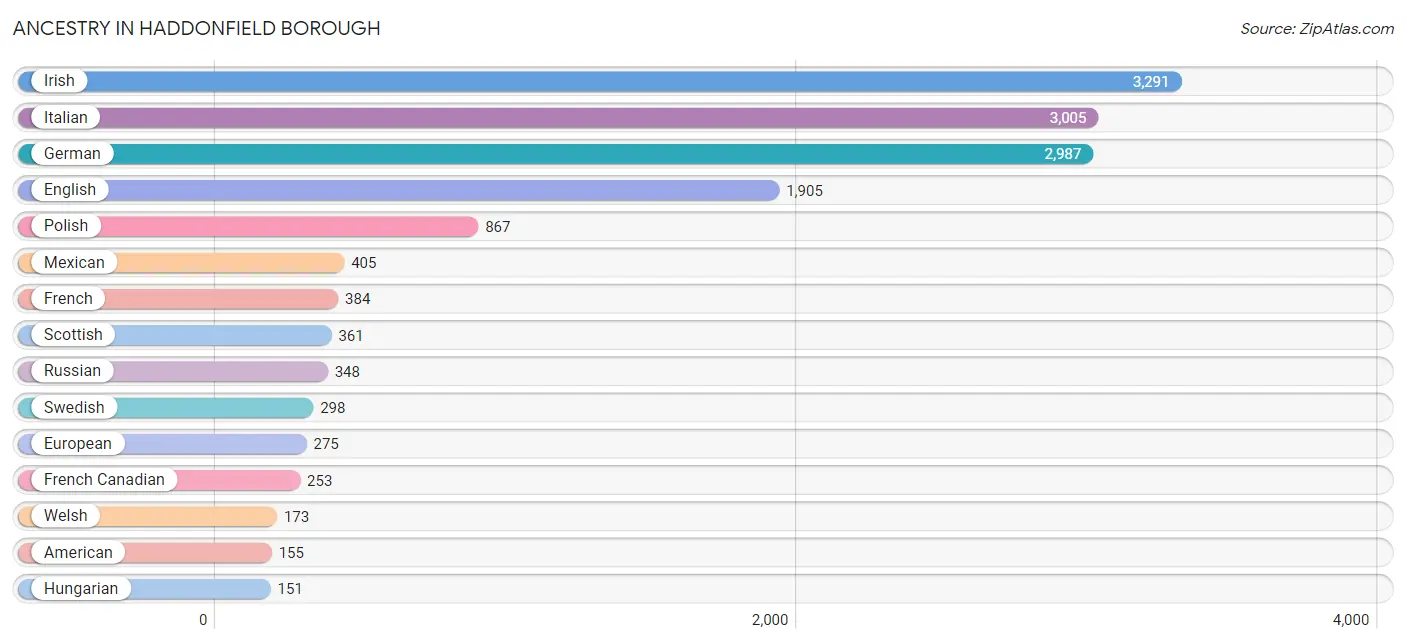
Ancestry in Haddonfield borough
The most populous ancestries reported in Haddonfield borough are Irish (3,291 | 26.4%), Italian (3,005 | 24.1%), German (2,987 | 24.0%), English (1,905 | 15.3%), and Polish (867 | 7.0%), together accounting for 96.8% of all Haddonfield borough residents.
| Ancestry | # Population | % Population |
| American | 155 | 1.2% |
| Apache | 11 | 0.1% |
| Arab | 45 | 0.4% |
| Australian | 10 | 0.1% |
| Austrian | 90 | 0.7% |
| Belgian | 12 | 0.1% |
| Bhutanese | 7 | 0.1% |
| Bolivian | 14 | 0.1% |
| British | 87 | 0.7% |
| Burmese | 19 | 0.2% |
| Carpatho Rusyn | 9 | 0.1% |
| Central American | 13 | 0.1% |
| Cherokee | 3 | 0.0% |
| Colombian | 19 | 0.2% |
| Croatian | 30 | 0.2% |
| Cuban | 27 | 0.2% |
| Czech | 115 | 0.9% |
| Delaware | 4 | 0.0% |
| Dominican | 13 | 0.1% |
| Dutch | 18 | 0.1% |
| Eastern European | 100 | 0.8% |
| Egyptian | 39 | 0.3% |
| English | 1,905 | 15.3% |
| Estonian | 5 | 0.0% |
| Ethiopian | 5 | 0.0% |
| European | 275 | 2.2% |
| French | 384 | 3.1% |
| French Canadian | 253 | 2.0% |
| German | 2,987 | 24.0% |
| Greek | 79 | 0.6% |
| Guatemalan | 7 | 0.1% |
| Hungarian | 151 | 1.2% |
| Indian (Asian) | 141 | 1.1% |
| Irish | 3,291 | 26.4% |
| Israeli | 47 | 0.4% |
| Italian | 3,005 | 24.1% |
| Korean | 71 | 0.6% |
| Laotian | 1 | 0.0% |
| Lithuanian | 48 | 0.4% |
| Maltese | 6 | 0.1% |
| Mexican | 405 | 3.3% |
| Moroccan | 6 | 0.1% |
| Northern European | 23 | 0.2% |
| Norwegian | 105 | 0.8% |
| Panamanian | 6 | 0.1% |
| Pennsylvania German | 7 | 0.1% |
| Peruvian | 29 | 0.2% |
| Polish | 867 | 7.0% |
| Portuguese | 19 | 0.2% |
| Potawatomi | 4 | 0.0% |
| Puerto Rican | 74 | 0.6% |
| Romanian | 50 | 0.4% |
| Russian | 348 | 2.8% |
| Scandinavian | 89 | 0.7% |
| Scotch-Irish | 117 | 0.9% |
| Scottish | 361 | 2.9% |
| Slavic | 44 | 0.4% |
| Slovak | 33 | 0.3% |
| South African | 8 | 0.1% |
| South American | 62 | 0.5% |
| Spaniard | 70 | 0.6% |
| Sri Lankan | 24 | 0.2% |
| Subsaharan African | 13 | 0.1% |
| Swedish | 298 | 2.4% |
| Swiss | 34 | 0.3% |
| Thai | 43 | 0.4% |
| Trinidadian and Tobagonian | 7 | 0.1% |
| Turkish | 20 | 0.2% |
| Ukrainian | 121 | 1.0% |
| Welsh | 173 | 1.4% | View All 70 Rows |
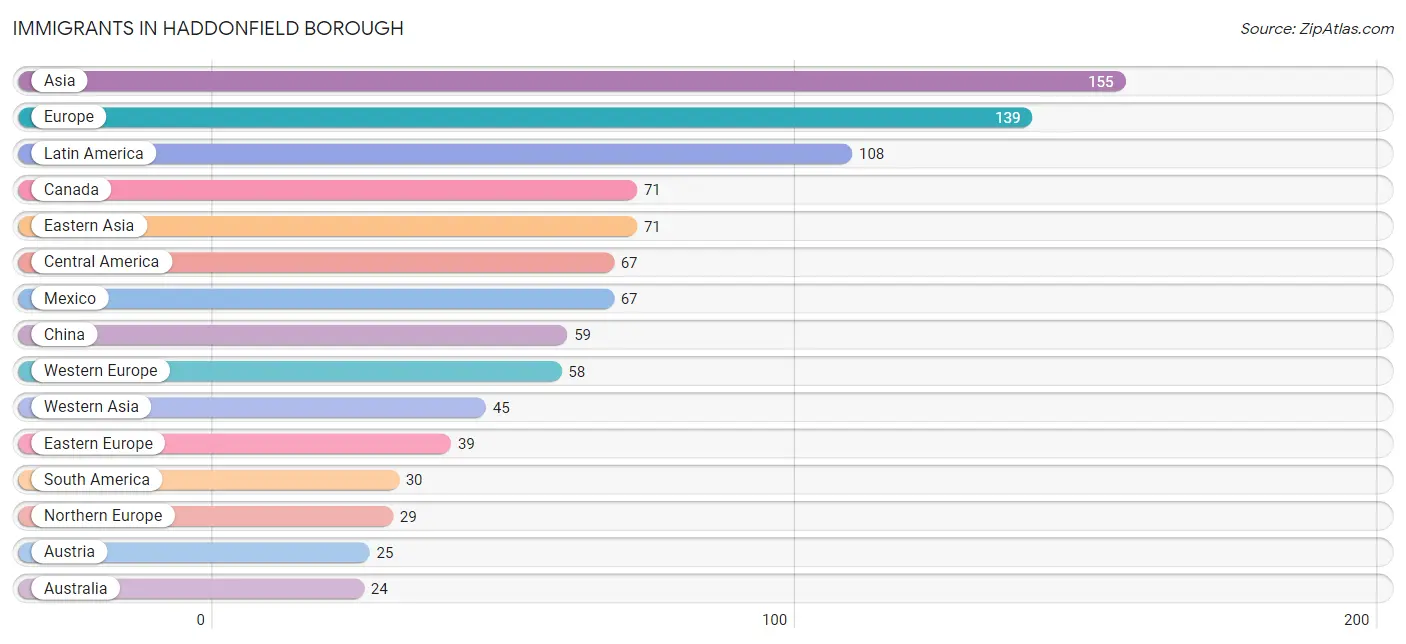
Immigrants in Haddonfield borough
The most numerous immigrant groups reported in Haddonfield borough came from Asia (155 | 1.2%), Europe (139 | 1.1%), Latin America (108 | 0.9%), Canada (71 | 0.6%), and Eastern Asia (71 | 0.6%), together accounting for 4.4% of all Haddonfield borough residents.
| Immigration Origin | # Population | % Population |
| Africa | 17 | 0.1% |
| Asia | 155 | 1.2% |
| Australia | 24 | 0.2% |
| Austria | 25 | 0.2% |
| Bangladesh | 4 | 0.0% |
| Bolivia | 5 | 0.0% |
| Bosnia and Herzegovina | 4 | 0.0% |
| Brazil | 15 | 0.1% |
| Canada | 71 | 0.6% |
| Caribbean | 11 | 0.1% |
| Central America | 67 | 0.5% |
| China | 59 | 0.5% |
| Colombia | 10 | 0.1% |
| Cuba | 4 | 0.0% |
| Eastern Africa | 5 | 0.0% |
| Eastern Asia | 71 | 0.6% |
| Eastern Europe | 39 | 0.3% |
| Egypt | 6 | 0.1% |
| England | 21 | 0.2% |
| Ethiopia | 5 | 0.0% |
| Europe | 139 | 1.1% |
| France | 9 | 0.1% |
| Germany | 24 | 0.2% |
| Hong Kong | 13 | 0.1% |
| India | 12 | 0.1% |
| Indonesia | 1 | 0.0% |
| Israel | 20 | 0.2% |
| Italy | 13 | 0.1% |
| Japan | 7 | 0.1% |
| Korea | 5 | 0.0% |
| Latin America | 108 | 0.9% |
| Mexico | 67 | 0.5% |
| Morocco | 6 | 0.1% |
| Northern Africa | 12 | 0.1% |
| Northern Europe | 29 | 0.2% |
| Oceania | 24 | 0.2% |
| Poland | 10 | 0.1% |
| Russia | 20 | 0.2% |
| Singapore | 8 | 0.1% |
| South America | 30 | 0.2% |
| South Central Asia | 16 | 0.1% |
| South Eastern Asia | 23 | 0.2% |
| Southern Europe | 13 | 0.1% |
| Thailand | 14 | 0.1% |
| Trinidad and Tobago | 7 | 0.1% |
| Ukraine | 5 | 0.0% |
| Western Asia | 45 | 0.4% |
| Western Europe | 58 | 0.5% | View All 48 Rows |
Sex and Age in Haddonfield borough
Sex and Age in Haddonfield borough
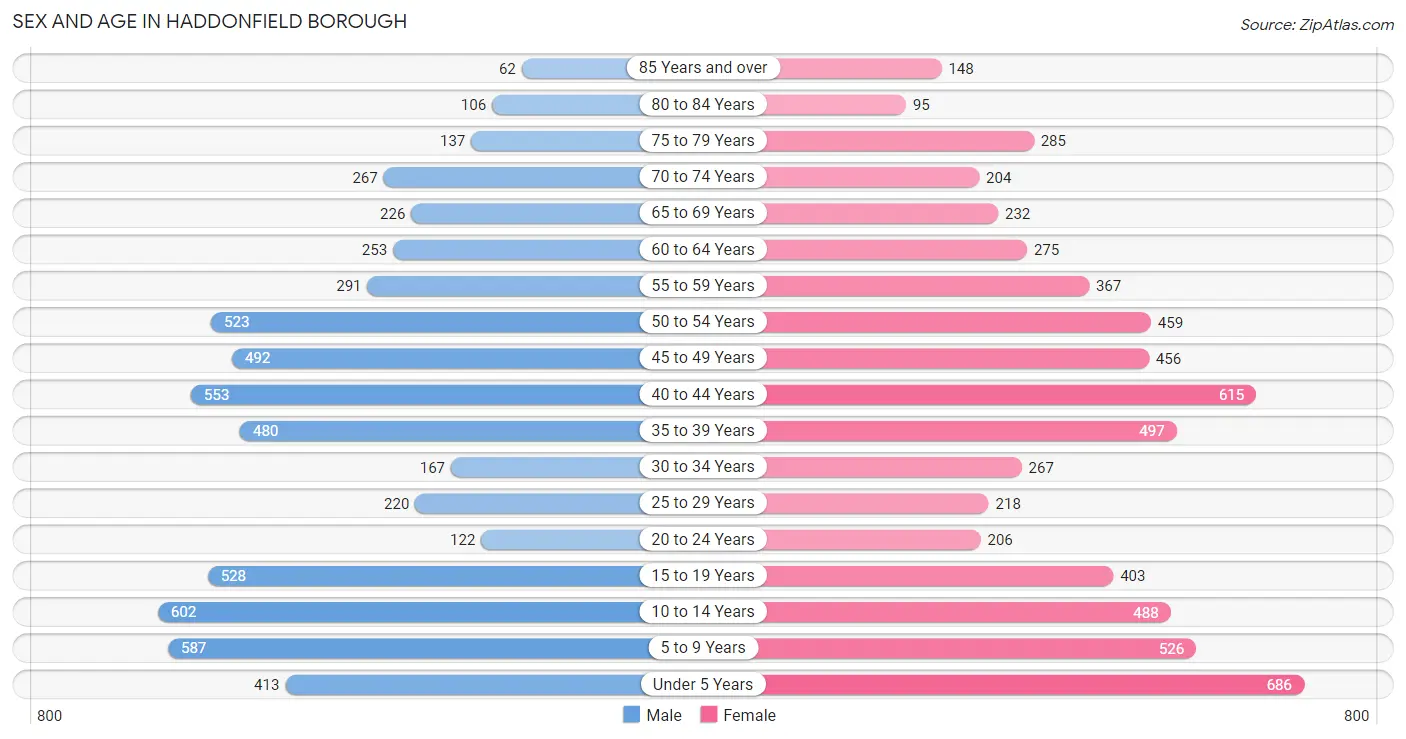
The most populous age groups in Haddonfield borough are 10 to 14 Years (602 | 10.0%) for men and Under 5 Years (686 | 10.7%) for women.
| Age Bracket | Male | Female |
| Under 5 Years | 413 (6.9%) | 686 (10.7%) |
| 5 to 9 Years | 587 (9.7%) | 526 (8.2%) |
| 10 to 14 Years | 602 (10.0%) | 488 (7.6%) |
| 15 to 19 Years | 528 (8.8%) | 403 (6.3%) |
| 20 to 24 Years | 122 (2.0%) | 206 (3.2%) |
| 25 to 29 Years | 220 (3.6%) | 218 (3.4%) |
| 30 to 34 Years | 167 (2.8%) | 267 (4.2%) |
| 35 to 39 Years | 480 (8.0%) | 497 (7.7%) |
| 40 to 44 Years | 553 (9.2%) | 615 (9.6%) |
| 45 to 49 Years | 492 (8.2%) | 456 (7.1%) |
| 50 to 54 Years | 523 (8.7%) | 459 (7.1%) |
| 55 to 59 Years | 291 (4.8%) | 367 (5.7%) |
| 60 to 64 Years | 253 (4.2%) | 275 (4.3%) |
| 65 to 69 Years | 226 (3.7%) | 232 (3.6%) |
| 70 to 74 Years | 267 (4.4%) | 204 (3.2%) |
| 75 to 79 Years | 137 (2.3%) | 285 (4.4%) |
| 80 to 84 Years | 106 (1.8%) | 95 (1.5%) |
| 85 Years and over | 62 (1.0%) | 148 (2.3%) |
| Total | 6,029 (100.0%) | 6,427 (100.0%) |
Families and Households in Haddonfield borough
Median Family Size in Haddonfield borough
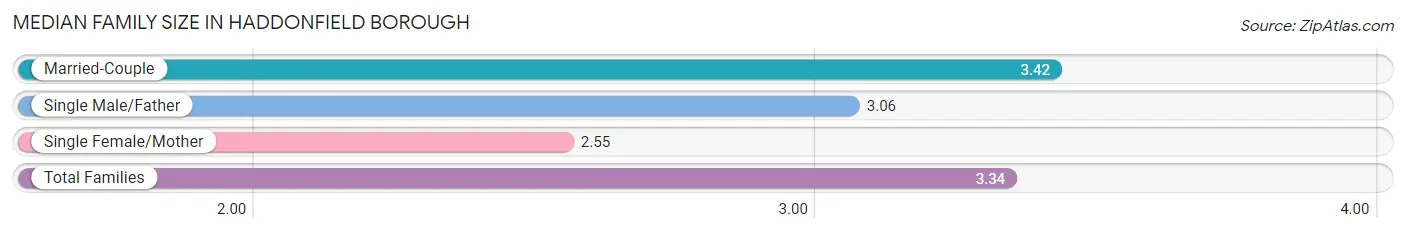
The median family size in Haddonfield borough is 3.34 persons per family, with married-couple families (3,041 | 89.6%) accounting for the largest median family size of 3.42 persons per family. On the other hand, single female/mother families (275 | 8.1%) represent the smallest median family size with 2.55 persons per family.
| Family Type | # Families | Family Size |
| Married-Couple | 3,041 (89.6%) | 3.42 |
| Single Male/Father | 77 (2.3%) | 3.06 |
| Single Female/Mother | 275 (8.1%) | 2.55 |
| Total Families | 3,393 (100.0%) | 3.34 |
Median Household Size in Haddonfield borough
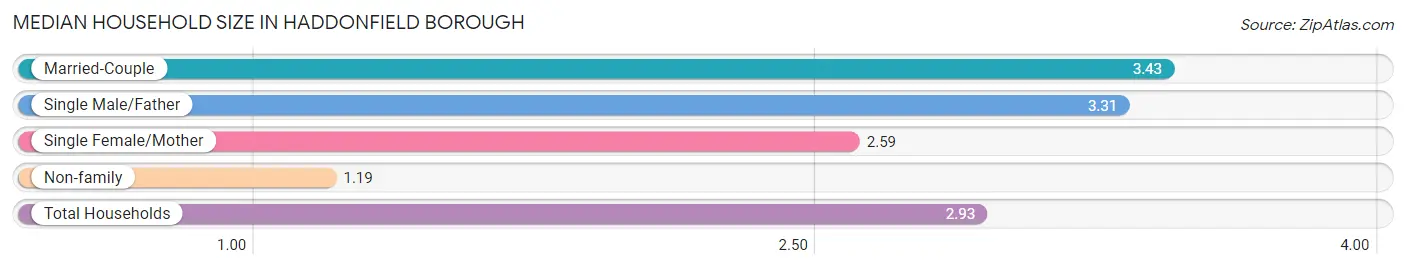
The median household size in Haddonfield borough is 2.93 persons per household, with married-couple households (3,041 | 71.9%) accounting for the largest median household size of 3.43 persons per household. non-family households (839 | 19.8%) represent the smallest median household size with 1.19 persons per household.
| Household Type | # Households | Household Size |
| Married-Couple | 3,041 (71.9%) | 3.43 |
| Single Male/Father | 77 (1.8%) | 3.31 |
| Single Female/Mother | 275 (6.5%) | 2.59 |
| Non-family | 839 (19.8%) | 1.19 |
| Total Households | 4,232 (100.0%) | 2.93 |
Household Size by Marriage Status in Haddonfield borough
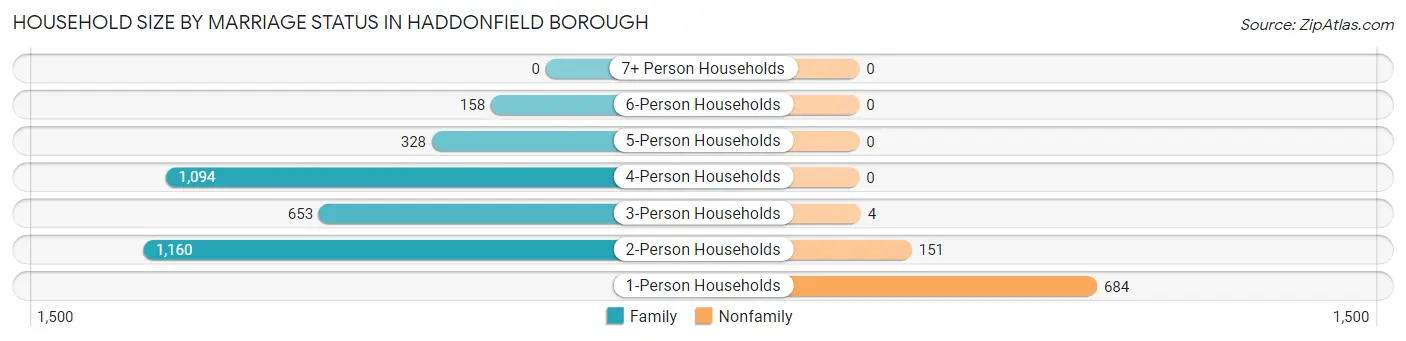
Out of a total of 4,232 households in Haddonfield borough, 3,393 (80.2%) are family households, while 839 (19.8%) are nonfamily households. The most numerous type of family households are 2-person households, comprising 1,160, and the most common type of nonfamily households are 1-person households, comprising 684.
| Household Size | Family Households | Nonfamily Households |
| 1-Person Households | - | 684 (16.2%) |
| 2-Person Households | 1,160 (27.4%) | 151 (3.6%) |
| 3-Person Households | 653 (15.4%) | 4 (0.1%) |
| 4-Person Households | 1,094 (25.9%) | 0 (0.0%) |
| 5-Person Households | 328 (7.7%) | 0 (0.0%) |
| 6-Person Households | 158 (3.7%) | 0 (0.0%) |
| 7+ Person Households | 0 (0.0%) | 0 (0.0%) |
| Total | 3,393 (80.2%) | 839 (19.8%) |
Female Fertility in Haddonfield borough
Fertility by Age in Haddonfield borough
Average fertility rate in Haddonfield borough is 45.0 births per 1,000 women. Women in the age bracket of 35 to 50 years have the highest fertility rate with 55.0 births per 1,000 women. Women in the age bracket of 35 to 50 years acount for 74.0% of all women with births.
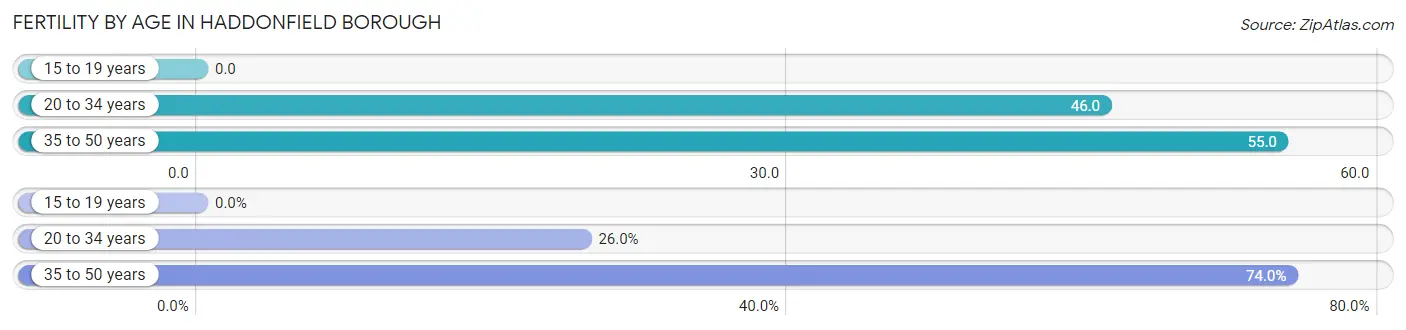
| Age Bracket | Women with Births | Births / 1,000 Women |
| 15 to 19 years | 0 (0.0%) | 0.0 |
| 20 to 34 years | 32 (26.0%) | 46.0 |
| 35 to 50 years | 91 (74.0%) | 55.0 |
| Total | 123 (100.0%) | 45.0 |
Fertility by Age by Marriage Status in Haddonfield borough
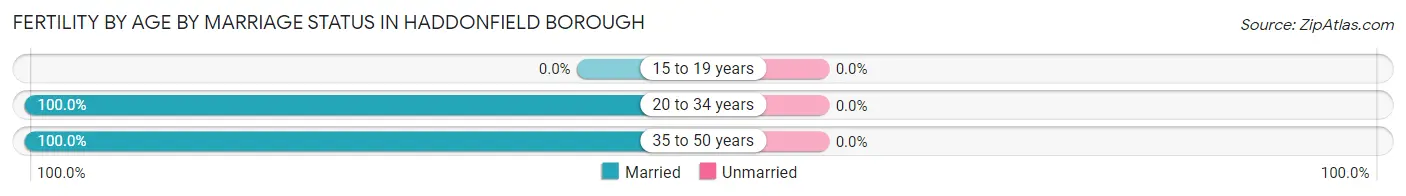
| Age Bracket | Married | Unmarried |
| 15 to 19 years | 0 (0.0%) | 0 (0.0%) |
| 20 to 34 years | 32 (100.0%) | 0 (0.0%) |
| 35 to 50 years | 91 (100.0%) | 0 (0.0%) |
| Total | 123 (100.0%) | 0 (0.0%) |
Fertility by Education in Haddonfield borough
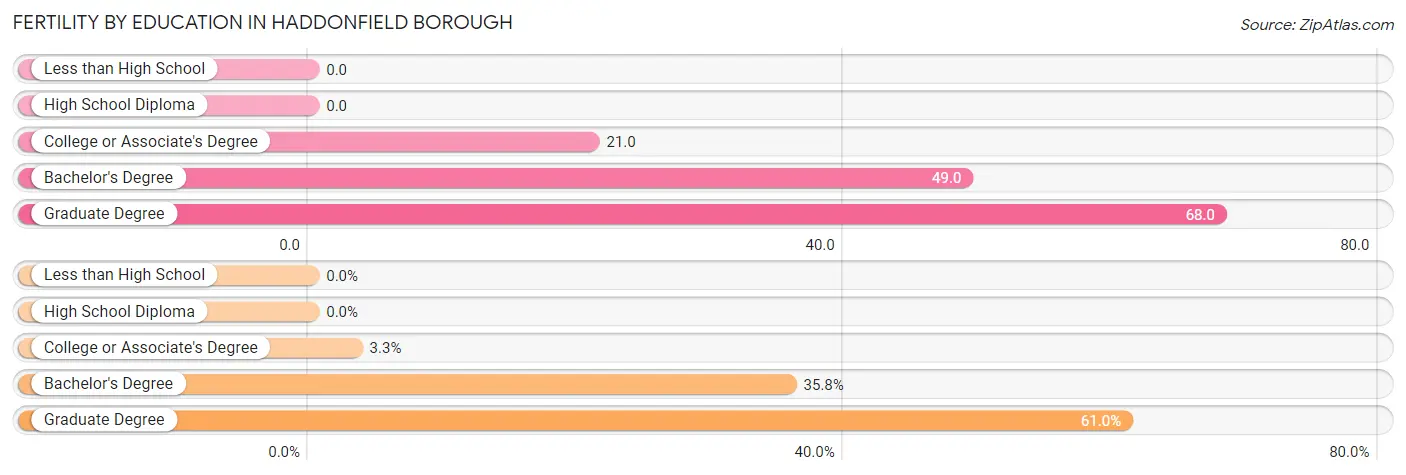
| Educational Attainment | Women with Births | Births / 1,000 Women |
| Less than High School | 0 (0.0%) | 0.0 |
| High School Diploma | 0 (0.0%) | 0.0 |
| College or Associate's Degree | 4 (3.3%) | 21.0 |
| Bachelor's Degree | 44 (35.8%) | 49.0 |
| Graduate Degree | 75 (61.0%) | 68.0 |
| Total | 123 (100.0%) | 45.0 |
Fertility by Education by Marriage Status in Haddonfield borough
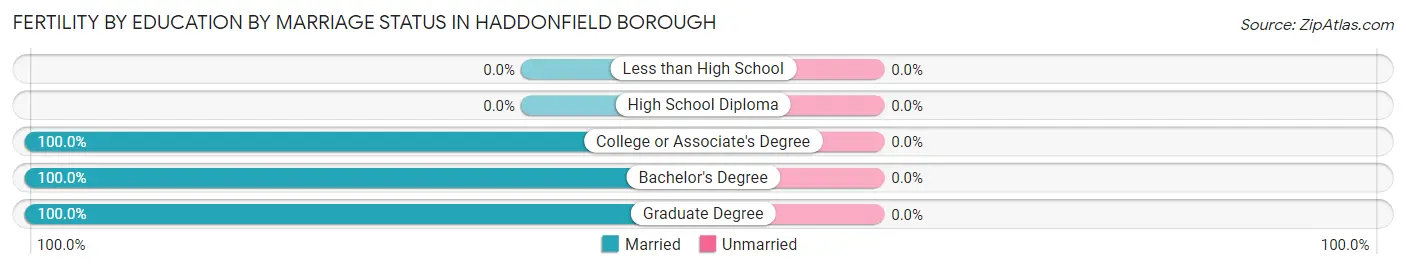
| Educational Attainment | Married | Unmarried |
| Less than High School | 0 (0.0%) | 0 (0.0%) |
| High School Diploma | 0 (0.0%) | 0 (0.0%) |
| College or Associate's Degree | 4 (100.0%) | 0 (0.0%) |
| Bachelor's Degree | 44 (100.0%) | 0 (0.0%) |
| Graduate Degree | 75 (100.0%) | 0 (0.0%) |
| Total | 123 (100.0%) | 0 (0.0%) |
Employment Characteristics in Haddonfield borough
Employment by Class of Employer in Haddonfield borough
Among the 5,884 employed individuals in Haddonfield borough, private company employees (3,383 | 57.5%), not-for-profit organizations (771 | 13.1%), and local government employees (439 | 7.5%) make up the most common classes of employment.
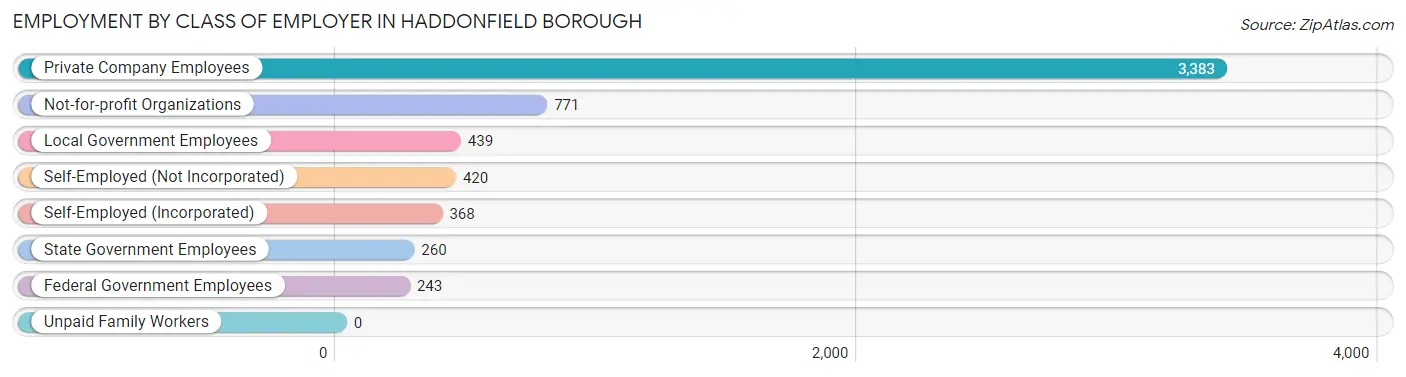
| Employer Class | # Employees | % Employees |
| Private Company Employees | 3,383 | 57.5% |
| Self-Employed (Incorporated) | 368 | 6.2% |
| Self-Employed (Not Incorporated) | 420 | 7.1% |
| Not-for-profit Organizations | 771 | 13.1% |
| Local Government Employees | 439 | 7.5% |
| State Government Employees | 260 | 4.4% |
| Federal Government Employees | 243 | 4.1% |
| Unpaid Family Workers | 0 | 0.0% |
| Total | 5,884 | 100.0% |
Employment Status by Age in Haddonfield borough
According to the labor force statistics for Haddonfield borough, out of the total population over 16 years of age (8,917), 70.0% or 6,242 individuals are in the labor force, with 3.4% or 212 of them unemployed. The age group with the highest labor force participation rate is 35 to 44 years, with 91.9% or 1,971 individuals in the labor force. Within the labor force, the 30 to 34 years age range has the highest percentage of unemployed individuals, with 9.5% or 38 of them being unemployed.
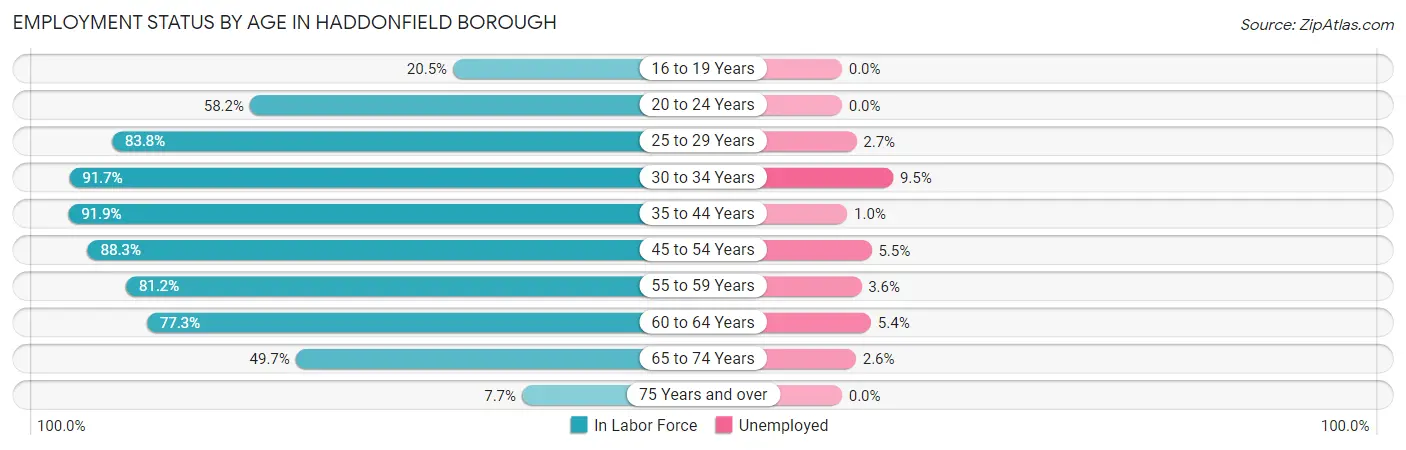
| Age Bracket | In Labor Force | Unemployed |
| 16 to 19 Years | 142 (20.5%) | 0 (0.0%) |
| 20 to 24 Years | 191 (58.2%) | 0 (0.0%) |
| 25 to 29 Years | 367 (83.8%) | 10 (2.7%) |
| 30 to 34 Years | 398 (91.7%) | 38 (9.5%) |
| 35 to 44 Years | 1,971 (91.9%) | 20 (1.0%) |
| 45 to 54 Years | 1,704 (88.3%) | 94 (5.5%) |
| 55 to 59 Years | 534 (81.2%) | 19 (3.6%) |
| 60 to 64 Years | 408 (77.3%) | 22 (5.4%) |
| 65 to 74 Years | 462 (49.7%) | 12 (2.6%) |
| 75 Years and over | 64 (7.7%) | 0 (0.0%) |
| Total | 6,242 (70.0%) | 212 (3.4%) |
Employment Status by Educational Attainment in Haddonfield borough
According to labor force statistics for Haddonfield borough, 87.8% of individuals (5,385) out of the total population between 25 and 64 years of age (6,133) are in the labor force, with 3.7% or 199 of them being unemployed. The group with the highest labor force participation rate are those with the educational attainment of bachelor's degree or higher, with 89.6% or 4,662 individuals in the labor force. Within the labor force, individuals with less than high school education have the highest percentage of unemployment, with 38.0% or 19 of them being unemployed.
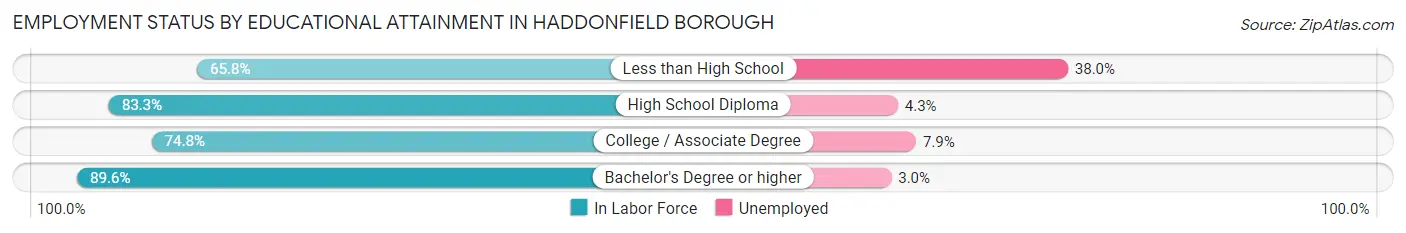
| Educational Attainment | In Labor Force | Unemployed |
| Less than High School | 50 (65.8%) | 29 (38.0%) |
| High School Diploma | 305 (83.3%) | 16 (4.3%) |
| College / Associate Degree | 365 (74.8%) | 39 (7.9%) |
| Bachelor's Degree or higher | 4,662 (89.6%) | 156 (3.0%) |
| Total | 5,385 (87.8%) | 227 (3.7%) |
Employment Occupations by Sex in Haddonfield borough
Management, Business, Science and Arts Occupations
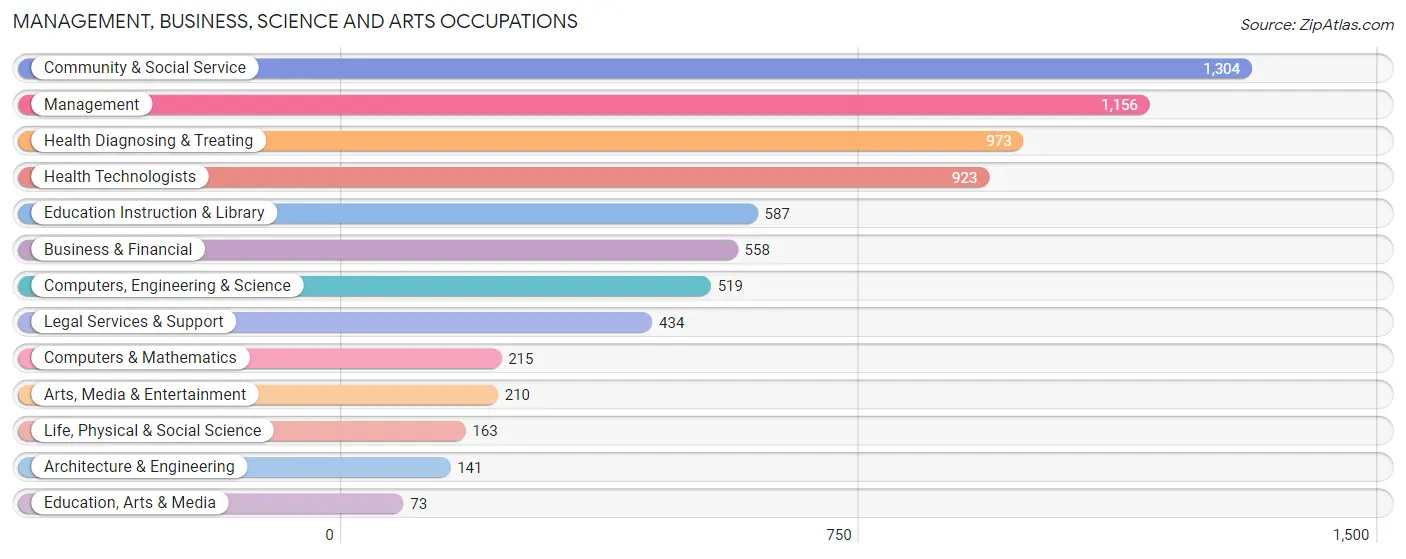
The most common Management, Business, Science and Arts occupations in Haddonfield borough are Community & Social Service (1,304 | 21.7%), Management (1,156 | 19.2%), Health Diagnosing & Treating (973 | 16.2%), Health Technologists (923 | 15.3%), and Education Instruction & Library (587 | 9.8%).
Management, Business, Science and Arts Occupations by Sex
Within the Management, Business, Science and Arts occupations in Haddonfield borough, the most male-oriented occupations are Architecture & Engineering (88.6%), Legal Services & Support (77.0%), and Computers, Engineering & Science (69.4%), while the most female-oriented occupations are Education, Arts & Media (83.6%), Education Instruction & Library (76.3%), and Arts, Media & Entertainment (70.0%).
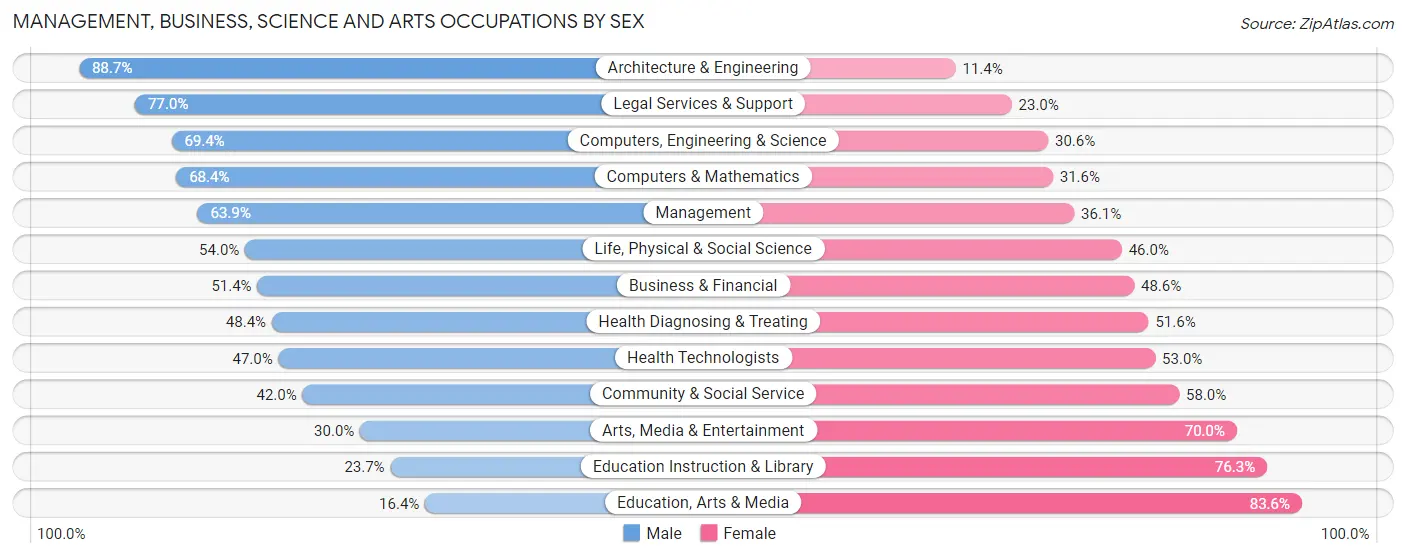
| Occupation | Male | Female |
| Management | 739 (63.9%) | 417 (36.1%) |
| Business & Financial | 287 (51.4%) | 271 (48.6%) |
| Computers, Engineering & Science | 360 (69.4%) | 159 (30.6%) |
| Computers & Mathematics | 147 (68.4%) | 68 (31.6%) |
| Architecture & Engineering | 125 (88.6%) | 16 (11.4%) |
| Life, Physical & Social Science | 88 (54.0%) | 75 (46.0%) |
| Community & Social Service | 548 (42.0%) | 756 (58.0%) |
| Education, Arts & Media | 12 (16.4%) | 61 (83.6%) |
| Legal Services & Support | 334 (77.0%) | 100 (23.0%) |
| Education Instruction & Library | 139 (23.7%) | 448 (76.3%) |
| Arts, Media & Entertainment | 63 (30.0%) | 147 (70.0%) |
| Health Diagnosing & Treating | 471 (48.4%) | 502 (51.6%) |
| Health Technologists | 434 (47.0%) | 489 (53.0%) |
| Total (Category) | 2,405 (53.3%) | 2,105 (46.7%) |
| Total (Overall) | 3,196 (53.1%) | 2,817 (46.9%) |
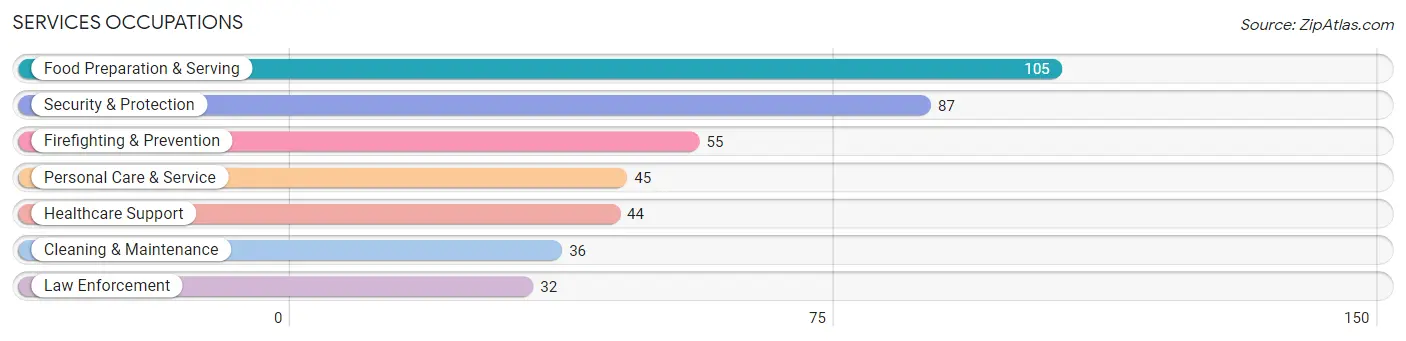
Services Occupations
The most common Services occupations in Haddonfield borough are Food Preparation & Serving (105 | 1.8%), Security & Protection (87 | 1.5%), Firefighting & Prevention (55 | 0.9%), Personal Care & Service (45 | 0.7%), and Healthcare Support (44 | 0.7%).
Services Occupations by Sex
Within the Services occupations in Haddonfield borough, the most male-oriented occupations are Cleaning & Maintenance (100.0%), Law Enforcement (53.1%), and Healthcare Support (52.3%), while the most female-oriented occupations are Personal Care & Service (86.7%), Food Preparation & Serving (67.6%), and Firefighting & Prevention (67.3%).
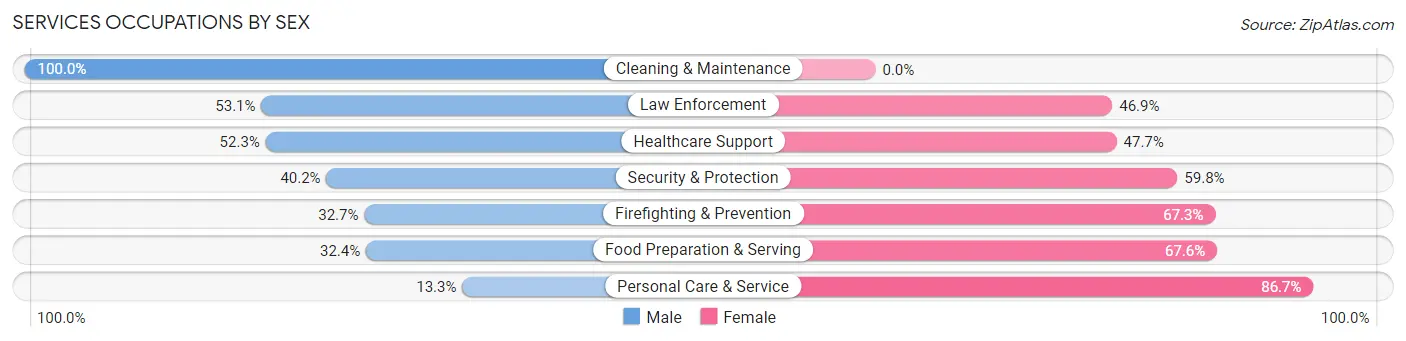
| Occupation | Male | Female |
| Healthcare Support | 23 (52.3%) | 21 (47.7%) |
| Security & Protection | 35 (40.2%) | 52 (59.8%) |
| Firefighting & Prevention | 18 (32.7%) | 37 (67.3%) |
| Law Enforcement | 17 (53.1%) | 15 (46.9%) |
| Food Preparation & Serving | 34 (32.4%) | 71 (67.6%) |
| Cleaning & Maintenance | 36 (100.0%) | 0 (0.0%) |
| Personal Care & Service | 6 (13.3%) | 39 (86.7%) |
| Total (Category) | 134 (42.3%) | 183 (57.7%) |
| Total (Overall) | 3,196 (53.1%) | 2,817 (46.9%) |
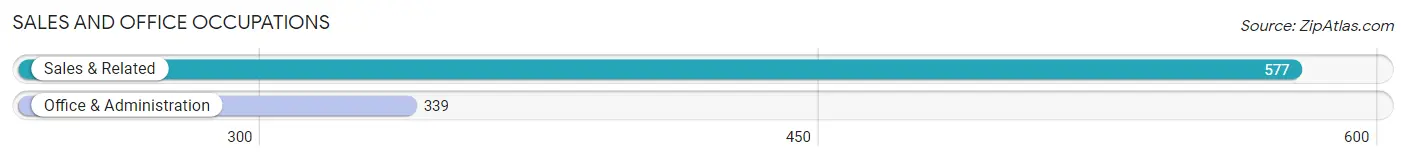
Sales and Office Occupations
The most common Sales and Office occupations in Haddonfield borough are Sales & Related (577 | 9.6%), and Office & Administration (339 | 5.6%).
Sales and Office Occupations by Sex
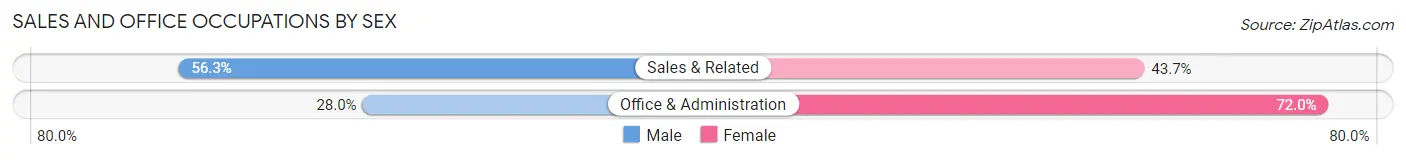
| Occupation | Male | Female |
| Sales & Related | 325 (56.3%) | 252 (43.7%) |
| Office & Administration | 95 (28.0%) | 244 (72.0%) |
| Total (Category) | 420 (45.9%) | 496 (54.1%) |
| Total (Overall) | 3,196 (53.1%) | 2,817 (46.9%) |
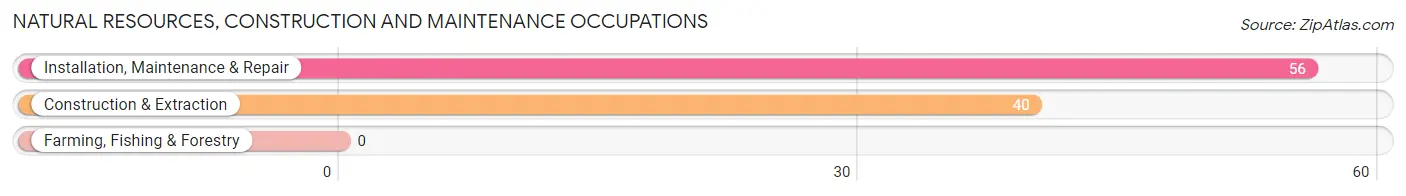
Natural Resources, Construction and Maintenance Occupations
The most common Natural Resources, Construction and Maintenance occupations in Haddonfield borough are Installation, Maintenance & Repair (56 | 0.9%), and Construction & Extraction (40 | 0.7%).
Natural Resources, Construction and Maintenance Occupations by Sex
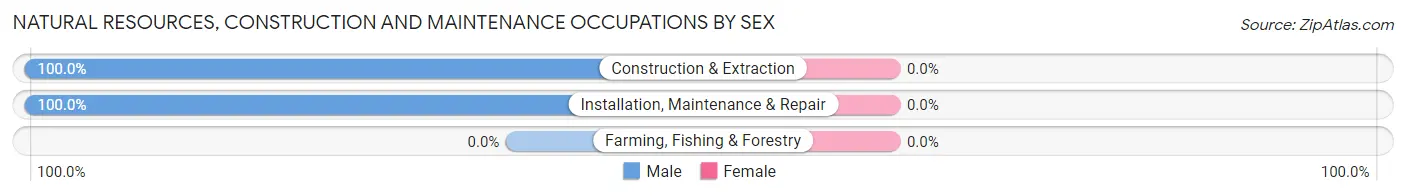
| Occupation | Male | Female |
| Farming, Fishing & Forestry | 0 (0.0%) | 0 (0.0%) |
| Construction & Extraction | 40 (100.0%) | 0 (0.0%) |
| Installation, Maintenance & Repair | 56 (100.0%) | 0 (0.0%) |
| Total (Category) | 96 (100.0%) | 0 (0.0%) |
| Total (Overall) | 3,196 (53.1%) | 2,817 (46.9%) |
Production, Transportation and Moving Occupations
The most common Production, Transportation and Moving occupations in Haddonfield borough are Transportation (90 | 1.5%), Production (56 | 0.9%), and Material Moving (28 | 0.5%).
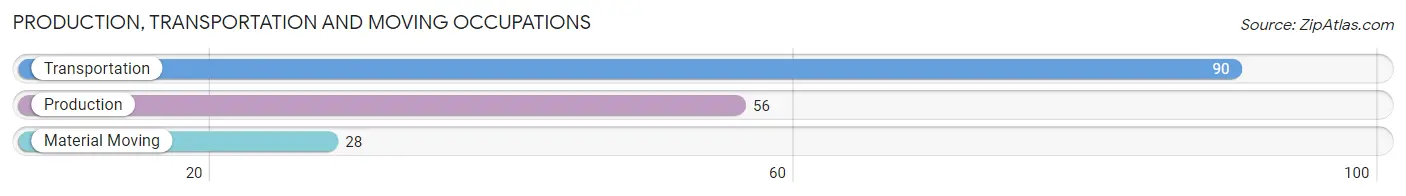
Production, Transportation and Moving Occupations by Sex
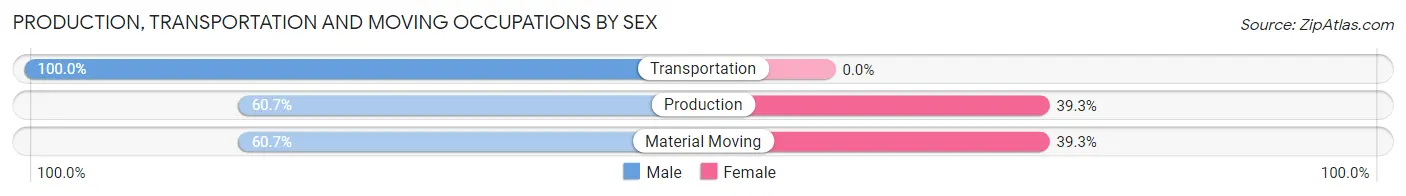
| Occupation | Male | Female |
| Production | 34 (60.7%) | 22 (39.3%) |
| Transportation | 90 (100.0%) | 0 (0.0%) |
| Material Moving | 17 (60.7%) | 11 (39.3%) |
| Total (Category) | 141 (81.0%) | 33 (19.0%) |
| Total (Overall) | 3,196 (53.1%) | 2,817 (46.9%) |
Employment Industries by Sex in Haddonfield borough
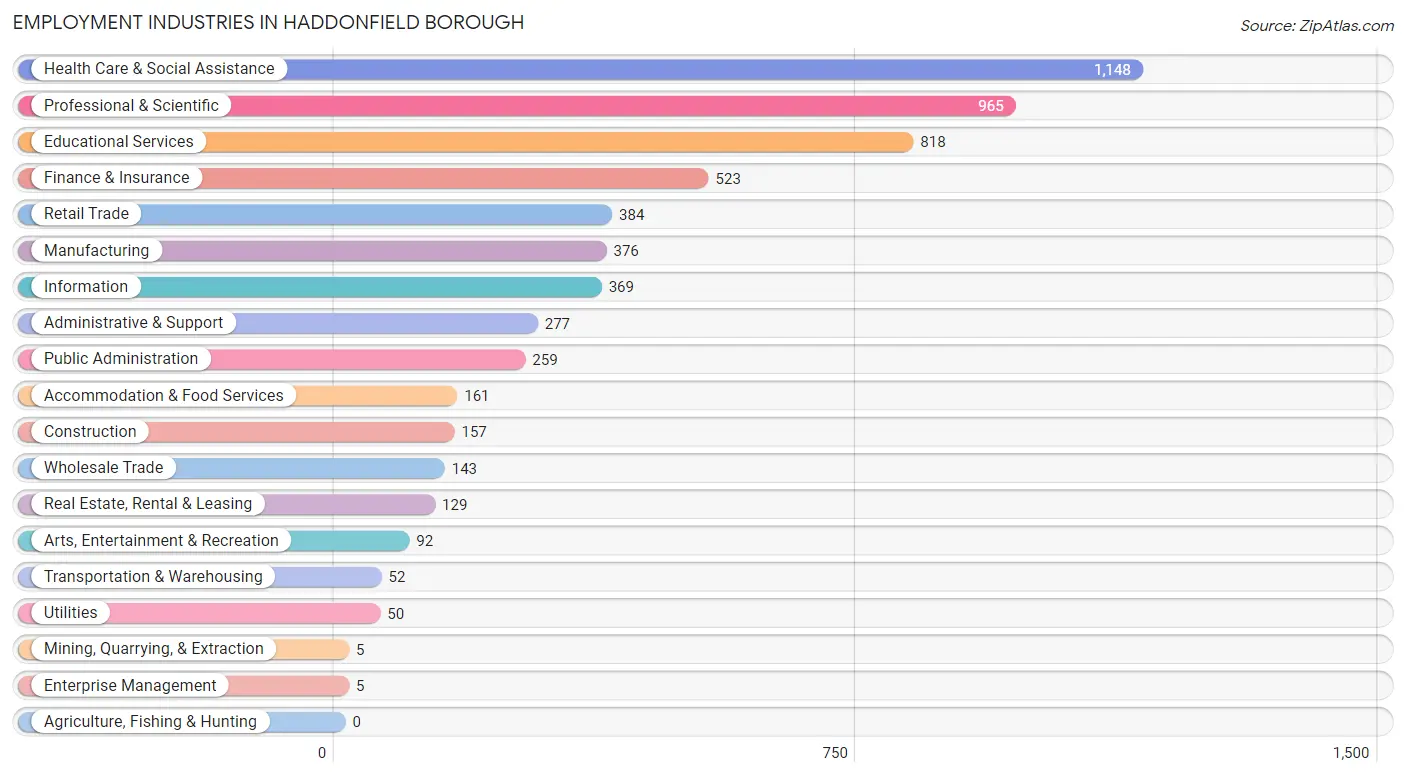
Employment Industries in Haddonfield borough
The major employment industries in Haddonfield borough include Health Care & Social Assistance (1,148 | 19.1%), Professional & Scientific (965 | 16.1%), Educational Services (818 | 13.6%), Finance & Insurance (523 | 8.7%), and Retail Trade (384 | 6.4%).
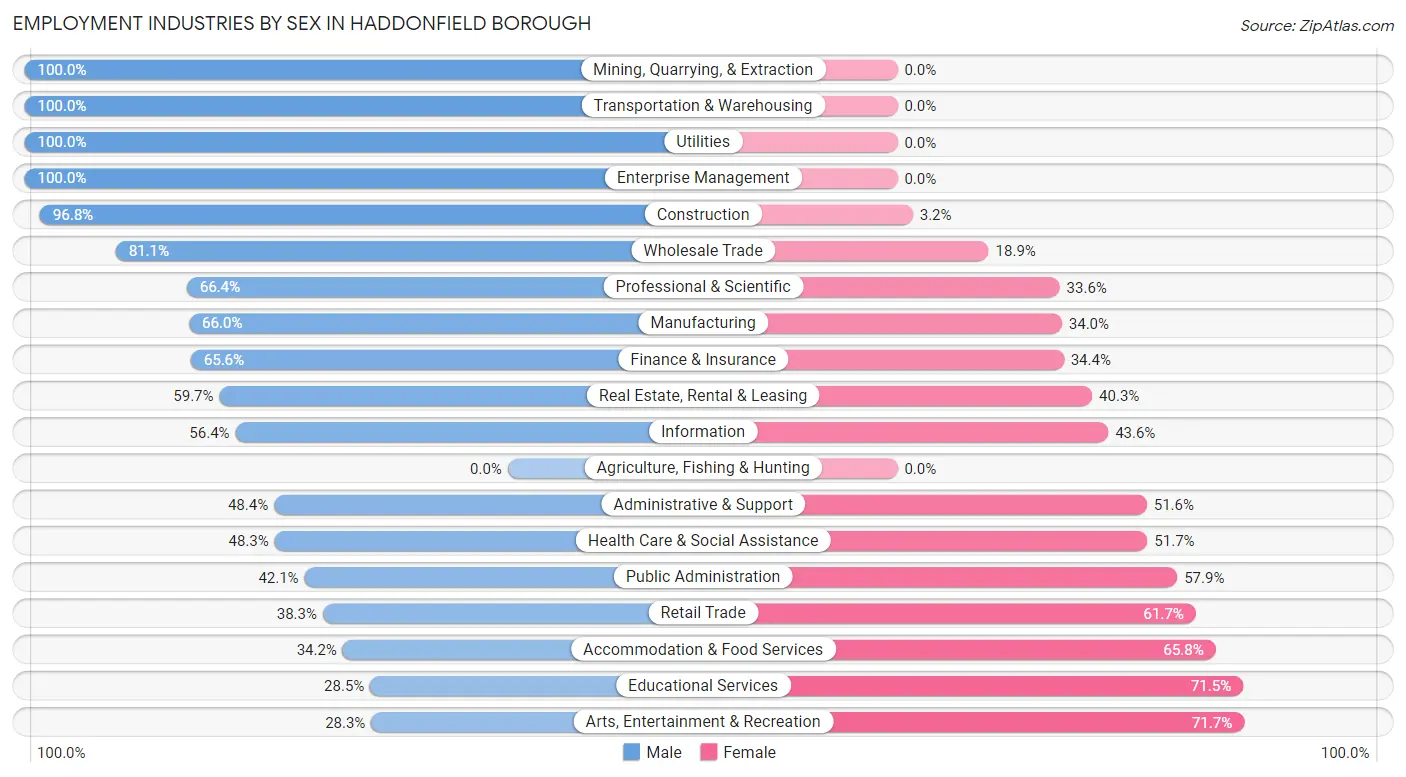
Employment Industries by Sex in Haddonfield borough
The Haddonfield borough industries that see more men than women are Mining, Quarrying, & Extraction (100.0%), Transportation & Warehousing (100.0%), and Utilities (100.0%), whereas the industries that tend to have a higher number of women are Arts, Entertainment & Recreation (71.7%), Educational Services (71.5%), and Accommodation & Food Services (65.8%).
| Industry | Male | Female |
| Agriculture, Fishing & Hunting | 0 (0.0%) | 0 (0.0%) |
| Mining, Quarrying, & Extraction | 5 (100.0%) | 0 (0.0%) |
| Construction | 152 (96.8%) | 5 (3.2%) |
| Manufacturing | 248 (66.0%) | 128 (34.0%) |
| Wholesale Trade | 116 (81.1%) | 27 (18.9%) |
| Retail Trade | 147 (38.3%) | 237 (61.7%) |
| Transportation & Warehousing | 52 (100.0%) | 0 (0.0%) |
| Utilities | 50 (100.0%) | 0 (0.0%) |
| Information | 208 (56.4%) | 161 (43.6%) |
| Finance & Insurance | 343 (65.6%) | 180 (34.4%) |
| Real Estate, Rental & Leasing | 77 (59.7%) | 52 (40.3%) |
| Professional & Scientific | 641 (66.4%) | 324 (33.6%) |
| Enterprise Management | 5 (100.0%) | 0 (0.0%) |
| Administrative & Support | 134 (48.4%) | 143 (51.6%) |
| Educational Services | 233 (28.5%) | 585 (71.5%) |
| Health Care & Social Assistance | 554 (48.3%) | 594 (51.7%) |
| Arts, Entertainment & Recreation | 26 (28.3%) | 66 (71.7%) |
| Accommodation & Food Services | 55 (34.2%) | 106 (65.8%) |
| Public Administration | 109 (42.1%) | 150 (57.9%) |
| Total | 3,196 (53.1%) | 2,817 (46.9%) |
Education in Haddonfield borough
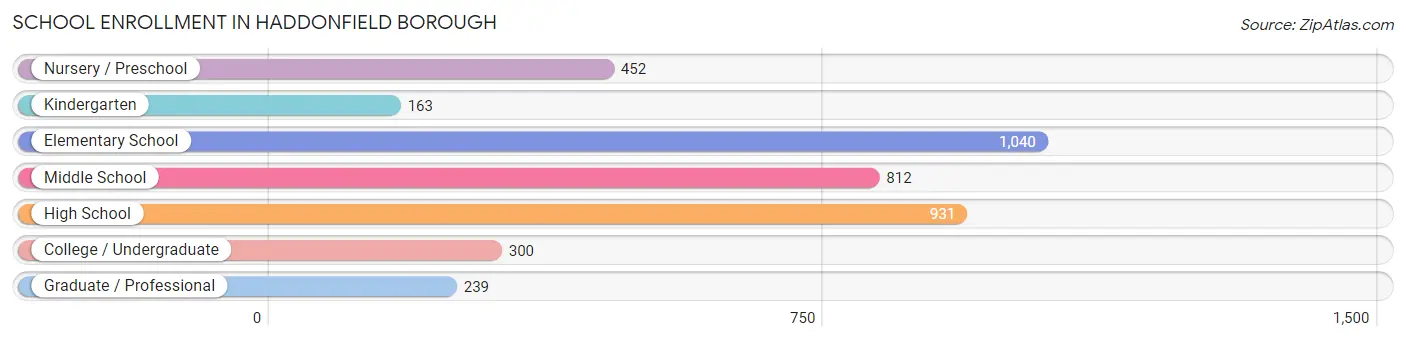
School Enrollment in Haddonfield borough
The most common levels of schooling among the 3,937 students in Haddonfield borough are elementary school (1,040 | 26.4%), high school (931 | 23.6%), and middle school (812 | 20.6%).
| School Level | # Students | % Students |
| Nursery / Preschool | 452 | 11.5% |
| Kindergarten | 163 | 4.1% |
| Elementary School | 1,040 | 26.4% |
| Middle School | 812 | 20.6% |
| High School | 931 | 23.6% |
| College / Undergraduate | 300 | 7.6% |
| Graduate / Professional | 239 | 6.1% |
| Total | 3,937 | 100.0% |
School Enrollment by Age by Funding Source in Haddonfield borough
Out of a total of 3,937 students who are enrolled in schools in Haddonfield borough, 870 (22.1%) attend a private institution, while the remaining 3,067 (77.9%) are enrolled in public schools. The age group of 3 to 4 year olds has the highest likelihood of being enrolled in private schools, with 279 (79.3% in the age bracket) enrolled. Conversely, the age group of 15 to 17 year olds has the lowest likelihood of being enrolled in a private school, with 775 (96.0% in the age bracket) attending a public institution.
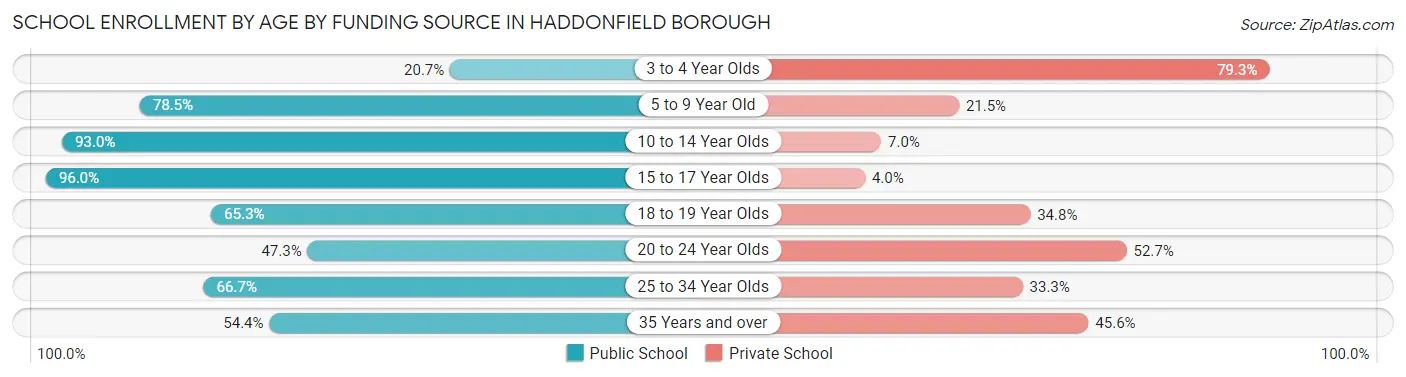
| Age Bracket | Public School | Private School |
| 3 to 4 Year Olds | 73 (20.7%) | 279 (79.3%) |
| 5 to 9 Year Old | 874 (78.5%) | 239 (21.5%) |
| 10 to 14 Year Olds | 1,014 (93.0%) | 76 (7.0%) |
| 15 to 17 Year Olds | 775 (96.0%) | 32 (4.0%) |
| 18 to 19 Year Olds | 77 (65.2%) | 41 (34.7%) |
| 20 to 24 Year Olds | 88 (47.3%) | 98 (52.7%) |
| 25 to 34 Year Olds | 90 (66.7%) | 45 (33.3%) |
| 35 Years and over | 74 (54.4%) | 62 (45.6%) |
| Total | 3,067 (77.9%) | 870 (22.1%) |
Educational Attainment by Field of Study in Haddonfield borough
Business (1,147 | 16.2%), social sciences (967 | 13.6%), science & technology (648 | 9.1%), bio, nature & agricultural (641 | 9.0%), and education (518 | 7.3%) are the most common fields of study among 7,099 individuals in Haddonfield borough who have obtained a bachelor's degree or higher.
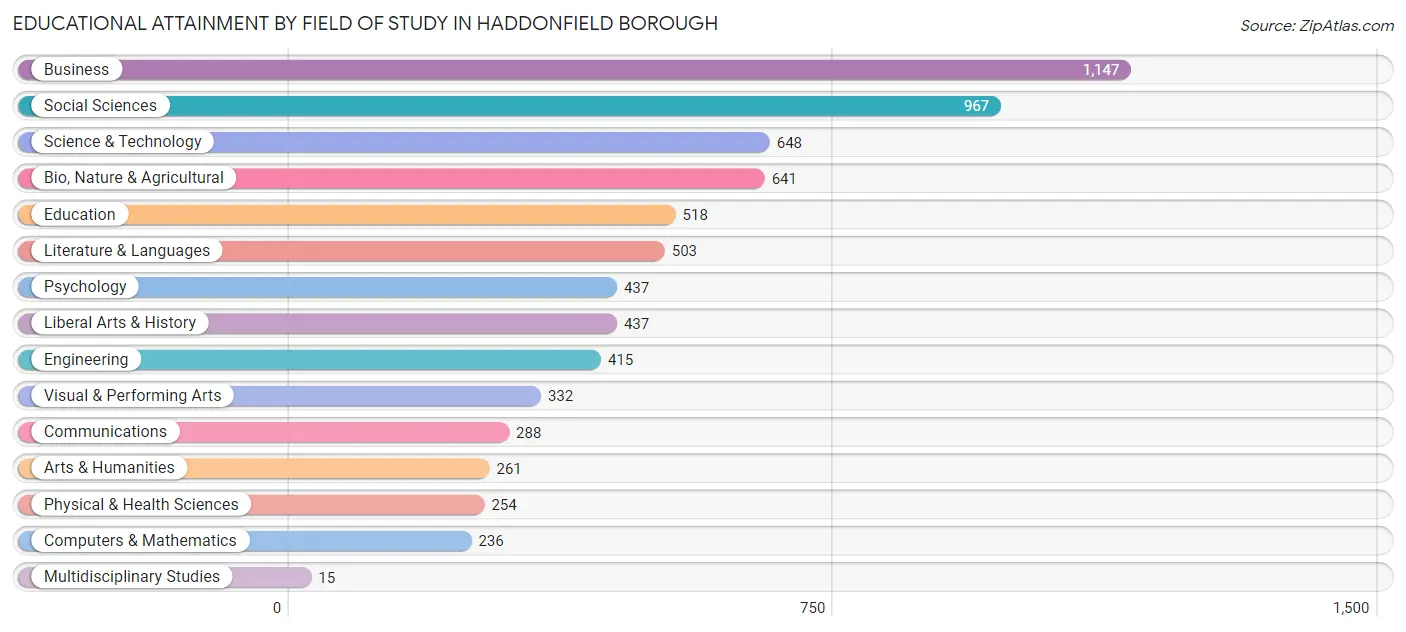
| Field of Study | # Graduates | % Graduates |
| Computers & Mathematics | 236 | 3.3% |
| Bio, Nature & Agricultural | 641 | 9.0% |
| Physical & Health Sciences | 254 | 3.6% |
| Psychology | 437 | 6.2% |
| Social Sciences | 967 | 13.6% |
| Engineering | 415 | 5.9% |
| Multidisciplinary Studies | 15 | 0.2% |
| Science & Technology | 648 | 9.1% |
| Business | 1,147 | 16.2% |
| Education | 518 | 7.3% |
| Literature & Languages | 503 | 7.1% |
| Liberal Arts & History | 437 | 6.2% |
| Visual & Performing Arts | 332 | 4.7% |
| Communications | 288 | 4.1% |
| Arts & Humanities | 261 | 3.7% |
| Total | 7,099 | 100.0% |
Transportation & Commute in Haddonfield borough
Vehicle Availability by Sex in Haddonfield borough
The most prevalent vehicle ownership categories in Haddonfield borough are males with 2 vehicles (1,959, accounting for 61.9%) and females with 2 vehicles (1,567, making up 72.2%).
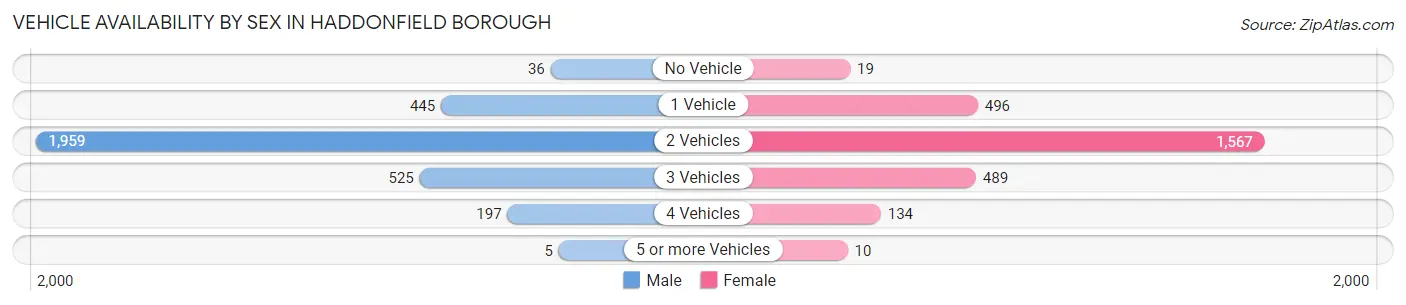
| Vehicles Available | Male | Female |
| No Vehicle | 36 (1.1%) | 19 (0.7%) |
| 1 Vehicle | 445 (14.1%) | 496 (18.3%) |
| 2 Vehicles | 1,959 (61.9%) | 1,567 (57.7%) |
| 3 Vehicles | 525 (16.6%) | 489 (18.0%) |
| 4 Vehicles | 197 (6.2%) | 134 (4.9%) |
| 5 or more Vehicles | 5 (0.2%) | 10 (0.4%) |
| Total | 3,167 (100.0%) | 2,715 (100.0%) |
Commute Time in Haddonfield borough
The most frequently occuring commute durations in Haddonfield borough are 20 to 24 minutes (615 commuters, 13.8%), 15 to 19 minutes (590 commuters, 13.2%), and 30 to 34 minutes (576 commuters, 12.9%).
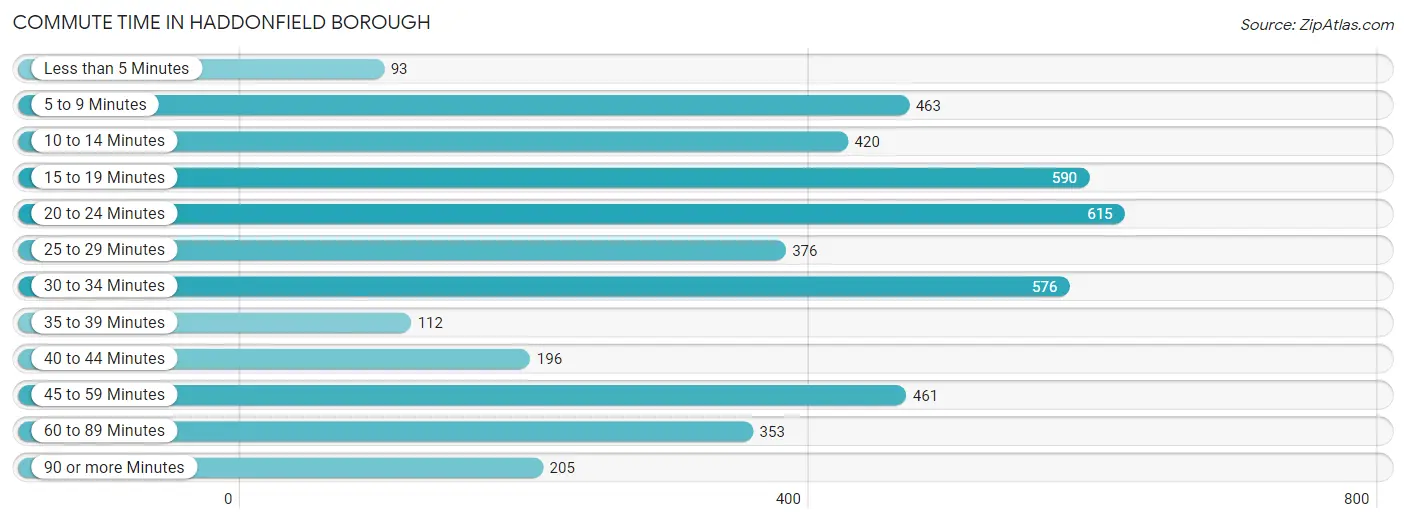
| Commute Time | # Commuters | % Commuters |
| Less than 5 Minutes | 93 | 2.1% |
| 5 to 9 Minutes | 463 | 10.4% |
| 10 to 14 Minutes | 420 | 9.4% |
| 15 to 19 Minutes | 590 | 13.2% |
| 20 to 24 Minutes | 615 | 13.8% |
| 25 to 29 Minutes | 376 | 8.4% |
| 30 to 34 Minutes | 576 | 12.9% |
| 35 to 39 Minutes | 112 | 2.5% |
| 40 to 44 Minutes | 196 | 4.4% |
| 45 to 59 Minutes | 461 | 10.3% |
| 60 to 89 Minutes | 353 | 7.9% |
| 90 or more Minutes | 205 | 4.6% |
Commute Time by Sex in Haddonfield borough
The most common commute times in Haddonfield borough are 30 to 34 minutes (396 commuters, 15.4%) for males and 5 to 9 minutes (279 commuters, 14.7%) for females.
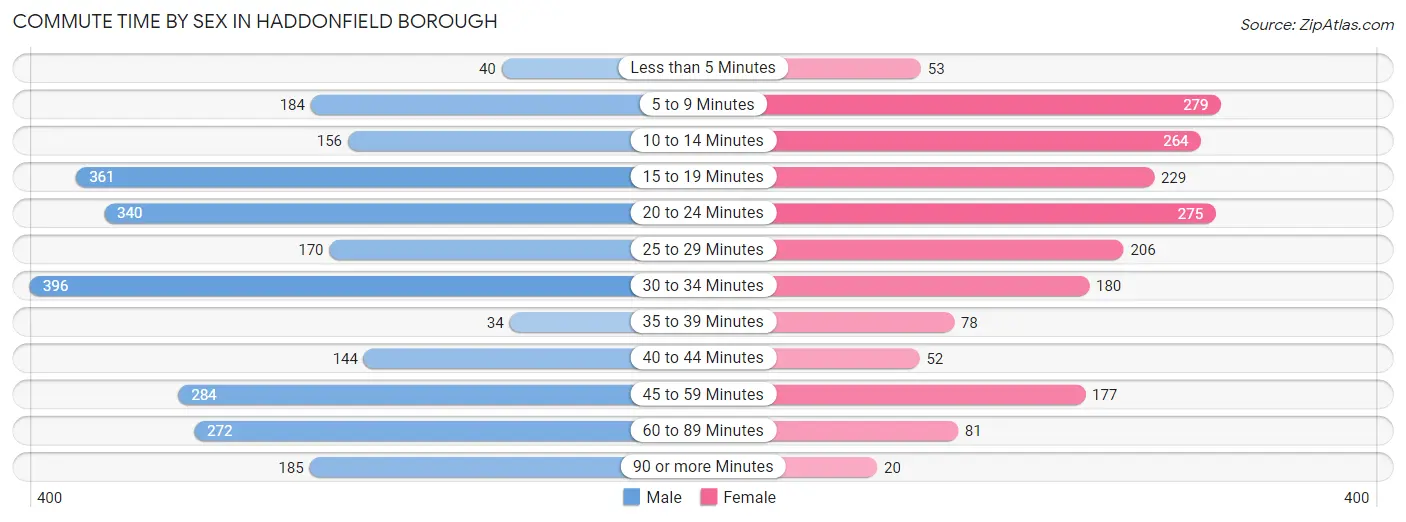
| Commute Time | Male | Female |
| Less than 5 Minutes | 40 (1.6%) | 53 (2.8%) |
| 5 to 9 Minutes | 184 (7.2%) | 279 (14.7%) |
| 10 to 14 Minutes | 156 (6.1%) | 264 (13.9%) |
| 15 to 19 Minutes | 361 (14.1%) | 229 (12.1%) |
| 20 to 24 Minutes | 340 (13.3%) | 275 (14.5%) |
| 25 to 29 Minutes | 170 (6.6%) | 206 (10.9%) |
| 30 to 34 Minutes | 396 (15.4%) | 180 (9.5%) |
| 35 to 39 Minutes | 34 (1.3%) | 78 (4.1%) |
| 40 to 44 Minutes | 144 (5.6%) | 52 (2.8%) |
| 45 to 59 Minutes | 284 (11.1%) | 177 (9.3%) |
| 60 to 89 Minutes | 272 (10.6%) | 81 (4.3%) |
| 90 or more Minutes | 185 (7.2%) | 20 (1.1%) |
Time of Departure to Work by Sex in Haddonfield borough
The most frequent times of departure to work in Haddonfield borough are 8:00 AM to 8:29 AM (558, 21.7%) for males and 8:00 AM to 8:29 AM (584, 30.8%) for females.
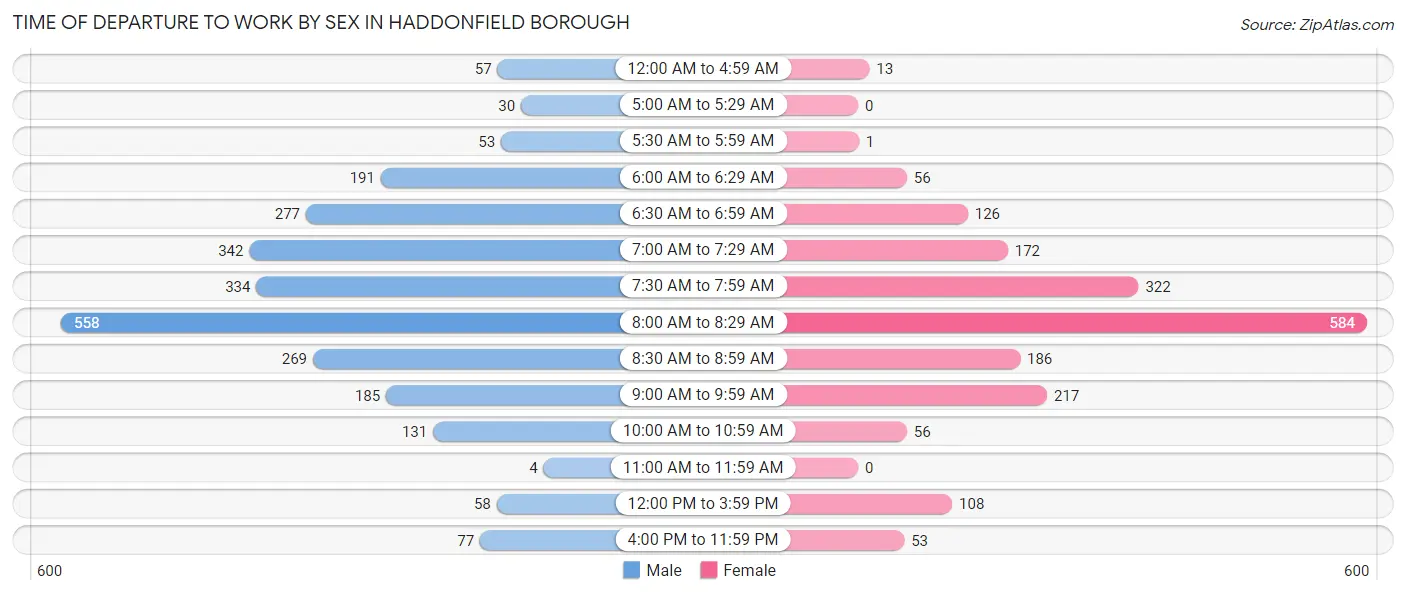
| Time of Departure | Male | Female |
| 12:00 AM to 4:59 AM | 57 (2.2%) | 13 (0.7%) |
| 5:00 AM to 5:29 AM | 30 (1.2%) | 0 (0.0%) |
| 5:30 AM to 5:59 AM | 53 (2.1%) | 1 (0.1%) |
| 6:00 AM to 6:29 AM | 191 (7.4%) | 56 (3.0%) |
| 6:30 AM to 6:59 AM | 277 (10.8%) | 126 (6.7%) |
| 7:00 AM to 7:29 AM | 342 (13.3%) | 172 (9.1%) |
| 7:30 AM to 7:59 AM | 334 (13.0%) | 322 (17.0%) |
| 8:00 AM to 8:29 AM | 558 (21.7%) | 584 (30.8%) |
| 8:30 AM to 8:59 AM | 269 (10.5%) | 186 (9.8%) |
| 9:00 AM to 9:59 AM | 185 (7.2%) | 217 (11.5%) |
| 10:00 AM to 10:59 AM | 131 (5.1%) | 56 (3.0%) |
| 11:00 AM to 11:59 AM | 4 (0.2%) | 0 (0.0%) |
| 12:00 PM to 3:59 PM | 58 (2.3%) | 108 (5.7%) |
| 4:00 PM to 11:59 PM | 77 (3.0%) | 53 (2.8%) |
| Total | 2,566 (100.0%) | 1,894 (100.0%) |
Housing Occupancy in Haddonfield borough
Occupancy by Ownership in Haddonfield borough
Of the total 4,232 dwellings in Haddonfield borough, owner-occupied units account for 3,555 (84.0%), while renter-occupied units make up 677 (16.0%).
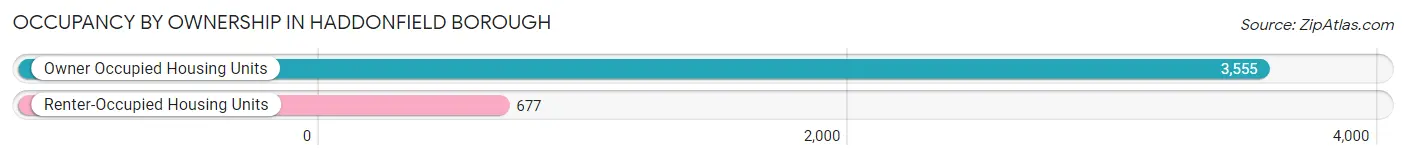
| Occupancy | # Housing Units | % Housing Units |
| Owner Occupied Housing Units | 3,555 | 84.0% |
| Renter-Occupied Housing Units | 677 | 16.0% |
| Total Occupied Housing Units | 4,232 | 100.0% |
Occupancy by Household Size in Haddonfield borough
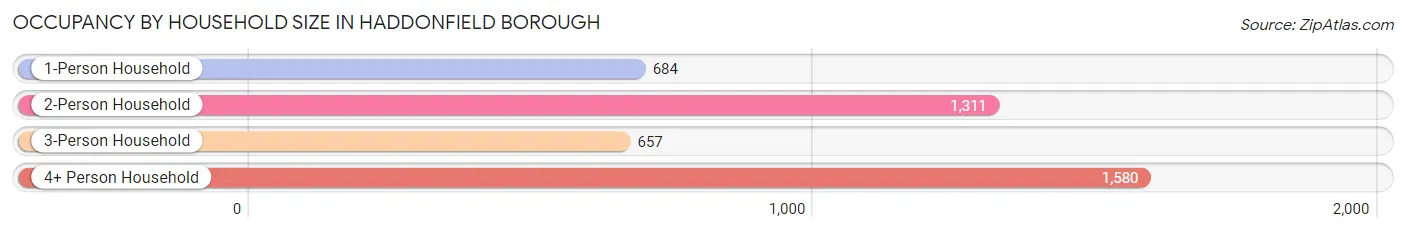
| Household Size | # Housing Units | % Housing Units |
| 1-Person Household | 684 | 16.2% |
| 2-Person Household | 1,311 | 31.0% |
| 3-Person Household | 657 | 15.5% |
| 4+ Person Household | 1,580 | 37.3% |
| Total Housing Units | 4,232 | 100.0% |
Occupancy by Ownership by Household Size in Haddonfield borough
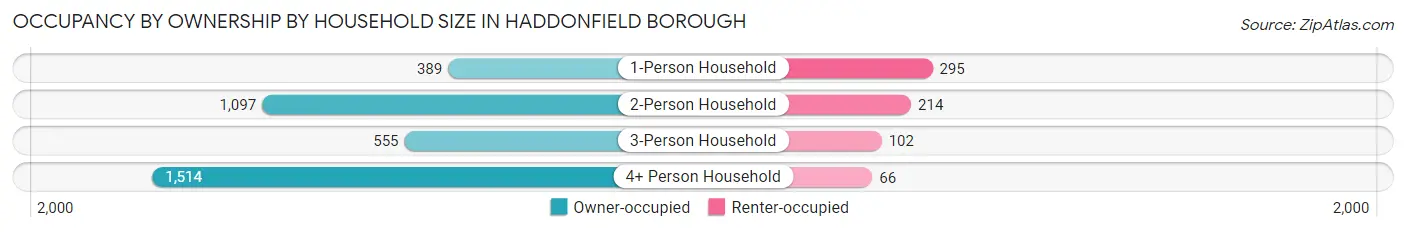
| Household Size | Owner-occupied | Renter-occupied |
| 1-Person Household | 389 (56.9%) | 295 (43.1%) |
| 2-Person Household | 1,097 (83.7%) | 214 (16.3%) |
| 3-Person Household | 555 (84.5%) | 102 (15.5%) |
| 4+ Person Household | 1,514 (95.8%) | 66 (4.2%) |
| Total Housing Units | 3,555 (84.0%) | 677 (16.0%) |
Occupancy by Educational Attainment in Haddonfield borough
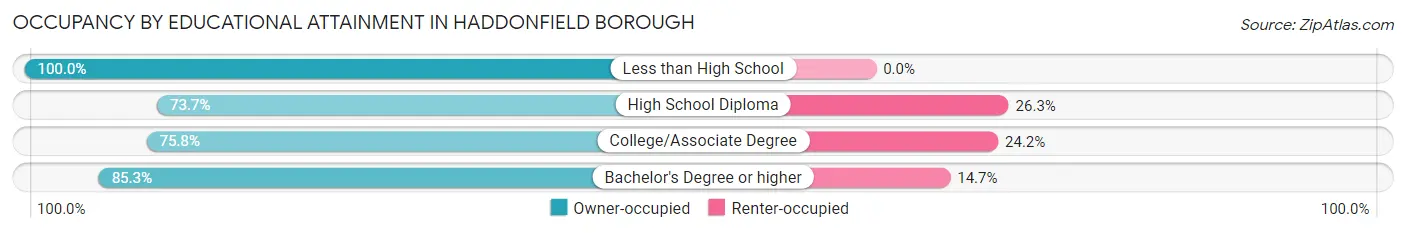
| Household Size | Owner-occupied | Renter-occupied |
| Less than High School | 28 (100.0%) | 0 (0.0%) |
| High School Diploma | 174 (73.7%) | 62 (26.3%) |
| College/Associate Degree | 254 (75.8%) | 81 (24.2%) |
| Bachelor's Degree or higher | 3,099 (85.3%) | 534 (14.7%) |
Occupancy by Age of Householder in Haddonfield borough
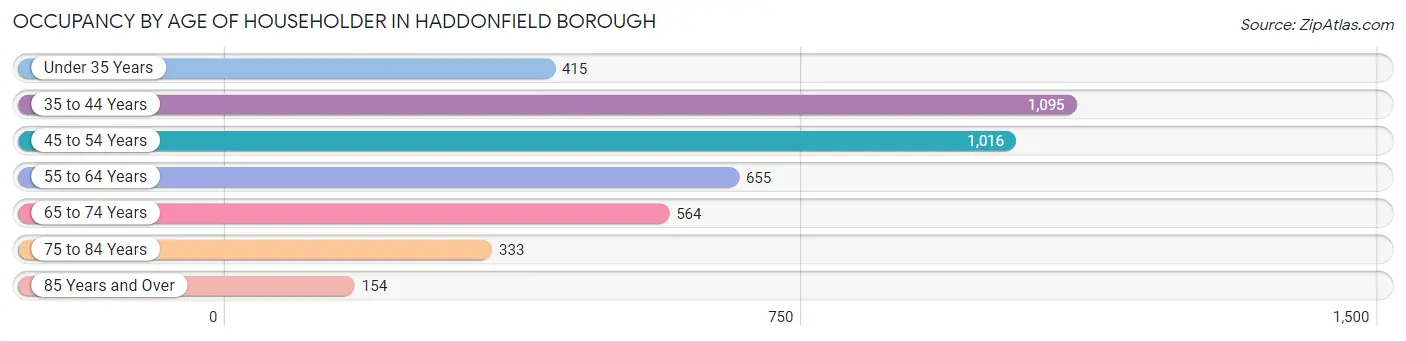
| Age Bracket | # Households | % Households |
| Under 35 Years | 415 | 9.8% |
| 35 to 44 Years | 1,095 | 25.9% |
| 45 to 54 Years | 1,016 | 24.0% |
| 55 to 64 Years | 655 | 15.5% |
| 65 to 74 Years | 564 | 13.3% |
| 75 to 84 Years | 333 | 7.9% |
| 85 Years and Over | 154 | 3.6% |
| Total | 4,232 | 100.0% |
Housing Finances in Haddonfield borough
Median Income by Occupancy in Haddonfield borough
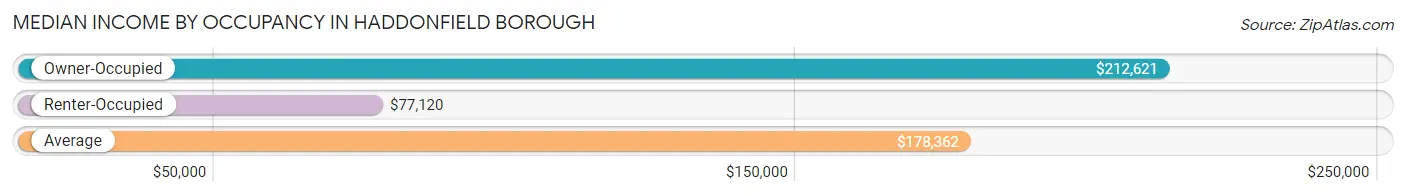
| Occupancy Type | # Households | Median Income |
| Owner-Occupied | 3,555 (84.0%) | $212,621 |
| Renter-Occupied | 677 (16.0%) | $77,120 |
| Average | 4,232 (100.0%) | $178,362 |
Occupancy by Householder Income Bracket in Haddonfield borough
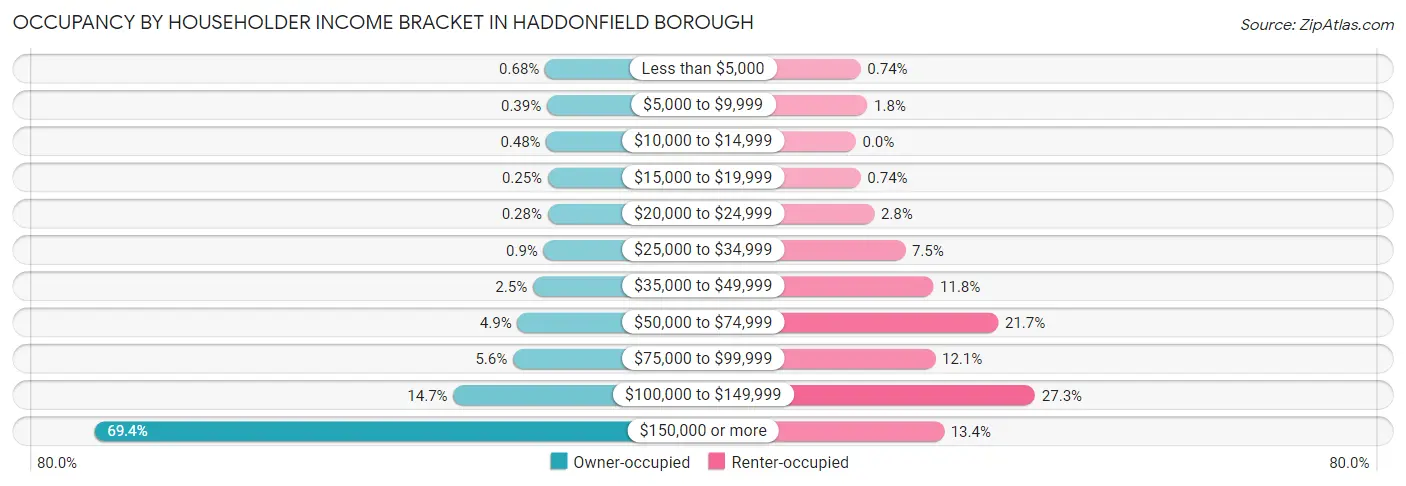
| Income Bracket | Owner-occupied | Renter-occupied |
| Less than $5,000 | 24 (0.7%) | 5 (0.7%) |
| $5,000 to $9,999 | 14 (0.4%) | 12 (1.8%) |
| $10,000 to $14,999 | 17 (0.5%) | 0 (0.0%) |
| $15,000 to $19,999 | 9 (0.3%) | 5 (0.7%) |
| $20,000 to $24,999 | 10 (0.3%) | 19 (2.8%) |
| $25,000 to $34,999 | 32 (0.9%) | 51 (7.5%) |
| $35,000 to $49,999 | 90 (2.5%) | 80 (11.8%) |
| $50,000 to $74,999 | 174 (4.9%) | 147 (21.7%) |
| $75,000 to $99,999 | 198 (5.6%) | 82 (12.1%) |
| $100,000 to $149,999 | 521 (14.7%) | 185 (27.3%) |
| $150,000 or more | 2,466 (69.4%) | 91 (13.4%) |
| Total | 3,555 (100.0%) | 677 (100.0%) |
Monthly Housing Cost Tiers in Haddonfield borough
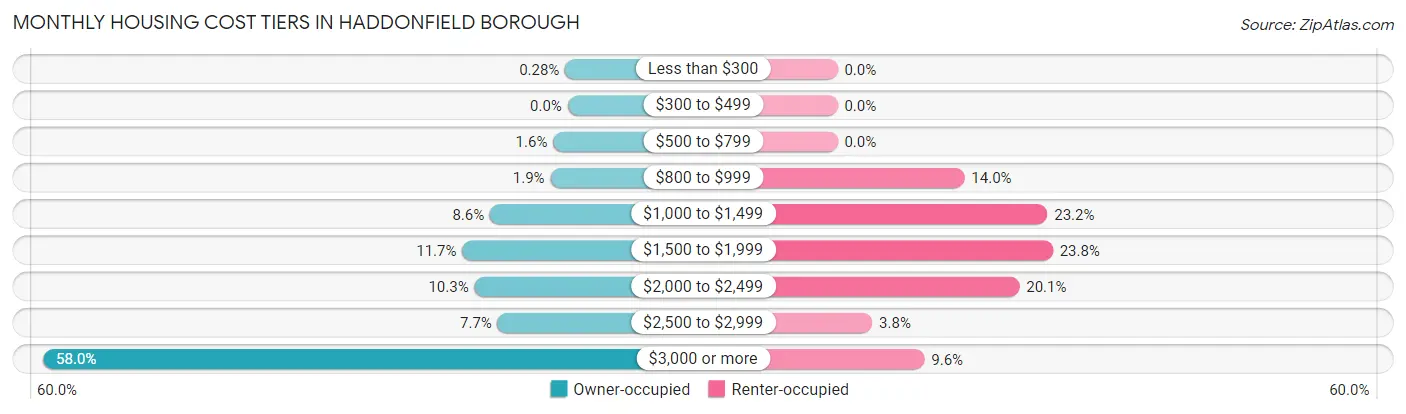
| Monthly Cost | Owner-occupied | Renter-occupied |
| Less than $300 | 10 (0.3%) | 0 (0.0%) |
| $300 to $499 | 0 (0.0%) | 0 (0.0%) |
| $500 to $799 | 57 (1.6%) | 0 (0.0%) |
| $800 to $999 | 68 (1.9%) | 95 (14.0%) |
| $1,000 to $1,499 | 305 (8.6%) | 157 (23.2%) |
| $1,500 to $1,999 | 414 (11.7%) | 161 (23.8%) |
| $2,000 to $2,499 | 366 (10.3%) | 136 (20.1%) |
| $2,500 to $2,999 | 275 (7.7%) | 26 (3.8%) |
| $3,000 or more | 2,060 (58.0%) | 65 (9.6%) |
| Total | 3,555 (100.0%) | 677 (100.0%) |
Physical Housing Characteristics in Haddonfield borough
Housing Structures in Haddonfield borough
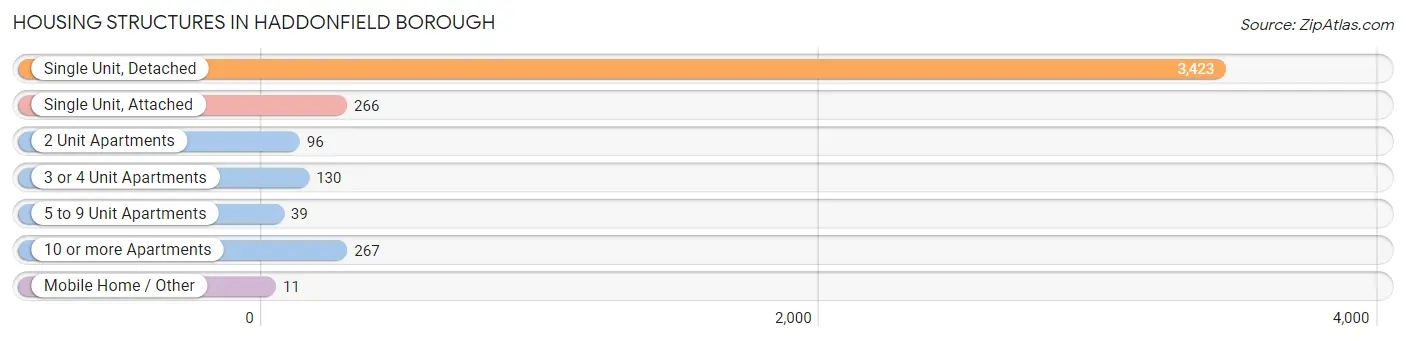
| Structure Type | # Housing Units | % Housing Units |
| Single Unit, Detached | 3,423 | 80.9% |
| Single Unit, Attached | 266 | 6.3% |
| 2 Unit Apartments | 96 | 2.3% |
| 3 or 4 Unit Apartments | 130 | 3.1% |
| 5 to 9 Unit Apartments | 39 | 0.9% |
| 10 or more Apartments | 267 | 6.3% |
| Mobile Home / Other | 11 | 0.3% |
| Total | 4,232 | 100.0% |
Housing Structures by Occupancy in Haddonfield borough
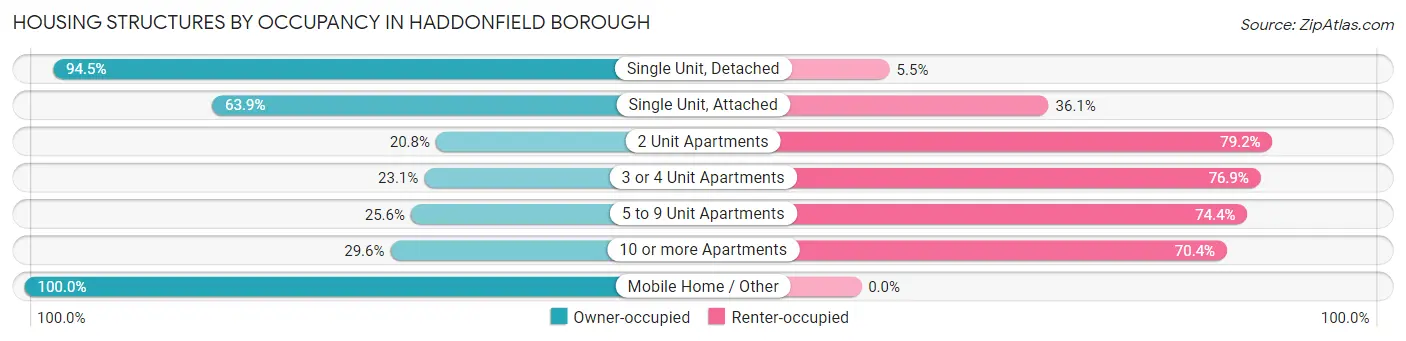
| Structure Type | Owner-occupied | Renter-occupied |
| Single Unit, Detached | 3,235 (94.5%) | 188 (5.5%) |
| Single Unit, Attached | 170 (63.9%) | 96 (36.1%) |
| 2 Unit Apartments | 20 (20.8%) | 76 (79.2%) |
| 3 or 4 Unit Apartments | 30 (23.1%) | 100 (76.9%) |
| 5 to 9 Unit Apartments | 10 (25.6%) | 29 (74.4%) |
| 10 or more Apartments | 79 (29.6%) | 188 (70.4%) |
| Mobile Home / Other | 11 (100.0%) | 0 (0.0%) |
| Total | 3,555 (84.0%) | 677 (16.0%) |
Housing Structures by Number of Rooms in Haddonfield borough
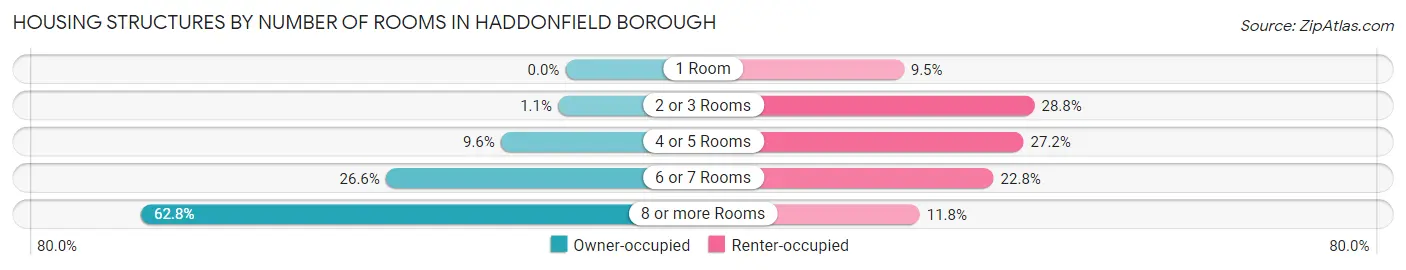
| Number of Rooms | Owner-occupied | Renter-occupied |
| 1 Room | 0 (0.0%) | 64 (9.5%) |
| 2 or 3 Rooms | 39 (1.1%) | 195 (28.8%) |
| 4 or 5 Rooms | 340 (9.6%) | 184 (27.2%) |
| 6 or 7 Rooms | 945 (26.6%) | 154 (22.8%) |
| 8 or more Rooms | 2,231 (62.8%) | 80 (11.8%) |
| Total | 3,555 (100.0%) | 677 (100.0%) |
Housing Structure by Heating Type in Haddonfield borough
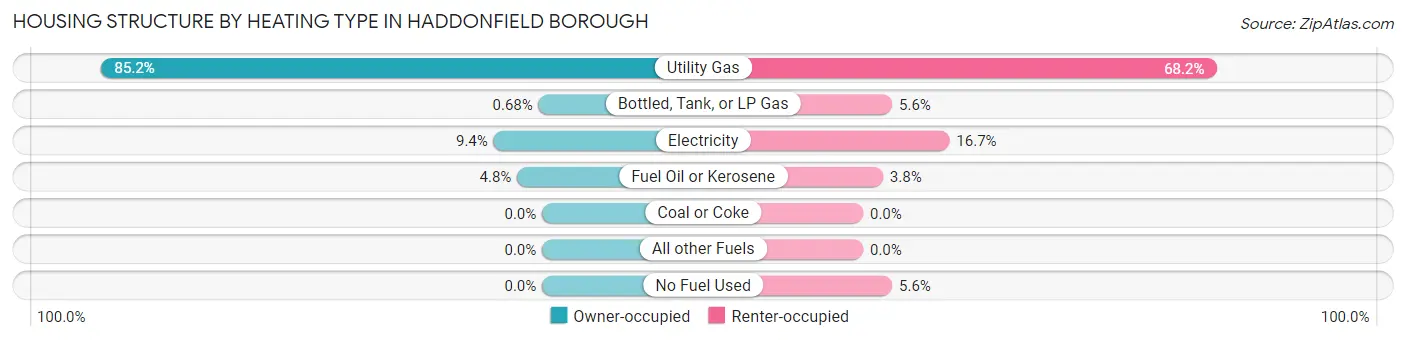
| Heating Type | Owner-occupied | Renter-occupied |
| Utility Gas | 3,027 (85.2%) | 462 (68.2%) |
| Bottled, Tank, or LP Gas | 24 (0.7%) | 38 (5.6%) |
| Electricity | 333 (9.4%) | 113 (16.7%) |
| Fuel Oil or Kerosene | 171 (4.8%) | 26 (3.8%) |
| Coal or Coke | 0 (0.0%) | 0 (0.0%) |
| All other Fuels | 0 (0.0%) | 0 (0.0%) |
| No Fuel Used | 0 (0.0%) | 38 (5.6%) |
| Total | 3,555 (100.0%) | 677 (100.0%) |
Household Vehicle Usage in Haddonfield borough
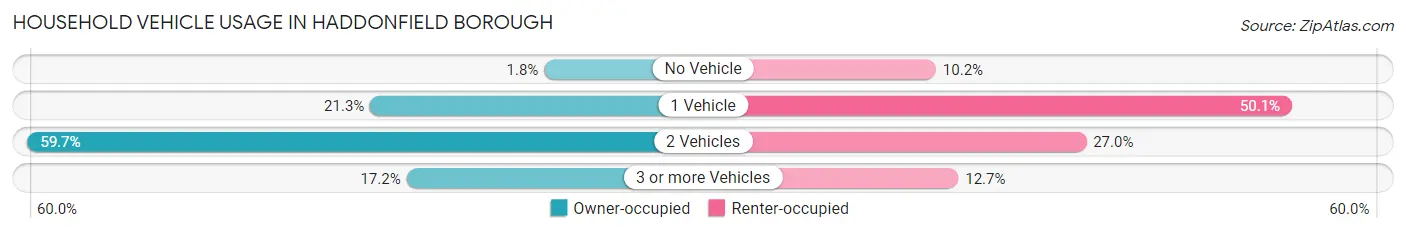
| Vehicles per Household | Owner-occupied | Renter-occupied |
| No Vehicle | 64 (1.8%) | 69 (10.2%) |
| 1 Vehicle | 757 (21.3%) | 339 (50.1%) |
| 2 Vehicles | 2,122 (59.7%) | 183 (27.0%) |
| 3 or more Vehicles | 612 (17.2%) | 86 (12.7%) |
| Total | 3,555 (100.0%) | 677 (100.0%) |
Real Estate & Mortgages in Haddonfield borough
Real Estate and Mortgage Overview in Haddonfield borough
| Characteristic | Without Mortgage | With Mortgage |
| Housing Units | 1,046 | 2,509 |
| Median Property Value | $523,300 | $661,400 |
| Median Household Income | $147,250 | $1,956 |
| Monthly Housing Costs | $1,501 | $1,979 |
| Real Estate Taxes | $10,001 | $0 |
Property Value by Mortgage Status in Haddonfield borough
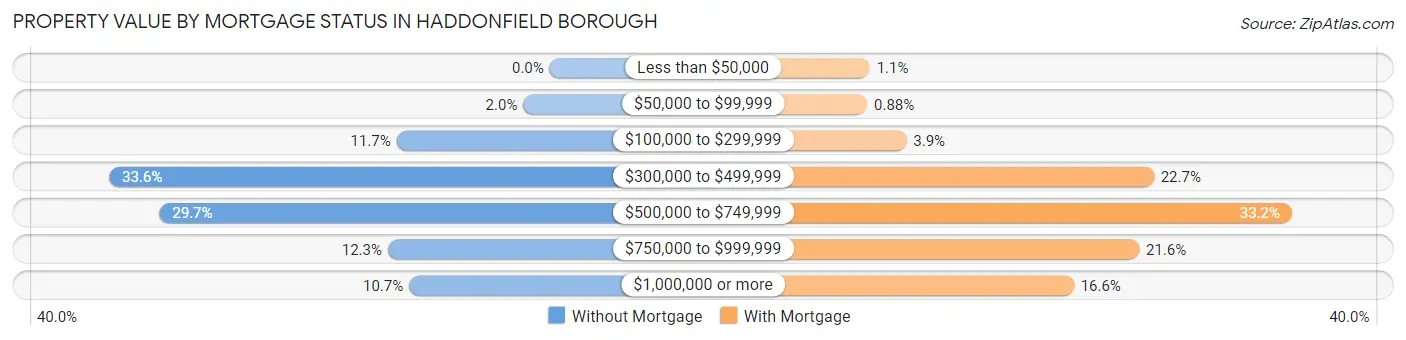
| Property Value | Without Mortgage | With Mortgage |
| Less than $50,000 | 0 (0.0%) | 27 (1.1%) |
| $50,000 to $99,999 | 21 (2.0%) | 22 (0.9%) |
| $100,000 to $299,999 | 122 (11.7%) | 97 (3.9%) |
| $300,000 to $499,999 | 351 (33.6%) | 570 (22.7%) |
| $500,000 to $749,999 | 311 (29.7%) | 834 (33.2%) |
| $750,000 to $999,999 | 129 (12.3%) | 542 (21.6%) |
| $1,000,000 or more | 112 (10.7%) | 417 (16.6%) |
| Total | 1,046 (100.0%) | 2,509 (100.0%) |
Household Income by Mortgage Status in Haddonfield borough
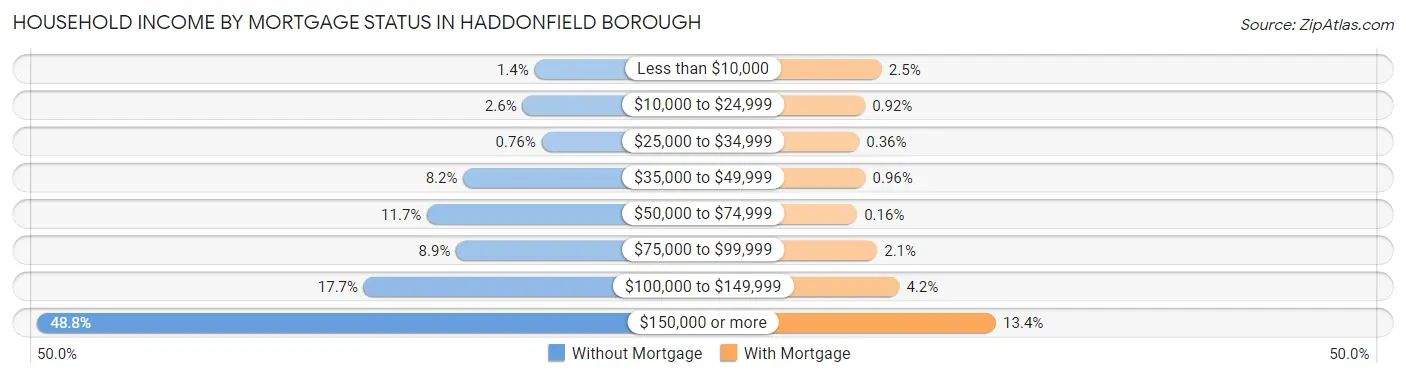
| Household Income | Without Mortgage | With Mortgage |
| Less than $10,000 | 15 (1.4%) | 63 (2.5%) |
| $10,000 to $24,999 | 27 (2.6%) | 23 (0.9%) |
| $25,000 to $34,999 | 8 (0.8%) | 9 (0.4%) |
| $35,000 to $49,999 | 86 (8.2%) | 24 (1.0%) |
| $50,000 to $74,999 | 122 (11.7%) | 4 (0.2%) |
| $75,000 to $99,999 | 93 (8.9%) | 52 (2.1%) |
| $100,000 to $149,999 | 185 (17.7%) | 105 (4.2%) |
| $150,000 or more | 510 (48.8%) | 336 (13.4%) |
| Total | 1,046 (100.0%) | 2,509 (100.0%) |
Property Value to Household Income Ratio in Haddonfield borough
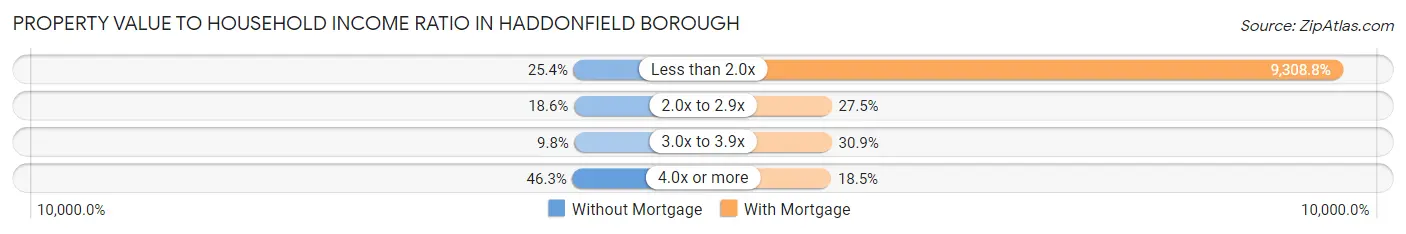
| Value-to-Income Ratio | Without Mortgage | With Mortgage |
| Less than 2.0x | 266 (25.4%) | 233,558 (9,308.8%) |
| 2.0x to 2.9x | 194 (18.5%) | 690 (27.5%) |
| 3.0x to 3.9x | 102 (9.8%) | 774 (30.8%) |
| 4.0x or more | 484 (46.3%) | 463 (18.4%) |
| Total | 1,046 (100.0%) | 2,509 (100.0%) |
Real Estate Taxes by Mortgage Status in Haddonfield borough
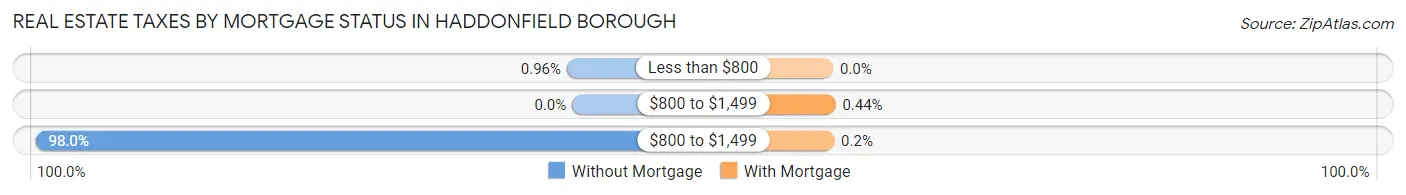
| Property Taxes | Without Mortgage | With Mortgage |
| Less than $800 | 10 (1.0%) | 0 (0.0%) |
| $800 to $1,499 | 0 (0.0%) | 11 (0.4%) |
| $800 to $1,499 | 1,025 (98.0%) | 5 (0.2%) |
| Total | 1,046 (100.0%) | 2,509 (100.0%) |
Health & Disability in Haddonfield borough
Health Insurance Coverage by Age in Haddonfield borough
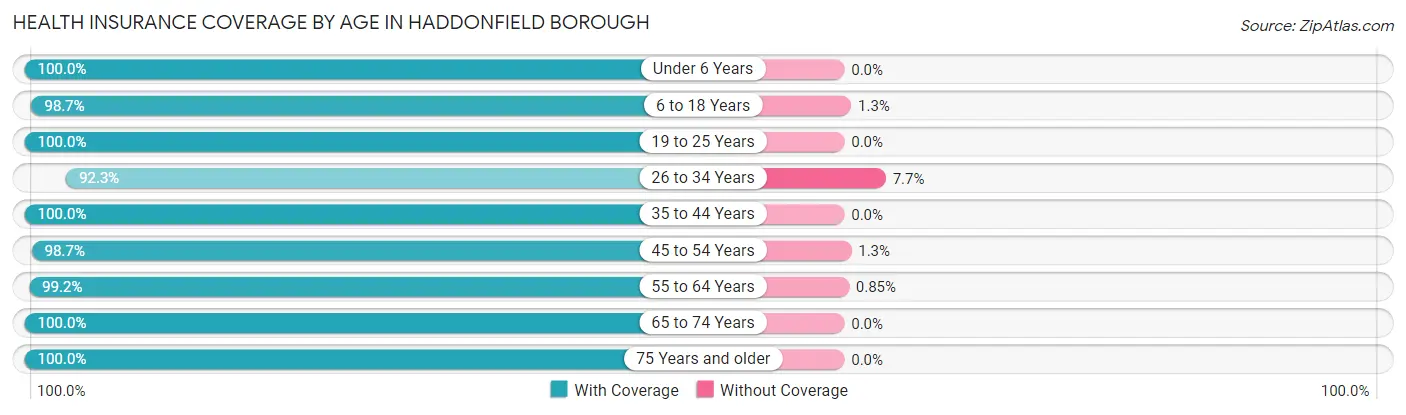
| Age Bracket | With Coverage | Without Coverage |
| Under 6 Years | 1,279 (100.0%) | 0 (0.0%) |
| 6 to 18 Years | 2,874 (98.7%) | 37 (1.3%) |
| 19 to 25 Years | 431 (100.0%) | 0 (0.0%) |
| 26 to 34 Years | 741 (92.3%) | 62 (7.7%) |
| 35 to 44 Years | 2,137 (100.0%) | 0 (0.0%) |
| 45 to 54 Years | 1,905 (98.7%) | 25 (1.3%) |
| 55 to 64 Years | 1,170 (99.2%) | 10 (0.9%) |
| 65 to 74 Years | 929 (100.0%) | 0 (0.0%) |
| 75 Years and older | 802 (100.0%) | 0 (0.0%) |
| Total | 12,268 (98.9%) | 134 (1.1%) |
Health Insurance Coverage by Citizenship Status in Haddonfield borough
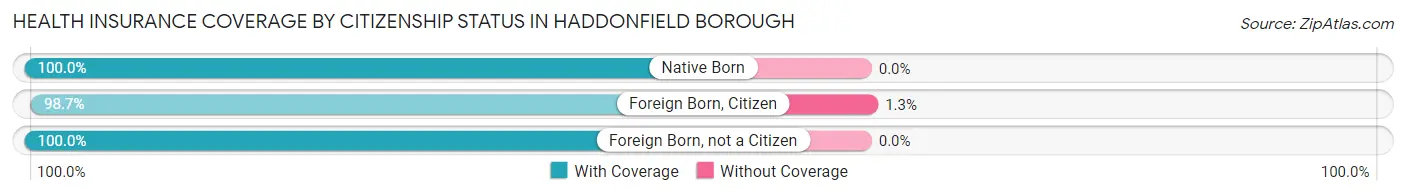
| Citizenship Status | With Coverage | Without Coverage |
| Native Born | 1,279 (100.0%) | 0 (0.0%) |
| Foreign Born, Citizen | 2,874 (98.7%) | 37 (1.3%) |
| Foreign Born, not a Citizen | 431 (100.0%) | 0 (0.0%) |
Health Insurance Coverage by Household Income in Haddonfield borough
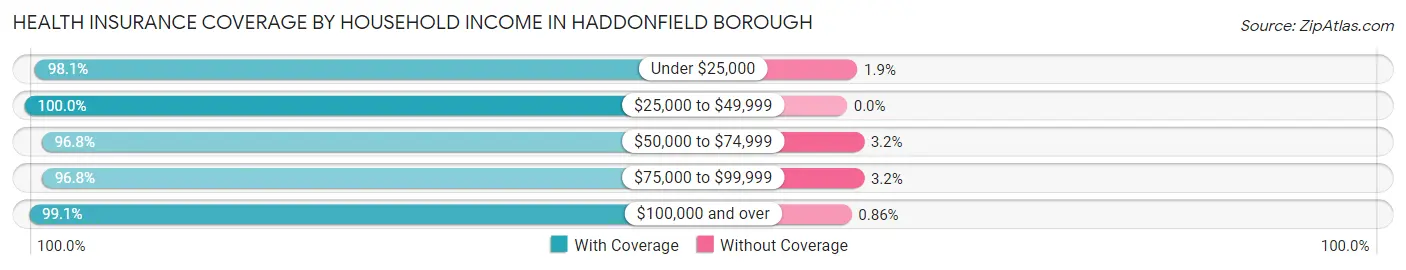
| Household Income | With Coverage | Without Coverage |
| Under $25,000 | 253 (98.1%) | 5 (1.9%) |
| $25,000 to $49,999 | 303 (100.0%) | 0 (0.0%) |
| $50,000 to $74,999 | 581 (96.8%) | 19 (3.2%) |
| $75,000 to $99,999 | 512 (96.8%) | 17 (3.2%) |
| $100,000 and over | 10,612 (99.1%) | 92 (0.9%) |
Public vs Private Health Insurance Coverage by Age in Haddonfield borough
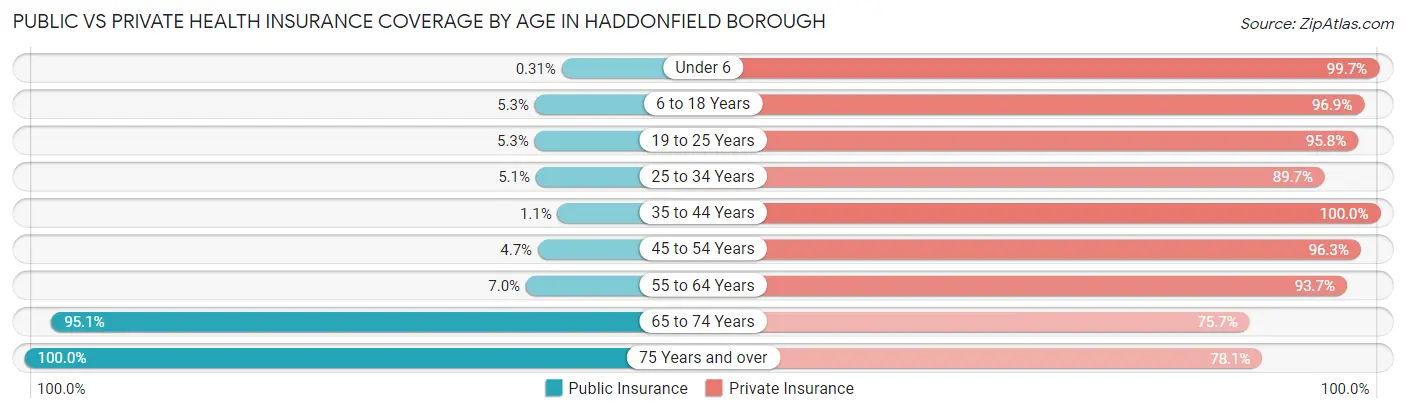
| Age Bracket | Public Insurance | Private Insurance |
| Under 6 | 4 (0.3%) | 1,275 (99.7%) |
| 6 to 18 Years | 154 (5.3%) | 2,822 (96.9%) |
| 19 to 25 Years | 23 (5.3%) | 413 (95.8%) |
| 25 to 34 Years | 41 (5.1%) | 720 (89.7%) |
| 35 to 44 Years | 23 (1.1%) | 2,136 (100.0%) |
| 45 to 54 Years | 91 (4.7%) | 1,859 (96.3%) |
| 55 to 64 Years | 82 (7.0%) | 1,106 (93.7%) |
| 65 to 74 Years | 883 (95.1%) | 703 (75.7%) |
| 75 Years and over | 802 (100.0%) | 626 (78.0%) |
| Total | 2,103 (17.0%) | 11,660 (94.0%) |
Disability Status by Sex by Age in Haddonfield borough
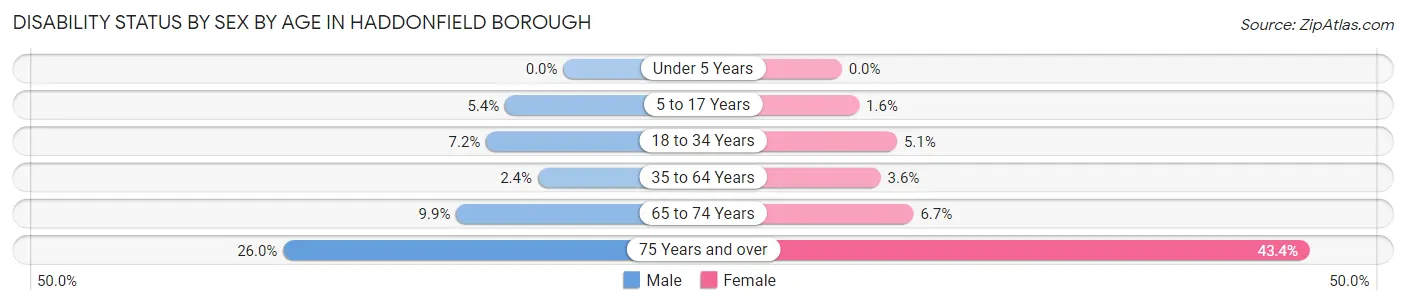
| Age Bracket | Male | Female |
| Under 5 Years | 0 (0.0%) | 0 (0.0%) |
| 5 to 17 Years | 89 (5.4%) | 22 (1.6%) |
| 18 to 34 Years | 41 (7.2%) | 38 (5.1%) |
| 35 to 64 Years | 61 (2.4%) | 96 (3.6%) |
| 65 to 74 Years | 49 (9.9%) | 29 (6.7%) |
| 75 Years and over | 78 (26.0%) | 218 (43.4%) |
Disability Class by Sex by Age in Haddonfield borough
Disability Class: Hearing Difficulty
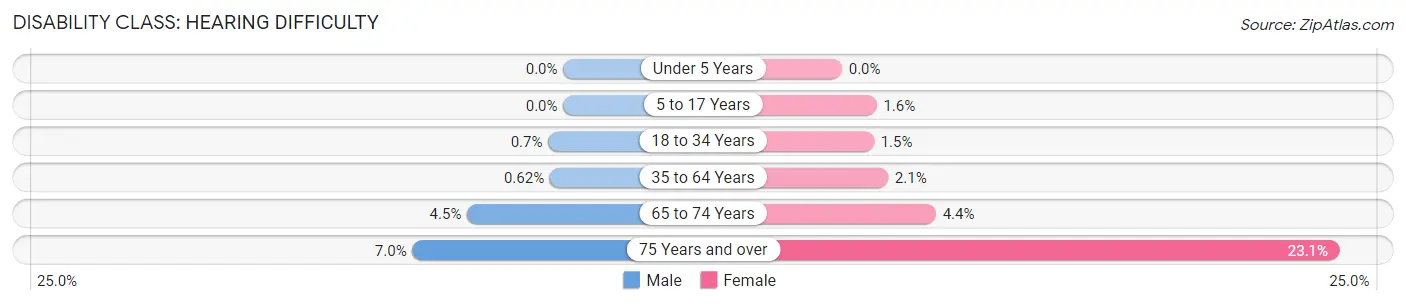
| Age Bracket | Male | Female |
| Under 5 Years | 0 (0.0%) | 0 (0.0%) |
| 5 to 17 Years | 0 (0.0%) | 22 (1.6%) |
| 18 to 34 Years | 4 (0.7%) | 11 (1.5%) |
| 35 to 64 Years | 16 (0.6%) | 57 (2.1%) |
| 65 to 74 Years | 22 (4.5%) | 19 (4.4%) |
| 75 Years and over | 21 (7.0%) | 116 (23.1%) |
Disability Class: Vision Difficulty
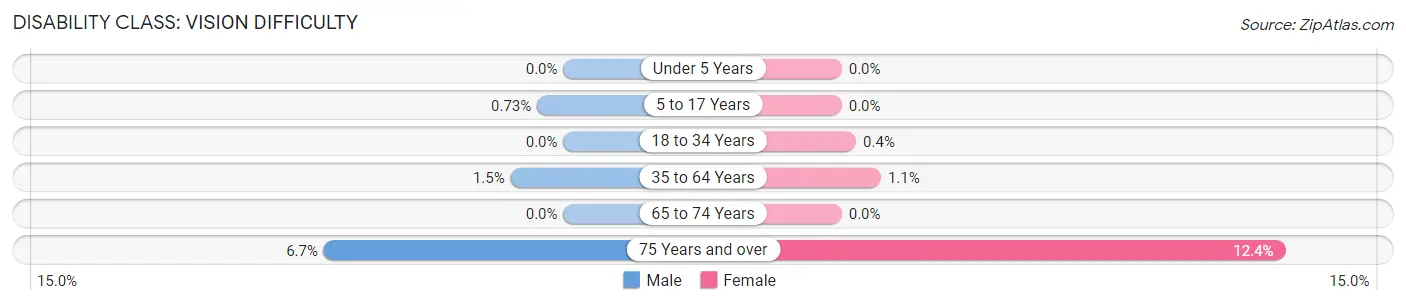
| Age Bracket | Male | Female |
| Under 5 Years | 0 (0.0%) | 0 (0.0%) |
| 5 to 17 Years | 12 (0.7%) | 0 (0.0%) |
| 18 to 34 Years | 0 (0.0%) | 3 (0.4%) |
| 35 to 64 Years | 38 (1.5%) | 29 (1.1%) |
| 65 to 74 Years | 0 (0.0%) | 0 (0.0%) |
| 75 Years and over | 20 (6.7%) | 62 (12.3%) |
Disability Class: Cognitive Difficulty
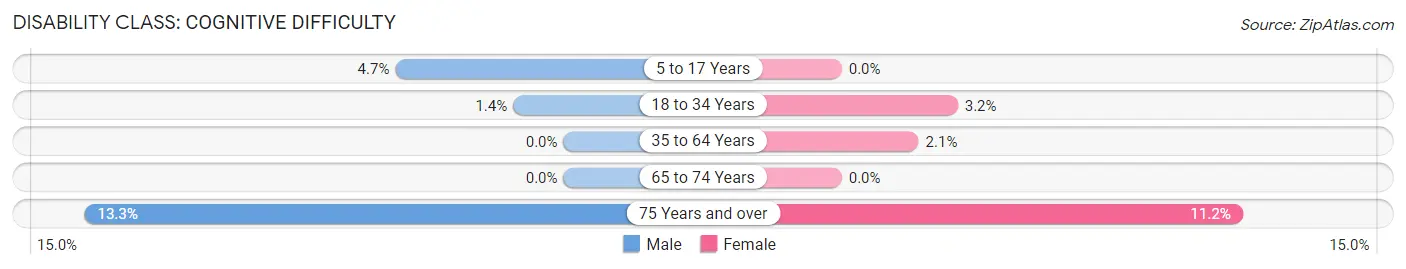
| Age Bracket | Male | Female |
| 5 to 17 Years | 77 (4.7%) | 0 (0.0%) |
| 18 to 34 Years | 8 (1.4%) | 24 (3.2%) |
| 35 to 64 Years | 0 (0.0%) | 57 (2.1%) |
| 65 to 74 Years | 0 (0.0%) | 0 (0.0%) |
| 75 Years and over | 40 (13.3%) | 56 (11.2%) |
Disability Class: Ambulatory Difficulty
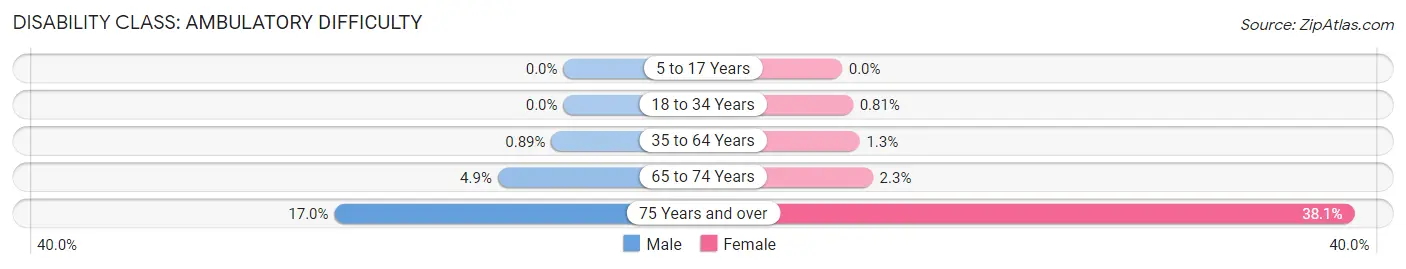
| Age Bracket | Male | Female |
| 5 to 17 Years | 0 (0.0%) | 0 (0.0%) |
| 18 to 34 Years | 0 (0.0%) | 6 (0.8%) |
| 35 to 64 Years | 23 (0.9%) | 35 (1.3%) |
| 65 to 74 Years | 24 (4.9%) | 10 (2.3%) |
| 75 Years and over | 51 (17.0%) | 191 (38.1%) |
Disability Class: Self-Care Difficulty
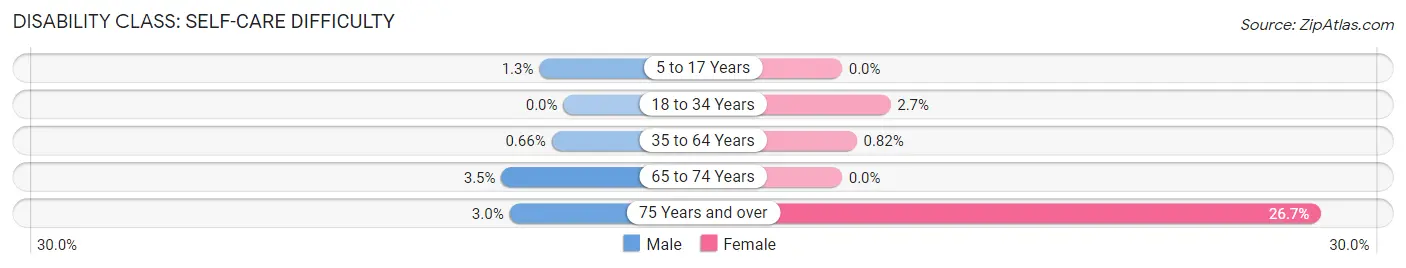
| Age Bracket | Male | Female |
| 5 to 17 Years | 22 (1.3%) | 0 (0.0%) |
| 18 to 34 Years | 0 (0.0%) | 20 (2.7%) |
| 35 to 64 Years | 17 (0.7%) | 22 (0.8%) |
| 65 to 74 Years | 17 (3.5%) | 0 (0.0%) |
| 75 Years and over | 9 (3.0%) | 134 (26.7%) |
Technology Access in Haddonfield borough
Computing Device Access in Haddonfield borough
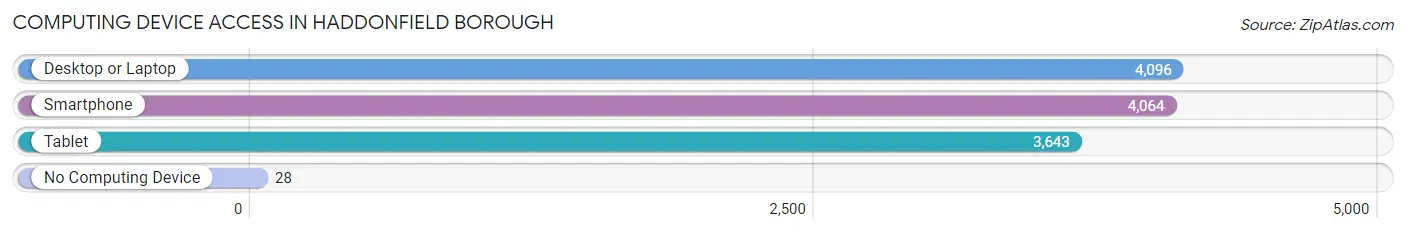
| Device Type | # Households | % Households |
| Desktop or Laptop | 4,096 | 96.8% |
| Smartphone | 4,064 | 96.0% |
| Tablet | 3,643 | 86.1% |
| No Computing Device | 28 | 0.7% |
| Total | 4,232 | 100.0% |
Internet Access in Haddonfield borough
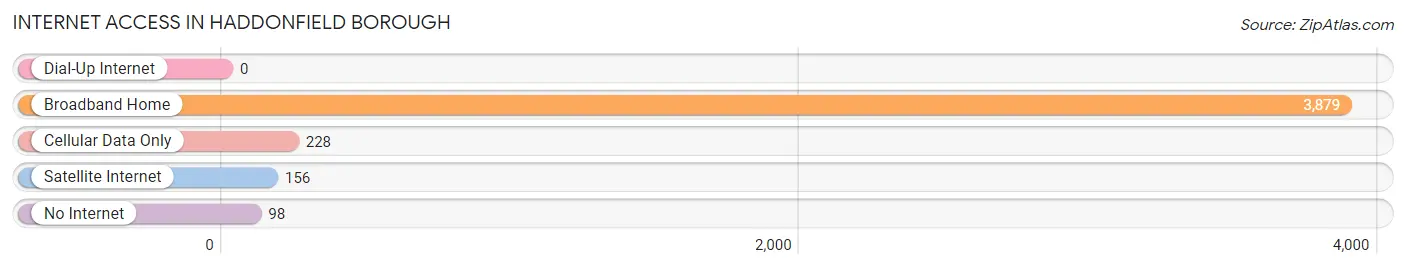
| Internet Type | # Households | % Households |
| Dial-Up Internet | 0 | 0.0% |
| Broadband Home | 3,879 | 91.7% |
| Cellular Data Only | 228 | 5.4% |
| Satellite Internet | 156 | 3.7% |
| No Internet | 98 | 2.3% |
| Total | 4,232 | 100.0% |
Haddonfield borough Summary
Haddonfield Borough is a small town located in Camden County, New Jersey. It is situated on the banks of the Cooper River and is bordered by Cherry Hill Township to the north, Haddon Township to the east, and Haddon Heights to the south. The borough is home to approximately 11,000 people and is known for its historic charm and quaint downtown area.
History
Haddonfield was first settled in 1682 by Elizabeth Haddon, a Quaker from England. She purchased 500 acres of land from the local Native Americans and established a small farming community. The town was named after her and was officially incorporated in 1875.
During the Revolutionary War, Haddonfield was a major supply center for the Continental Army. The town was also the site of the Battle of Red Bank in 1777, where the British were defeated by the Continental Army.
In the 19th century, Haddonfield became a popular summer resort for wealthy Philadelphians. The town was known for its beautiful Victorian homes and its picturesque downtown area.
Geography
Haddonfield is located in the Delaware Valley region of New Jersey. The borough is situated on the banks of the Cooper River and is bordered by Cherry Hill Township to the north, Haddon Township to the east, and Haddon Heights to the south. The borough covers an area of 2.2 square miles and is home to approximately 11,000 people.
The borough is located in a temperate climate zone and experiences four distinct seasons. Summers are typically hot and humid, while winters are cold and snowy. The average annual temperature is around 55 degrees Fahrenheit.
Economy
Haddonfield’s economy is largely based on tourism and retail. The borough is home to a variety of shops, restaurants, and other businesses. The downtown area is a popular destination for visitors and locals alike.
The borough is also home to several large employers, including the Kennedy Health System, the Virtua Health System, and the Cooper University Health Care System. These employers provide jobs for many of the borough’s residents.
Demographics
As of the 2010 census, Haddonfield had a population of 11,593 people. The racial makeup of the borough was 87.3% White, 5.2% African American, 0.3% Native American, 4.2% Asian, and 2.9% from other races. Hispanic or Latino of any race were 8.2% of the population.
The median household income in Haddonfield was $90,845 in 2019. The median age of the borough’s residents was 43.7 years. The homeownership rate was 79.2%.
Conclusion
Haddonfield Borough is a small town located in Camden County, New Jersey. It is situated on the banks of the Cooper River and is bordered by Cherry Hill Township to the north, Haddon Township to the east, and Haddon Heights to the south. The borough is home to approximately 11,000 people and is known for its historic charm and quaint downtown area. The borough’s economy is largely based on tourism and retail, and it is home to several large employers. The population of Haddonfield is predominantly white, with a median household income of $90,845 in 2019.
Common Questions
What is Per Capita Income in Haddonfield borough?
Per Capita income in Haddonfield borough is $90,870.
What is the Median Family Income in Haddonfield borough?
Median Family Income in Haddonfield borough is $219,122.
What is the Median Household income in Haddonfield borough?
Median Household Income in Haddonfield borough is $178,362.
What is Income or Wage Gap in Haddonfield borough?
Income or Wage Gap in Haddonfield borough is 43.1%.
Women in Haddonfield borough earn 56.9 cents for every dollar earned by a man.
What is Family Income Deficit in Haddonfield borough?
Family Income Deficit in Haddonfield borough is $20,998.
Families that are below poverty line in Haddonfield borough earn $20,998 less on average than the poverty threshold level.
What is Inequality or Gini Index in Haddonfield borough?
Inequality or Gini Index in Haddonfield borough is 0.47.
What is the Total Population of Haddonfield borough?
Total Population of Haddonfield borough is 12,456.
What is the Total Male Population of Haddonfield borough?
Total Male Population of Haddonfield borough is 6,029.
What is the Total Female Population of Haddonfield borough?
Total Female Population of Haddonfield borough is 6,427.
What is the Ratio of Males per 100 Females in Haddonfield borough?
There are 93.81 Males per 100 Females in Haddonfield borough.
What is the Ratio of Females per 100 Males in Haddonfield borough?
There are 106.60 Females per 100 Males in Haddonfield borough.
What is the Median Population Age in Haddonfield borough?
Median Population Age in Haddonfield borough is 39.4 Years.
What is the Average Family Size in Haddonfield borough
Average Family Size in Haddonfield borough is 3.3 People.
What is the Average Household Size in Haddonfield borough
Average Household Size in Haddonfield borough is 2.9 People.
How Large is the Labor Force in Haddonfield borough?
There are 6,242 People in the Labor Forcein in Haddonfield borough.
What is the Percentage of People in the Labor Force in Haddonfield borough?
70.0% of People are in the Labor Force in Haddonfield borough.
What is the Unemployment Rate in Haddonfield borough?
Unemployment Rate in Haddonfield borough is 3.4%.